
Key Insights
The 3D medical and surgical imaging platform market is experiencing robust growth, driven by the increasing adoption of minimally invasive surgical procedures, the rising prevalence of chronic diseases requiring advanced imaging, and technological advancements leading to improved image quality and processing speed. The market's Compound Annual Growth Rate (CAGR) of 18% from 2019 to 2033 signifies substantial expansion, projecting a significant market value by 2033. This growth is fueled by the shift towards cloud-based solutions offering enhanced accessibility, collaboration, and cost-effectiveness compared to on-premise systems. Furthermore, the integration of artificial intelligence (AI) and machine learning (ML) in image analysis is revolutionizing diagnostics and surgical planning, leading to improved patient outcomes and reduced procedural time. Segmentation analysis reveals strong growth across all application areas, including CT scans, MRI, ultrasound, and neurological and spinal imaging, reflecting the broad applicability of 3D imaging technology across various medical specialties. The competitive landscape is dynamic, featuring established players like Siemens Healthcare and Medtronic alongside innovative startups, fostering continuous innovation and market expansion.
The on-premise segment currently holds a larger market share, but the cloud segment is exhibiting rapid growth, driven by the advantages of scalability, accessibility, and reduced infrastructure costs. Hardware components constitute a significant portion of the market value, while software and solutions are witnessing increased demand due to their role in image processing, analysis, and integration with other medical systems. North America currently dominates the market due to high healthcare expenditure and technological advancements, but the Asia-Pacific region is poised for significant growth driven by increasing healthcare investments and rising adoption rates. Regulatory approvals and reimbursement policies will continue to play a crucial role in shaping market dynamics, particularly in emerging markets. Challenges such as high initial investment costs, data security concerns, and the need for skilled professionals to operate and interpret the complex imagery are factors that need to be addressed for continued market growth.
3D Medical and Surgical Imaging Platform Industry Market Report: 2019-2033
This comprehensive report provides a detailed analysis of the 3D Medical and Surgical Imaging Platform market, encompassing market dynamics, growth trends, regional segmentation, product landscape, key players, and future outlook. The study period covers 2019-2033, with 2025 as the base and estimated year. The forecast period spans 2025-2033, and the historical period encompasses 2019-2024. The report offers invaluable insights for industry professionals, investors, and strategic decision-makers seeking to navigate this rapidly evolving sector.
3D Medical and Surgical Imaging Platform Industry Market Dynamics & Structure
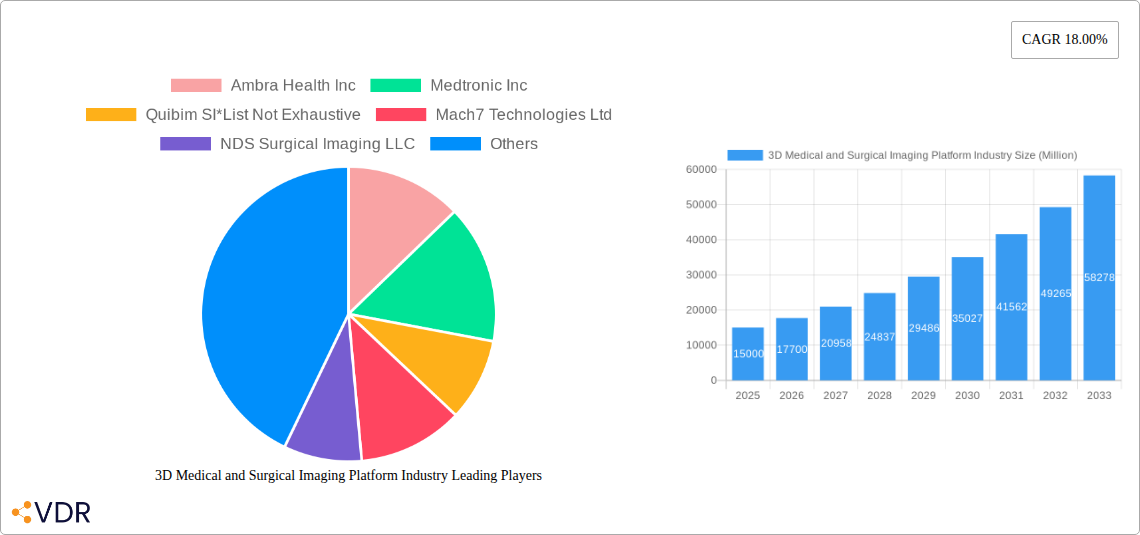
The 3D Medical and Surgical Imaging Platform market is characterized by a moderately concentrated landscape, with key players such as Ambra Health Inc, Medtronic Inc, and Siemens Healthcare Pvt Ltd holding significant market share. However, the market also features numerous smaller, specialized companies driving innovation. Technological advancements, particularly in AI-powered image analysis and robotic surgery, are primary growth drivers. Stringent regulatory frameworks, especially concerning data privacy and medical device approvals (like FDA approvals), influence market dynamics significantly. Competitive pressures arise from both established players and emerging companies offering innovative solutions. The market is segmented by deployment (on-premise, cloud), component (hardware, software & solutions), and application (CT-scan, MRI, Ultrasound, Neurological Imaging, Spinal Imaging, Other Applications). M&A activity, exemplified by Intelerad's acquisition of Ambra Health, signifies market consolidation and the pursuit of advanced capabilities.
- Market Concentration: Moderately concentrated, with top players holding approximately xx% market share in 2025.
- Technological Innovation: AI-powered image analysis, robotic surgery, and improved visualization techniques are key drivers.
- Regulatory Landscape: Stringent regulations on data privacy and medical device approvals influence market access and growth.
- Competitive Substitutes: Limited direct substitutes, but alternative imaging modalities and diagnostic techniques pose indirect competition.
- End-User Demographics: Hospitals, surgical centers, and diagnostic imaging clinics constitute the primary end-users.
- M&A Trends: Significant M&A activity is observed, indicating consolidation and a race for advanced technologies and market share. Deal volume in 2024 was estimated at xx deals, valued at $xx Million.
3D Medical and Surgical Imaging Platform Industry Growth Trends & Insights
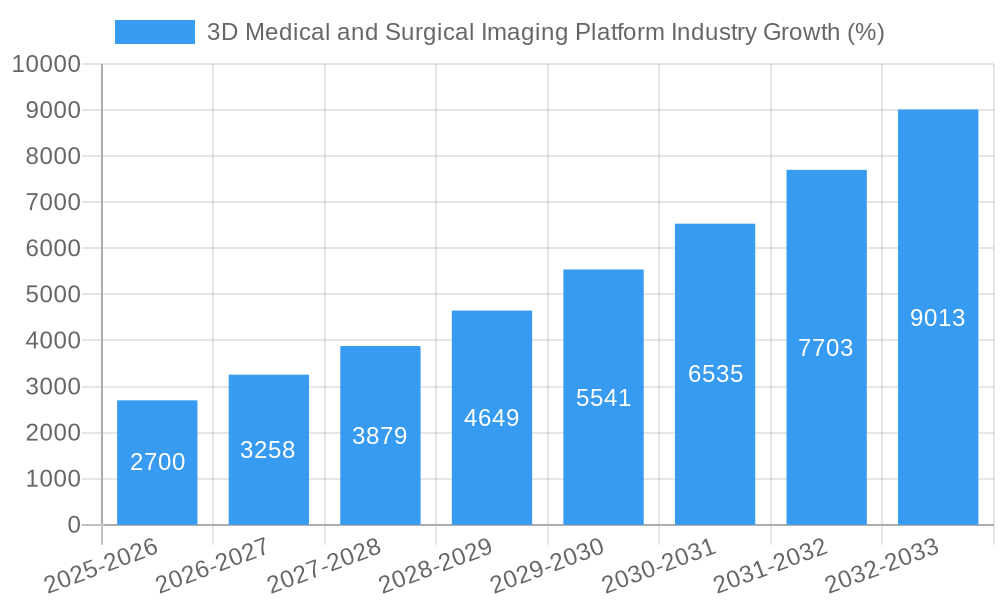
The global 3D Medical and Surgical Imaging Platform market is experiencing robust growth, driven by increasing adoption rates in various medical applications. The market size, valued at $xx Million in 2025, is projected to reach $xx Million by 2033, exhibiting a CAGR of xx% during the forecast period. This growth is fueled by technological advancements resulting in improved image quality, reduced procedure times, and enhanced diagnostic accuracy. The increasing prevalence of chronic diseases and rising demand for minimally invasive surgical procedures are further boosting market expansion. Consumer behavior shifts towards personalized medicine and advanced diagnostic capabilities are also contributing factors. Disruptions are mainly seen in the development of Artificial Intelligence based diagnostic tools. Cloud based deployment of such technologies are also rapidly growing.
Dominant Regions, Countries, or Segments in 3D Medical and Surgical Imaging Platform Industry
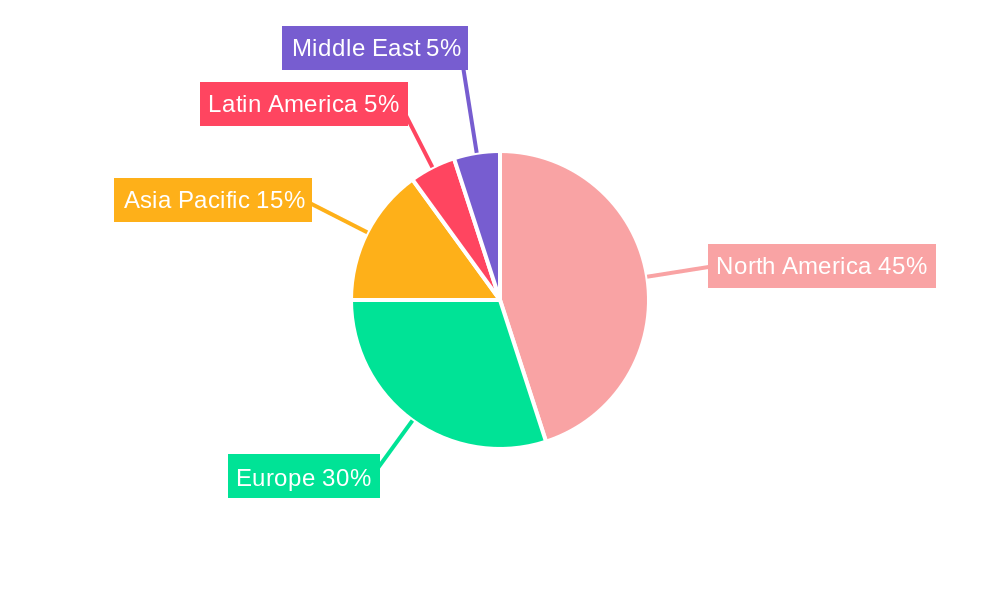
North America currently dominates the 3D Medical and Surgical Imaging Platform market, driven by robust healthcare infrastructure, high adoption rates of advanced technologies, and favorable regulatory environment. However, the Asia-Pacific region is anticipated to witness the fastest growth rate during the forecast period due to rising healthcare expenditure, expanding medical tourism, and increasing investments in advanced medical technologies.
- By Deployment: The cloud-based segment is projected to experience significant growth due to enhanced scalability, accessibility, and cost-effectiveness.
- By Component: The software & solutions segment is expected to dominate due to increased demand for sophisticated image processing and analysis tools.
- By Application: Neurological and spinal imaging applications are experiencing robust growth driven by the growing prevalence of neurological disorders and spinal injuries.
Key Drivers:
- Strong government support for healthcare infrastructure development in specific regions (e.g. Asia-Pacific).
- Increasing investments in R&D and technological advancements.
- Rising prevalence of chronic diseases and increasing demand for minimally invasive surgical procedures.
- Favorable regulatory environment in key regions like North America and Europe.
3D Medical and Surgical Imaging Platform Industry Product Landscape
The market offers a diverse range of products, including 3D imaging systems, software solutions for image processing and analysis, and robotic surgical systems integrated with imaging capabilities. These products are characterized by advancements in resolution, speed, and ease of use. Key innovations include AI-driven image analysis, enabling quicker and more accurate diagnosis. Many systems offer unique selling propositions centered around improved visualization, workflow efficiency, and enhanced surgical precision.
Key Drivers, Barriers & Challenges in 3D Medical and Surgical Imaging Platform Industry
Key Drivers:
- Technological advancements, leading to improved image quality, faster processing times, and greater diagnostic accuracy.
- Rising prevalence of chronic diseases increasing the demand for advanced diagnostic and therapeutic tools.
- Growing adoption of minimally invasive surgical procedures, driving demand for precise imaging guidance.
Challenges:
- High initial investment costs associated with advanced 3D imaging systems can limit adoption in resource-constrained settings.
- Data security and privacy concerns are significant barriers to cloud-based deployment. Breaches cost approximately $xx Million per incident.
- Regulatory complexities and lengthy approval processes can hinder market entry and growth of new technologies.
Emerging Opportunities in 3D Medical and Surgical Imaging Platform Industry
Untapped markets in developing economies represent significant growth potential. The integration of 3D imaging with AI and machine learning for improved diagnostic accuracy presents substantial opportunities. The increasing demand for personalized medicine is driving the need for tailored imaging solutions, which create further opportunities for specialized software and applications.
Growth Accelerators in the 3D Medical and Surgical Imaging Platform Industry Industry
Technological breakthroughs in areas such as AI, augmented reality (AR), and virtual reality (VR) are poised to significantly accelerate market growth. Strategic partnerships between imaging platform providers and healthcare institutions are fostering broader adoption and market expansion. Increased investments in R&D by both established and new players are driving innovation and the development of cutting-edge technologies.
Key Players Shaping the 3D Medical and Surgical Imaging Platform Market
- Ambra Health Inc
- Medtronic Inc
- Quibim SI
- Mach7 Technologies Ltd
- NDS Surgical Imaging LLC
- Siemens Healthcare Pvt Ltd
- Arterys Inc
- Pie Medical Imaging BV
- NerveVision Inc
- Kitware Inc
- Brainlab AG
- Depuy Synthes Inc
- Olympus Corporation
Notable Milestones in 3D Medical and Surgical Imaging Platform Industry Sector
- October 2021: Intelerad Medical Systems Inc. acquires Ambra Health for USD 1.7 billion, signifying market consolidation in the cloud-based medical imaging sector.
- February 2021: Brainlab receives FDA approval for its Loop-X Mobile Imaging Robot and Cirq robotic surgical system, expanding its presence in the US market.
In-Depth 3D Medical and Surgical Imaging Platform Industry Market Outlook
The 3D Medical and Surgical Imaging Platform market is poised for continued robust growth, driven by technological advancements, increasing healthcare spending, and a growing demand for advanced diagnostic and therapeutic tools. Strategic opportunities exist in developing innovative applications leveraging AI and machine learning, expanding into untapped markets, and forging strategic partnerships to accelerate market penetration and adoption. The focus on personalized medicine and improved surgical precision will remain key growth drivers in the coming years.
3D Medical and Surgical Imaging Platform Industry Segmentation
-
1. Deployment
- 1.1. On-premise
- 1.2. Cloud
-
2. Component
- 2.1. Hardware
- 2.2. Software & Solution
-
3. Application
- 3.1. CT-Scan
- 3.2. MRI
- 3.3. Ultrasound
- 3.4. Neurological Imaging
- 3.5. Spinal Imaging
- 3.6. Other Applications
3D Medical and Surgical Imaging Platform Industry Segmentation By Geography
- 1. North America
- 2. Europe
- 3. Asia Pacific
- 4. Latin America
- 5. Middle East
3D Medical and Surgical Imaging Platform Industry REPORT HIGHLIGHTS
| Aspects | Details |
|---|---|
| Study Period | 2019-2033 |
| Base Year | 2024 |
| Estimated Year | 2025 |
| Forecast Period | 2025-2033 |
| Historical Period | 2019-2024 |
| Growth Rate | CAGR of 18.00% from 2019-2033 |
| Segmentation |
|
Table of Contents
- 1. Introduction
- 1.1. Research Scope
- 1.2. Market Segmentation
- 1.3. Research Methodology
- 1.4. Definitions and Assumptions
- 2. Executive Summary
- 2.1. Introduction
- 3. Market Dynamics
- 3.1. Introduction
- 3.2. Market Drivers
- 3.2.1. Rising Demand for 3D Imaging in Diagnosing and Monitoring of Chronic Diseases; Rising Healthcare Expenditures; Development of Modern Visualization Methods and Technology Platforms
- 3.3. Market Restrains
- 3.3.1. High Cost of Satellite Communications
- 3.4. Market Trends
- 3.4.1. Cloud Expected to Witness Significant Growth
- 4. Market Factor Analysis
- 4.1. Porters Five Forces
- 4.2. Supply/Value Chain
- 4.3. PESTEL analysis
- 4.4. Market Entropy
- 4.5. Patent/Trademark Analysis
- 5. Global 3D Medical and Surgical Imaging Platform Industry Analysis, Insights and Forecast, 2019-2031
- 5.1. Market Analysis, Insights and Forecast - by Deployment
- 5.1.1. On-premise
- 5.1.2. Cloud
- 5.2. Market Analysis, Insights and Forecast - by Component
- 5.2.1. Hardware
- 5.2.2. Software & Solution
- 5.3. Market Analysis, Insights and Forecast - by Application
- 5.3.1. CT-Scan
- 5.3.2. MRI
- 5.3.3. Ultrasound
- 5.3.4. Neurological Imaging
- 5.3.5. Spinal Imaging
- 5.3.6. Other Applications
- 5.4. Market Analysis, Insights and Forecast - by Region
- 5.4.1. North America
- 5.4.2. Europe
- 5.4.3. Asia Pacific
- 5.4.4. Latin America
- 5.4.5. Middle East
- 5.1. Market Analysis, Insights and Forecast - by Deployment
- 6. North America 3D Medical and Surgical Imaging Platform Industry Analysis, Insights and Forecast, 2019-2031
- 6.1. Market Analysis, Insights and Forecast - by Deployment
- 6.1.1. On-premise
- 6.1.2. Cloud
- 6.2. Market Analysis, Insights and Forecast - by Component
- 6.2.1. Hardware
- 6.2.2. Software & Solution
- 6.3. Market Analysis, Insights and Forecast - by Application
- 6.3.1. CT-Scan
- 6.3.2. MRI
- 6.3.3. Ultrasound
- 6.3.4. Neurological Imaging
- 6.3.5. Spinal Imaging
- 6.3.6. Other Applications
- 6.1. Market Analysis, Insights and Forecast - by Deployment
- 7. Europe 3D Medical and Surgical Imaging Platform Industry Analysis, Insights and Forecast, 2019-2031
- 7.1. Market Analysis, Insights and Forecast - by Deployment
- 7.1.1. On-premise
- 7.1.2. Cloud
- 7.2. Market Analysis, Insights and Forecast - by Component
- 7.2.1. Hardware
- 7.2.2. Software & Solution
- 7.3. Market Analysis, Insights and Forecast - by Application
- 7.3.1. CT-Scan
- 7.3.2. MRI
- 7.3.3. Ultrasound
- 7.3.4. Neurological Imaging
- 7.3.5. Spinal Imaging
- 7.3.6. Other Applications
- 7.1. Market Analysis, Insights and Forecast - by Deployment
- 8. Asia Pacific 3D Medical and Surgical Imaging Platform Industry Analysis, Insights and Forecast, 2019-2031
- 8.1. Market Analysis, Insights and Forecast - by Deployment
- 8.1.1. On-premise
- 8.1.2. Cloud
- 8.2. Market Analysis, Insights and Forecast - by Component
- 8.2.1. Hardware
- 8.2.2. Software & Solution
- 8.3. Market Analysis, Insights and Forecast - by Application
- 8.3.1. CT-Scan
- 8.3.2. MRI
- 8.3.3. Ultrasound
- 8.3.4. Neurological Imaging
- 8.3.5. Spinal Imaging
- 8.3.6. Other Applications
- 8.1. Market Analysis, Insights and Forecast - by Deployment
- 9. Latin America 3D Medical and Surgical Imaging Platform Industry Analysis, Insights and Forecast, 2019-2031
- 9.1. Market Analysis, Insights and Forecast - by Deployment
- 9.1.1. On-premise
- 9.1.2. Cloud
- 9.2. Market Analysis, Insights and Forecast - by Component
- 9.2.1. Hardware
- 9.2.2. Software & Solution
- 9.3. Market Analysis, Insights and Forecast - by Application
- 9.3.1. CT-Scan
- 9.3.2. MRI
- 9.3.3. Ultrasound
- 9.3.4. Neurological Imaging
- 9.3.5. Spinal Imaging
- 9.3.6. Other Applications
- 9.1. Market Analysis, Insights and Forecast - by Deployment
- 10. Middle East 3D Medical and Surgical Imaging Platform Industry Analysis, Insights and Forecast, 2019-2031
- 10.1. Market Analysis, Insights and Forecast - by Deployment
- 10.1.1. On-premise
- 10.1.2. Cloud
- 10.2. Market Analysis, Insights and Forecast - by Component
- 10.2.1. Hardware
- 10.2.2. Software & Solution
- 10.3. Market Analysis, Insights and Forecast - by Application
- 10.3.1. CT-Scan
- 10.3.2. MRI
- 10.3.3. Ultrasound
- 10.3.4. Neurological Imaging
- 10.3.5. Spinal Imaging
- 10.3.6. Other Applications
- 10.1. Market Analysis, Insights and Forecast - by Deployment
- 11. North America 3D Medical and Surgical Imaging Platform Industry Analysis, Insights and Forecast, 2019-2031
- 11.1. Market Analysis, Insights and Forecast - By Country/Sub-region
- 11.1.1.
- 12. Europe 3D Medical and Surgical Imaging Platform Industry Analysis, Insights and Forecast, 2019-2031
- 12.1. Market Analysis, Insights and Forecast - By Country/Sub-region
- 12.1.1.
- 13. Asia Pacific 3D Medical and Surgical Imaging Platform Industry Analysis, Insights and Forecast, 2019-2031
- 13.1. Market Analysis, Insights and Forecast - By Country/Sub-region
- 13.1.1.
- 14. Latin America 3D Medical and Surgical Imaging Platform Industry Analysis, Insights and Forecast, 2019-2031
- 14.1. Market Analysis, Insights and Forecast - By Country/Sub-region
- 14.1.1.
- 15. Middle East 3D Medical and Surgical Imaging Platform Industry Analysis, Insights and Forecast, 2019-2031
- 15.1. Market Analysis, Insights and Forecast - By Country/Sub-region
- 15.1.1.
- 16. Competitive Analysis
- 16.1. Global Market Share Analysis 2024
- 16.2. Company Profiles
- 16.2.1 Ambra Health Inc
- 16.2.1.1. Overview
- 16.2.1.2. Products
- 16.2.1.3. SWOT Analysis
- 16.2.1.4. Recent Developments
- 16.2.1.5. Financials (Based on Availability)
- 16.2.2 Medtronic Inc
- 16.2.2.1. Overview
- 16.2.2.2. Products
- 16.2.2.3. SWOT Analysis
- 16.2.2.4. Recent Developments
- 16.2.2.5. Financials (Based on Availability)
- 16.2.3 Quibim SI*List Not Exhaustive
- 16.2.3.1. Overview
- 16.2.3.2. Products
- 16.2.3.3. SWOT Analysis
- 16.2.3.4. Recent Developments
- 16.2.3.5. Financials (Based on Availability)
- 16.2.4 Mach7 Technologies Ltd
- 16.2.4.1. Overview
- 16.2.4.2. Products
- 16.2.4.3. SWOT Analysis
- 16.2.4.4. Recent Developments
- 16.2.4.5. Financials (Based on Availability)
- 16.2.5 NDS Surgical Imaging LLC
- 16.2.5.1. Overview
- 16.2.5.2. Products
- 16.2.5.3. SWOT Analysis
- 16.2.5.4. Recent Developments
- 16.2.5.5. Financials (Based on Availability)
- 16.2.6 Siemens Healthcare Pvt Ltd
- 16.2.6.1. Overview
- 16.2.6.2. Products
- 16.2.6.3. SWOT Analysis
- 16.2.6.4. Recent Developments
- 16.2.6.5. Financials (Based on Availability)
- 16.2.7 Arterys Inc
- 16.2.7.1. Overview
- 16.2.7.2. Products
- 16.2.7.3. SWOT Analysis
- 16.2.7.4. Recent Developments
- 16.2.7.5. Financials (Based on Availability)
- 16.2.8 Pie Medical Imaging BV
- 16.2.8.1. Overview
- 16.2.8.2. Products
- 16.2.8.3. SWOT Analysis
- 16.2.8.4. Recent Developments
- 16.2.8.5. Financials (Based on Availability)
- 16.2.9 NerveVision Inc
- 16.2.9.1. Overview
- 16.2.9.2. Products
- 16.2.9.3. SWOT Analysis
- 16.2.9.4. Recent Developments
- 16.2.9.5. Financials (Based on Availability)
- 16.2.10 Kitware Inc
- 16.2.10.1. Overview
- 16.2.10.2. Products
- 16.2.10.3. SWOT Analysis
- 16.2.10.4. Recent Developments
- 16.2.10.5. Financials (Based on Availability)
- 16.2.11 Brainlab AG
- 16.2.11.1. Overview
- 16.2.11.2. Products
- 16.2.11.3. SWOT Analysis
- 16.2.11.4. Recent Developments
- 16.2.11.5. Financials (Based on Availability)
- 16.2.12 Depuy Synthes Inc
- 16.2.12.1. Overview
- 16.2.12.2. Products
- 16.2.12.3. SWOT Analysis
- 16.2.12.4. Recent Developments
- 16.2.12.5. Financials (Based on Availability)
- 16.2.13 Olympus Corporation
- 16.2.13.1. Overview
- 16.2.13.2. Products
- 16.2.13.3. SWOT Analysis
- 16.2.13.4. Recent Developments
- 16.2.13.5. Financials (Based on Availability)
- 16.2.1 Ambra Health Inc
List of Figures
- Figure 1: Global 3D Medical and Surgical Imaging Platform Industry Revenue Breakdown (Million, %) by Region 2024 & 2032
- Figure 2: North America 3D Medical and Surgical Imaging Platform Industry Revenue (Million), by Country 2024 & 2032
- Figure 3: North America 3D Medical and Surgical Imaging Platform Industry Revenue Share (%), by Country 2024 & 2032
- Figure 4: Europe 3D Medical and Surgical Imaging Platform Industry Revenue (Million), by Country 2024 & 2032
- Figure 5: Europe 3D Medical and Surgical Imaging Platform Industry Revenue Share (%), by Country 2024 & 2032
- Figure 6: Asia Pacific 3D Medical and Surgical Imaging Platform Industry Revenue (Million), by Country 2024 & 2032
- Figure 7: Asia Pacific 3D Medical and Surgical Imaging Platform Industry Revenue Share (%), by Country 2024 & 2032
- Figure 8: Latin America 3D Medical and Surgical Imaging Platform Industry Revenue (Million), by Country 2024 & 2032
- Figure 9: Latin America 3D Medical and Surgical Imaging Platform Industry Revenue Share (%), by Country 2024 & 2032
- Figure 10: Middle East 3D Medical and Surgical Imaging Platform Industry Revenue (Million), by Country 2024 & 2032
- Figure 11: Middle East 3D Medical and Surgical Imaging Platform Industry Revenue Share (%), by Country 2024 & 2032
- Figure 12: North America 3D Medical and Surgical Imaging Platform Industry Revenue (Million), by Deployment 2024 & 2032
- Figure 13: North America 3D Medical and Surgical Imaging Platform Industry Revenue Share (%), by Deployment 2024 & 2032
- Figure 14: North America 3D Medical and Surgical Imaging Platform Industry Revenue (Million), by Component 2024 & 2032
- Figure 15: North America 3D Medical and Surgical Imaging Platform Industry Revenue Share (%), by Component 2024 & 2032
- Figure 16: North America 3D Medical and Surgical Imaging Platform Industry Revenue (Million), by Application 2024 & 2032
- Figure 17: North America 3D Medical and Surgical Imaging Platform Industry Revenue Share (%), by Application 2024 & 2032
- Figure 18: North America 3D Medical and Surgical Imaging Platform Industry Revenue (Million), by Country 2024 & 2032
- Figure 19: North America 3D Medical and Surgical Imaging Platform Industry Revenue Share (%), by Country 2024 & 2032
- Figure 20: Europe 3D Medical and Surgical Imaging Platform Industry Revenue (Million), by Deployment 2024 & 2032
- Figure 21: Europe 3D Medical and Surgical Imaging Platform Industry Revenue Share (%), by Deployment 2024 & 2032
- Figure 22: Europe 3D Medical and Surgical Imaging Platform Industry Revenue (Million), by Component 2024 & 2032
- Figure 23: Europe 3D Medical and Surgical Imaging Platform Industry Revenue Share (%), by Component 2024 & 2032
- Figure 24: Europe 3D Medical and Surgical Imaging Platform Industry Revenue (Million), by Application 2024 & 2032
- Figure 25: Europe 3D Medical and Surgical Imaging Platform Industry Revenue Share (%), by Application 2024 & 2032
- Figure 26: Europe 3D Medical and Surgical Imaging Platform Industry Revenue (Million), by Country 2024 & 2032
- Figure 27: Europe 3D Medical and Surgical Imaging Platform Industry Revenue Share (%), by Country 2024 & 2032
- Figure 28: Asia Pacific 3D Medical and Surgical Imaging Platform Industry Revenue (Million), by Deployment 2024 & 2032
- Figure 29: Asia Pacific 3D Medical and Surgical Imaging Platform Industry Revenue Share (%), by Deployment 2024 & 2032
- Figure 30: Asia Pacific 3D Medical and Surgical Imaging Platform Industry Revenue (Million), by Component 2024 & 2032
- Figure 31: Asia Pacific 3D Medical and Surgical Imaging Platform Industry Revenue Share (%), by Component 2024 & 2032
- Figure 32: Asia Pacific 3D Medical and Surgical Imaging Platform Industry Revenue (Million), by Application 2024 & 2032
- Figure 33: Asia Pacific 3D Medical and Surgical Imaging Platform Industry Revenue Share (%), by Application 2024 & 2032
- Figure 34: Asia Pacific 3D Medical and Surgical Imaging Platform Industry Revenue (Million), by Country 2024 & 2032
- Figure 35: Asia Pacific 3D Medical and Surgical Imaging Platform Industry Revenue Share (%), by Country 2024 & 2032
- Figure 36: Latin America 3D Medical and Surgical Imaging Platform Industry Revenue (Million), by Deployment 2024 & 2032
- Figure 37: Latin America 3D Medical and Surgical Imaging Platform Industry Revenue Share (%), by Deployment 2024 & 2032
- Figure 38: Latin America 3D Medical and Surgical Imaging Platform Industry Revenue (Million), by Component 2024 & 2032
- Figure 39: Latin America 3D Medical and Surgical Imaging Platform Industry Revenue Share (%), by Component 2024 & 2032
- Figure 40: Latin America 3D Medical and Surgical Imaging Platform Industry Revenue (Million), by Application 2024 & 2032
- Figure 41: Latin America 3D Medical and Surgical Imaging Platform Industry Revenue Share (%), by Application 2024 & 2032
- Figure 42: Latin America 3D Medical and Surgical Imaging Platform Industry Revenue (Million), by Country 2024 & 2032
- Figure 43: Latin America 3D Medical and Surgical Imaging Platform Industry Revenue Share (%), by Country 2024 & 2032
- Figure 44: Middle East 3D Medical and Surgical Imaging Platform Industry Revenue (Million), by Deployment 2024 & 2032
- Figure 45: Middle East 3D Medical and Surgical Imaging Platform Industry Revenue Share (%), by Deployment 2024 & 2032
- Figure 46: Middle East 3D Medical and Surgical Imaging Platform Industry Revenue (Million), by Component 2024 & 2032
- Figure 47: Middle East 3D Medical and Surgical Imaging Platform Industry Revenue Share (%), by Component 2024 & 2032
- Figure 48: Middle East 3D Medical and Surgical Imaging Platform Industry Revenue (Million), by Application 2024 & 2032
- Figure 49: Middle East 3D Medical and Surgical Imaging Platform Industry Revenue Share (%), by Application 2024 & 2032
- Figure 50: Middle East 3D Medical and Surgical Imaging Platform Industry Revenue (Million), by Country 2024 & 2032
- Figure 51: Middle East 3D Medical and Surgical Imaging Platform Industry Revenue Share (%), by Country 2024 & 2032
List of Tables
- Table 1: Global 3D Medical and Surgical Imaging Platform Industry Revenue Million Forecast, by Region 2019 & 2032
- Table 2: Global 3D Medical and Surgical Imaging Platform Industry Revenue Million Forecast, by Deployment 2019 & 2032
- Table 3: Global 3D Medical and Surgical Imaging Platform Industry Revenue Million Forecast, by Component 2019 & 2032
- Table 4: Global 3D Medical and Surgical Imaging Platform Industry Revenue Million Forecast, by Application 2019 & 2032
- Table 5: Global 3D Medical and Surgical Imaging Platform Industry Revenue Million Forecast, by Region 2019 & 2032
- Table 6: Global 3D Medical and Surgical Imaging Platform Industry Revenue Million Forecast, by Country 2019 & 2032
- Table 7: 3D Medical and Surgical Imaging Platform Industry Revenue (Million) Forecast, by Application 2019 & 2032
- Table 8: Global 3D Medical and Surgical Imaging Platform Industry Revenue Million Forecast, by Country 2019 & 2032
- Table 9: 3D Medical and Surgical Imaging Platform Industry Revenue (Million) Forecast, by Application 2019 & 2032
- Table 10: Global 3D Medical and Surgical Imaging Platform Industry Revenue Million Forecast, by Country 2019 & 2032
- Table 11: 3D Medical and Surgical Imaging Platform Industry Revenue (Million) Forecast, by Application 2019 & 2032
- Table 12: Global 3D Medical and Surgical Imaging Platform Industry Revenue Million Forecast, by Country 2019 & 2032
- Table 13: 3D Medical and Surgical Imaging Platform Industry Revenue (Million) Forecast, by Application 2019 & 2032
- Table 14: Global 3D Medical and Surgical Imaging Platform Industry Revenue Million Forecast, by Country 2019 & 2032
- Table 15: 3D Medical and Surgical Imaging Platform Industry Revenue (Million) Forecast, by Application 2019 & 2032
- Table 16: Global 3D Medical and Surgical Imaging Platform Industry Revenue Million Forecast, by Deployment 2019 & 2032
- Table 17: Global 3D Medical and Surgical Imaging Platform Industry Revenue Million Forecast, by Component 2019 & 2032
- Table 18: Global 3D Medical and Surgical Imaging Platform Industry Revenue Million Forecast, by Application 2019 & 2032
- Table 19: Global 3D Medical and Surgical Imaging Platform Industry Revenue Million Forecast, by Country 2019 & 2032
- Table 20: Global 3D Medical and Surgical Imaging Platform Industry Revenue Million Forecast, by Deployment 2019 & 2032
- Table 21: Global 3D Medical and Surgical Imaging Platform Industry Revenue Million Forecast, by Component 2019 & 2032
- Table 22: Global 3D Medical and Surgical Imaging Platform Industry Revenue Million Forecast, by Application 2019 & 2032
- Table 23: Global 3D Medical and Surgical Imaging Platform Industry Revenue Million Forecast, by Country 2019 & 2032
- Table 24: Global 3D Medical and Surgical Imaging Platform Industry Revenue Million Forecast, by Deployment 2019 & 2032
- Table 25: Global 3D Medical and Surgical Imaging Platform Industry Revenue Million Forecast, by Component 2019 & 2032
- Table 26: Global 3D Medical and Surgical Imaging Platform Industry Revenue Million Forecast, by Application 2019 & 2032
- Table 27: Global 3D Medical and Surgical Imaging Platform Industry Revenue Million Forecast, by Country 2019 & 2032
- Table 28: Global 3D Medical and Surgical Imaging Platform Industry Revenue Million Forecast, by Deployment 2019 & 2032
- Table 29: Global 3D Medical and Surgical Imaging Platform Industry Revenue Million Forecast, by Component 2019 & 2032
- Table 30: Global 3D Medical and Surgical Imaging Platform Industry Revenue Million Forecast, by Application 2019 & 2032
- Table 31: Global 3D Medical and Surgical Imaging Platform Industry Revenue Million Forecast, by Country 2019 & 2032
- Table 32: Global 3D Medical and Surgical Imaging Platform Industry Revenue Million Forecast, by Deployment 2019 & 2032
- Table 33: Global 3D Medical and Surgical Imaging Platform Industry Revenue Million Forecast, by Component 2019 & 2032
- Table 34: Global 3D Medical and Surgical Imaging Platform Industry Revenue Million Forecast, by Application 2019 & 2032
- Table 35: Global 3D Medical and Surgical Imaging Platform Industry Revenue Million Forecast, by Country 2019 & 2032
Frequently Asked Questions
1. What is the projected Compound Annual Growth Rate (CAGR) of the 3D Medical and Surgical Imaging Platform Industry?
The projected CAGR is approximately 18.00%.
2. Which companies are prominent players in the 3D Medical and Surgical Imaging Platform Industry?
Key companies in the market include Ambra Health Inc, Medtronic Inc, Quibim SI*List Not Exhaustive, Mach7 Technologies Ltd, NDS Surgical Imaging LLC, Siemens Healthcare Pvt Ltd, Arterys Inc, Pie Medical Imaging BV, NerveVision Inc, Kitware Inc, Brainlab AG, Depuy Synthes Inc, Olympus Corporation.
3. What are the main segments of the 3D Medical and Surgical Imaging Platform Industry?
The market segments include Deployment, Component, Application.
4. Can you provide details about the market size?
The market size is estimated to be USD XX Million as of 2022.
5. What are some drivers contributing to market growth?
Rising Demand for 3D Imaging in Diagnosing and Monitoring of Chronic Diseases; Rising Healthcare Expenditures; Development of Modern Visualization Methods and Technology Platforms.
6. What are the notable trends driving market growth?
Cloud Expected to Witness Significant Growth.
7. Are there any restraints impacting market growth?
High Cost of Satellite Communications.
8. Can you provide examples of recent developments in the market?
October 2021 - Intelerad Medical Systems Inc. has agreed to buy Ambra Health, a cloud-based medical imaging manager, in a deal worth USD 1.7 billion. Ambra Health will be acquired over USD 250 million by Intelerad, a medical imaging software company backed by European buyout firm Hg.
9. What pricing options are available for accessing the report?
Pricing options include single-user, multi-user, and enterprise licenses priced at USD 4750, USD 5250, and USD 8750 respectively.
10. Is the market size provided in terms of value or volume?
The market size is provided in terms of value, measured in Million.
11. Are there any specific market keywords associated with the report?
Yes, the market keyword associated with the report is "3D Medical and Surgical Imaging Platform Industry," which aids in identifying and referencing the specific market segment covered.
12. How do I determine which pricing option suits my needs best?
The pricing options vary based on user requirements and access needs. Individual users may opt for single-user licenses, while businesses requiring broader access may choose multi-user or enterprise licenses for cost-effective access to the report.
13. Are there any additional resources or data provided in the 3D Medical and Surgical Imaging Platform Industry report?
While the report offers comprehensive insights, it's advisable to review the specific contents or supplementary materials provided to ascertain if additional resources or data are available.
14. How can I stay updated on further developments or reports in the 3D Medical and Surgical Imaging Platform Industry?
To stay informed about further developments, trends, and reports in the 3D Medical and Surgical Imaging Platform Industry, consider subscribing to industry newsletters, following relevant companies and organizations, or regularly checking reputable industry news sources and publications.
Methodology
Step 1 - Identification of Relevant Samples Size from Population Database


Step 2 - Approaches for Defining Global Market Size (Value, Volume* & Price*)

Note*: In applicable scenarios
Step 3 - Data Sources
Primary Research
- Web Analytics
- Survey Reports
- Research Institute
- Latest Research Reports
- Opinion Leaders
Secondary Research
- Annual Reports
- White Paper
- Latest Press Release
- Industry Association
- Paid Database
- Investor Presentations

Step 4 - Data Triangulation
Involves using different sources of information in order to increase the validity of a study
These sources are likely to be stakeholders in a program - participants, other researchers, program staff, other community members, and so on.
Then we put all data in single framework & apply various statistical tools to find out the dynamic on the market.
During the analysis stage, feedback from the stakeholder groups would be compared to determine areas of agreement as well as areas of divergence


