
Key Insights
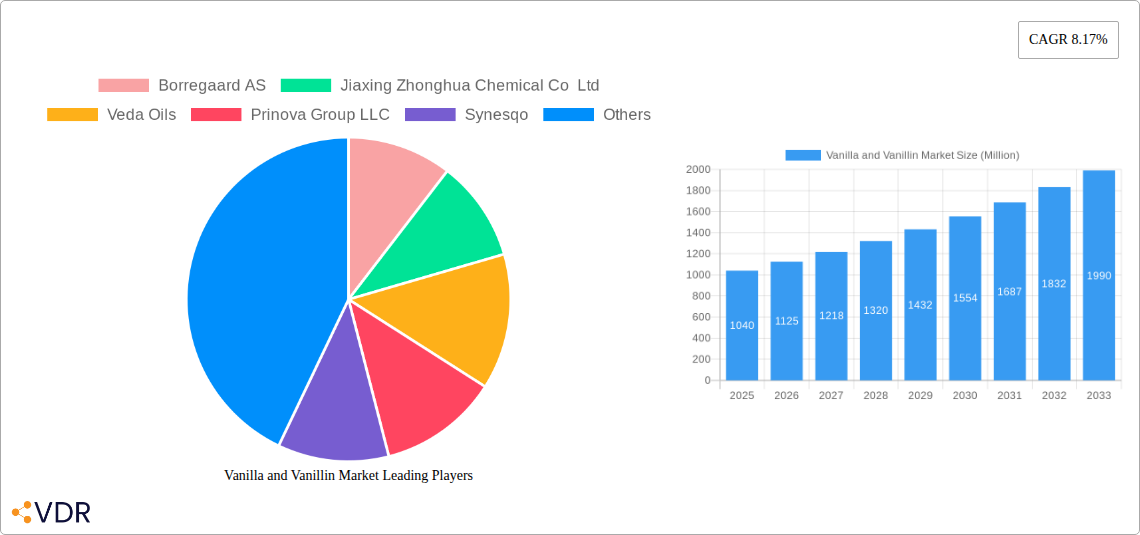
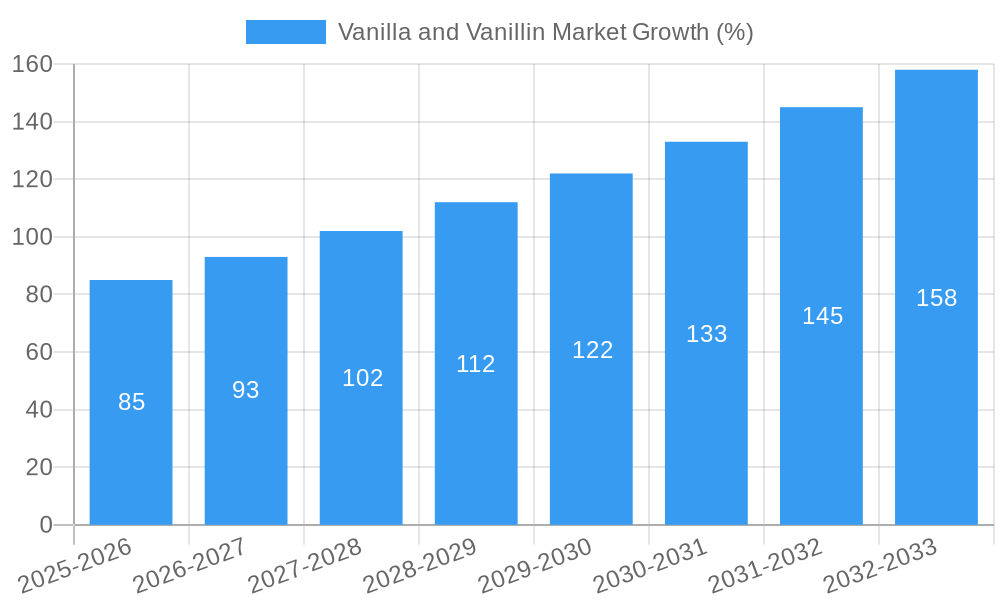
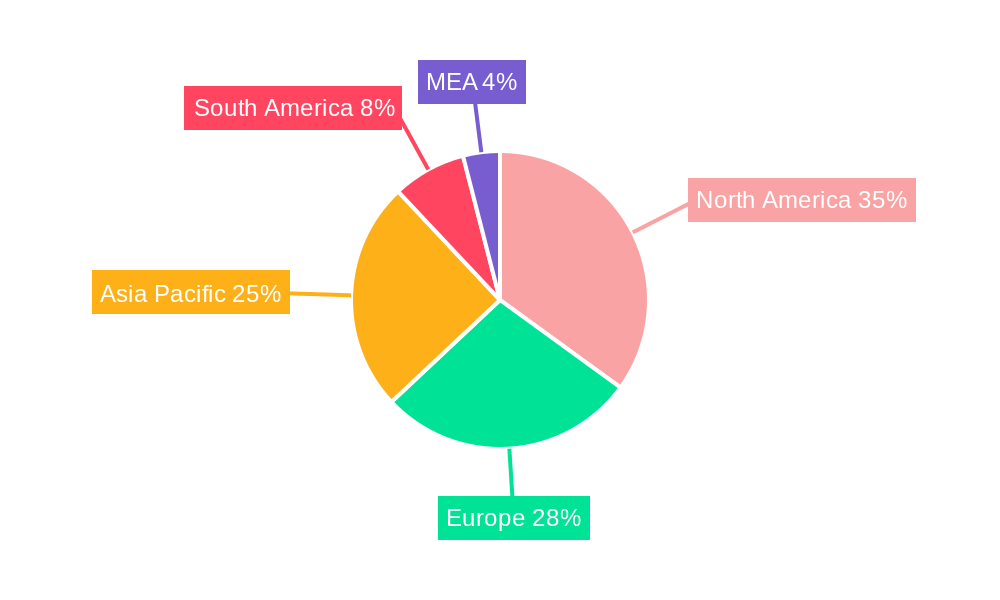
The global vanilla and vanillin market, valued at $1.04 billion in 2025, is projected to experience robust growth, driven by a compound annual growth rate (CAGR) of 8.17% from 2025 to 2033. This expansion is fueled by several key factors. The rising demand for natural and artificial flavors in the food and beverage industry is a primary driver, particularly in confectionery, baked goods, and beverages. Growing consumer preference for premium and naturally derived ingredients is further bolstering the market for natural vanillin. The pharmaceutical and fragrance industries also contribute significantly to market demand, with vanillin used as a flavoring agent and in the creation of various fragrances. Expanding applications in personal care products and cosmetics represent emerging opportunities for market growth. However, the market faces challenges including price volatility in natural vanilla bean prices due to factors like weather patterns and crop yields. Additionally, the increasing use of synthetic vanillin presents competition for natural vanillin, necessitating manufacturers to focus on promoting the superior quality and unique flavor profile of natural options. Regional variations in growth are anticipated, with Asia-Pacific and North America expected to dominate the market due to their large food and beverage industries and high disposable incomes.
The segmentation of the market by type (natural vanillin and synthetic vanillin) and application (food and beverage, pharmaceuticals, fragrances, and other applications) reveals significant nuances in growth trajectories. The natural vanillin segment, although pricier, is likely to witness comparatively higher growth due to the increasing consumer preference for clean-label and natural products. Within applications, the food and beverage sector will continue to be the dominant segment, while the pharmaceutical and fragrance sectors are expected to exhibit steady, albeit potentially slower, growth. Competitive analysis reveals key players such as Borregaard AS, Jiaxing Zhonghua Chemical Co Ltd, and others focusing on strategic initiatives such as product innovation, expansion of distribution networks, and mergers and acquisitions to strengthen their market positions. The forecast period (2025-2033) will be shaped by these dynamic interplay of factors, resulting in a continuously evolving market landscape.
Vanilla and Vanillin Market: A Comprehensive Market Report (2019-2033)
This comprehensive report provides an in-depth analysis of the Vanilla and Vanillin market, encompassing market dynamics, growth trends, regional insights, product landscape, and key players. With a study period spanning 2019-2033, a base year of 2025, and a forecast period of 2025-2033, this report offers invaluable insights for industry professionals, investors, and stakeholders seeking to navigate this dynamic market. The report also segments the market by Type (Natural Vanillin, Synthetic Vanillin) and Application (Food and Beverage, Pharmaceuticals, Fragrances, Other Applications). The total market size is projected to reach xx Million by 2033.
Vanilla and Vanillin Market Market Dynamics & Structure
The vanilla and vanillin market is characterized by a moderate level of concentration, with several key players holding significant market share. Technological innovation, particularly in synthetic vanillin production, plays a crucial role in shaping market dynamics. Stringent regulatory frameworks concerning food safety and labeling influence product development and market access. Natural vanillin faces challenges from its higher cost and limited supply compared to synthetic alternatives. The market witnesses continuous M&A activity, driven by the desire for scale and diversification.
- Market Concentration: The top 5 players account for approximately xx% of the global market share in 2025.
- Technological Innovation: Advancements in bio-based synthetic vanillin production are driving cost reduction and sustainability efforts.
- Regulatory Landscape: Stringent food safety regulations in key markets necessitate compliance and impact production costs.
- Competitive Substitutes: Other flavoring agents pose competitive pressure, particularly in certain applications.
- M&A Activity: The past 5 years have seen xx M&A deals in the vanilla and vanillin sector, signaling consolidation.
- Innovation Barriers: High R&D investment and complexities in scaling sustainable production methods pose challenges for new entrants.
Vanilla and Vanillin Market Growth Trends & Insights
The vanilla and vanillin market exhibits a robust growth trajectory, driven by increasing demand from the food and beverage, pharmaceutical, and fragrance industries. The market experienced a CAGR of xx% during the historical period (2019-2024) and is projected to maintain a CAGR of xx% during the forecast period (2025-2033). This growth is fueled by factors such as rising consumer preference for natural flavors, expanding applications in functional foods and nutraceuticals, and the increasing adoption of vanillin in various personal care products. The market penetration of synthetic vanillin remains high, but natural vanillin is witnessing increased adoption due to consumer preference shifts. Technological disruptions in production methods and supply chain optimization efforts are also contributing to market expansion. Consumer behavior increasingly emphasizes sustainability and authenticity, which positively affects the demand for natural vanillin. The market size is estimated at xx Million in 2025 and is projected to reach xx Million by 2033.
Dominant Regions, Countries, or Segments in Vanilla and Vanillin Market
North America and Europe currently dominate the vanilla and vanillin market, driven by high consumption in food and beverage applications and a well-established fragrance industry. However, the Asia-Pacific region is emerging as a high-growth market, driven by rising disposable incomes and increasing demand from developing economies. Within the product segments, synthetic vanillin commands a larger market share due to cost advantages, but natural vanillin is gaining traction.
- Dominant Region: North America holds the largest market share (xx%), driven by strong demand and established supply chains.
- High-Growth Region: Asia-Pacific is projected to witness the fastest growth rate (xx% CAGR) due to rising demand and increasing production capacity.
- Dominant Application: The Food and Beverage sector is the largest consumer of vanilla and vanillin (xx% market share), followed by Fragrances.
- Dominant Type: Synthetic vanillin dominates due to cost-effectiveness (xx% market share), but natural vanillin is showing significant growth in niche segments.
Vanilla and Vanillin Market Product Landscape
The vanilla and vanillin market showcases diverse product offerings, ranging from pure vanillin crystals to vanillin-based flavor blends and extracts. Innovations focus on enhancing flavor profiles, improving stability, and developing sustainable production methods. Product differentiation is achieved through offering natural, organic, and ethically sourced vanillin options. Performance metrics center around purity, flavor intensity, and cost-effectiveness. Unique selling propositions often highlight the origin, processing methods, and sustainability credentials of the products.
Key Drivers, Barriers & Challenges in Vanilla and Vanillin Market
Key Drivers: Increasing demand from the food and beverage industry, growing popularity of natural flavors, and technological advancements in synthetic vanillin production are driving the market. Government incentives for sustainable production methods and favorable economic conditions also play a significant role.
Challenges: Fluctuations in vanilla bean prices, stringent regulatory requirements, and competition from synthetic alternatives pose challenges. Supply chain disruptions and quality control issues can also impact market growth. The impact of these challenges on market growth is estimated at xx% reduction in overall growth projections.
Emerging Opportunities in Vanilla and Vanillin Market
Emerging opportunities lie in the expansion into untapped markets (e.g., developing economies in Africa and South America), the development of novel applications (e.g., in cosmetics and pharmaceuticals), and a rising demand for personalized flavor solutions. The increasing consumer interest in plant-based and functional food products also presents a significant growth avenue.
Growth Accelerators in the Vanilla and Vanillin Market Industry
Technological breakthroughs in fermentation and bio-based vanillin production, strategic partnerships between flavor manufacturers and food companies, and expansion into new geographical markets are key growth accelerators. The development of sustainable and cost-effective production methods further enhances the long-term growth outlook for the market.
Key Players Shaping the Vanilla and Vanillin Market Market
- Borregaard AS
- Jiaxing Zhonghua Chemical Co Ltd
- Veda Oils
- Prinova Group LLC
- Synesqo
- Merck KGaA
- FoodChem International Corporation
- Evolva Holding SA
- Camlin Fine Sciences Ltd
- Lesaffre Et Compagnie
Notable Milestones in Vanilla and Vanillin Market Sector
- July 2023: Camlin Fine Sciences Ltd. (CFS) launched its premium vanillin product—adorr in North America, expanding its product portfolio and market presence.
- June 2023: Solvay's spin-off of Synesqo, focusing on specialty chemicals, signifies a strategic shift and potential increased focus on vanillin-related innovations.
- June 2023: Merck's capacity expansion for high-purity reagents in China enhances the availability of testing materials for biopharma applications, indirectly boosting the demand for high-quality vanillin.
In-Depth Vanilla and Vanillin Market Market Outlook
The vanilla and vanillin market is poised for continued growth, driven by ongoing innovation, expanding applications, and increasing consumer demand. Strategic partnerships, investments in sustainable production methods, and market penetration into emerging economies will be key factors shaping the future market landscape. The potential for significant growth remains high, with opportunities for both established players and new entrants to capitalize on evolving market trends.
Vanilla and Vanillin Market Segmentation
-
1. Type
- 1.1. Natural Vanillin
- 1.2. Synthetic Vanillin
-
2. Application
- 2.1. Food and Beverage
- 2.2. Pharmaceuticals
- 2.3. Fragrances
- 2.4. Other Applications
Vanilla and Vanillin Market Segmentation By Geography
-
1. North America
- 1.1. United States
- 1.2. Canada
- 1.3. Mexico
- 1.4. Rest of North America
-
2. Europe
- 2.1. Germany
- 2.2. United Kingdom
- 2.3. France
- 2.4. Russia
- 2.5. Spain
- 2.6. Italy
- 2.7. Rest of Europe
-
3. Asia Pacific
- 3.1. China
- 3.2. India
- 3.3. Australia
- 3.4. Japan
- 3.5. Rest of Asia Pacific
- 4. Rest of the World
Vanilla and Vanillin Market REPORT HIGHLIGHTS
| Aspects | Details |
|---|---|
| Study Period | 2019-2033 |
| Base Year | 2024 |
| Estimated Year | 2025 |
| Forecast Period | 2025-2033 |
| Historical Period | 2019-2024 |
| Growth Rate | CAGR of 8.17% from 2019-2033 |
| Segmentation |
|
Table of Contents
- 1. Introduction
- 1.1. Research Scope
- 1.2. Market Segmentation
- 1.3. Research Methodology
- 1.4. Definitions and Assumptions
- 2. Executive Summary
- 2.1. Introduction
- 3. Market Dynamics
- 3.1. Introduction
- 3.2. Market Drivers
- 3.2.1. Innovation in Vanillin Synthesis; Diverse Functionality of Vanillin In End-use Industries
- 3.3. Market Restrains
- 3.3.1. Supply Chain Variability Impacting Vanilla Bean Availability For Flavor Production
- 3.4. Market Trends
- 3.4.1. Diverse Functionality of Vanillin in End-use Industries
- 4. Market Factor Analysis
- 4.1. Porters Five Forces
- 4.2. Supply/Value Chain
- 4.3. PESTEL analysis
- 4.4. Market Entropy
- 4.5. Patent/Trademark Analysis
- 5. Global Vanilla and Vanillin Market Analysis, Insights and Forecast, 2019-2031
- 5.1. Market Analysis, Insights and Forecast - by Type
- 5.1.1. Natural Vanillin
- 5.1.2. Synthetic Vanillin
- 5.2. Market Analysis, Insights and Forecast - by Application
- 5.2.1. Food and Beverage
- 5.2.2. Pharmaceuticals
- 5.2.3. Fragrances
- 5.2.4. Other Applications
- 5.3. Market Analysis, Insights and Forecast - by Region
- 5.3.1. North America
- 5.3.2. Europe
- 5.3.3. Asia Pacific
- 5.3.4. Rest of the World
- 5.1. Market Analysis, Insights and Forecast - by Type
- 6. North America Vanilla and Vanillin Market Analysis, Insights and Forecast, 2019-2031
- 6.1. Market Analysis, Insights and Forecast - by Type
- 6.1.1. Natural Vanillin
- 6.1.2. Synthetic Vanillin
- 6.2. Market Analysis, Insights and Forecast - by Application
- 6.2.1. Food and Beverage
- 6.2.2. Pharmaceuticals
- 6.2.3. Fragrances
- 6.2.4. Other Applications
- 6.1. Market Analysis, Insights and Forecast - by Type
- 7. Europe Vanilla and Vanillin Market Analysis, Insights and Forecast, 2019-2031
- 7.1. Market Analysis, Insights and Forecast - by Type
- 7.1.1. Natural Vanillin
- 7.1.2. Synthetic Vanillin
- 7.2. Market Analysis, Insights and Forecast - by Application
- 7.2.1. Food and Beverage
- 7.2.2. Pharmaceuticals
- 7.2.3. Fragrances
- 7.2.4. Other Applications
- 7.1. Market Analysis, Insights and Forecast - by Type
- 8. Asia Pacific Vanilla and Vanillin Market Analysis, Insights and Forecast, 2019-2031
- 8.1. Market Analysis, Insights and Forecast - by Type
- 8.1.1. Natural Vanillin
- 8.1.2. Synthetic Vanillin
- 8.2. Market Analysis, Insights and Forecast - by Application
- 8.2.1. Food and Beverage
- 8.2.2. Pharmaceuticals
- 8.2.3. Fragrances
- 8.2.4. Other Applications
- 8.1. Market Analysis, Insights and Forecast - by Type
- 9. Rest of the World Vanilla and Vanillin Market Analysis, Insights and Forecast, 2019-2031
- 9.1. Market Analysis, Insights and Forecast - by Type
- 9.1.1. Natural Vanillin
- 9.1.2. Synthetic Vanillin
- 9.2. Market Analysis, Insights and Forecast - by Application
- 9.2.1. Food and Beverage
- 9.2.2. Pharmaceuticals
- 9.2.3. Fragrances
- 9.2.4. Other Applications
- 9.1. Market Analysis, Insights and Forecast - by Type
- 10. North America Vanilla and Vanillin Market Analysis, Insights and Forecast, 2019-2031
- 10.1. Market Analysis, Insights and Forecast - By Country/Sub-region
- 10.1.1 United States
- 10.1.2 Canada
- 10.1.3 Mexico
- 11. Europe Vanilla and Vanillin Market Analysis, Insights and Forecast, 2019-2031
- 11.1. Market Analysis, Insights and Forecast - By Country/Sub-region
- 11.1.1 Germany
- 11.1.2 United Kingdom
- 11.1.3 France
- 11.1.4 Spain
- 11.1.5 Italy
- 11.1.6 Spain
- 11.1.7 Belgium
- 11.1.8 Netherland
- 11.1.9 Nordics
- 11.1.10 Rest of Europe
- 12. Asia Pacific Vanilla and Vanillin Market Analysis, Insights and Forecast, 2019-2031
- 12.1. Market Analysis, Insights and Forecast - By Country/Sub-region
- 12.1.1 China
- 12.1.2 Japan
- 12.1.3 India
- 12.1.4 South Korea
- 12.1.5 Southeast Asia
- 12.1.6 Australia
- 12.1.7 Indonesia
- 12.1.8 Phillipes
- 12.1.9 Singapore
- 12.1.10 Thailandc
- 12.1.11 Rest of Asia Pacific
- 13. South America Vanilla and Vanillin Market Analysis, Insights and Forecast, 2019-2031
- 13.1. Market Analysis, Insights and Forecast - By Country/Sub-region
- 13.1.1 Brazil
- 13.1.2 Argentina
- 13.1.3 Peru
- 13.1.4 Chile
- 13.1.5 Colombia
- 13.1.6 Ecuador
- 13.1.7 Venezuela
- 13.1.8 Rest of South America
- 14. MEA Vanilla and Vanillin Market Analysis, Insights and Forecast, 2019-2031
- 14.1. Market Analysis, Insights and Forecast - By Country/Sub-region
- 14.1.1 United Arab Emirates
- 14.1.2 Saudi Arabia
- 14.1.3 South Africa
- 14.1.4 Rest of Middle East and Africa
- 15. Competitive Analysis
- 15.1. Global Market Share Analysis 2024
- 15.2. Company Profiles
- 15.2.1 Borregaard AS
- 15.2.1.1. Overview
- 15.2.1.2. Products
- 15.2.1.3. SWOT Analysis
- 15.2.1.4. Recent Developments
- 15.2.1.5. Financials (Based on Availability)
- 15.2.2 Jiaxing Zhonghua Chemical Co Ltd
- 15.2.2.1. Overview
- 15.2.2.2. Products
- 15.2.2.3. SWOT Analysis
- 15.2.2.4. Recent Developments
- 15.2.2.5. Financials (Based on Availability)
- 15.2.3 Veda Oils
- 15.2.3.1. Overview
- 15.2.3.2. Products
- 15.2.3.3. SWOT Analysis
- 15.2.3.4. Recent Developments
- 15.2.3.5. Financials (Based on Availability)
- 15.2.4 Prinova Group LLC
- 15.2.4.1. Overview
- 15.2.4.2. Products
- 15.2.4.3. SWOT Analysis
- 15.2.4.4. Recent Developments
- 15.2.4.5. Financials (Based on Availability)
- 15.2.5 Synesqo
- 15.2.5.1. Overview
- 15.2.5.2. Products
- 15.2.5.3. SWOT Analysis
- 15.2.5.4. Recent Developments
- 15.2.5.5. Financials (Based on Availability)
- 15.2.6 Merck KGaA
- 15.2.6.1. Overview
- 15.2.6.2. Products
- 15.2.6.3. SWOT Analysis
- 15.2.6.4. Recent Developments
- 15.2.6.5. Financials (Based on Availability)
- 15.2.7 FoodChem International Corporation
- 15.2.7.1. Overview
- 15.2.7.2. Products
- 15.2.7.3. SWOT Analysis
- 15.2.7.4. Recent Developments
- 15.2.7.5. Financials (Based on Availability)
- 15.2.8 Evolva Holding SA
- 15.2.8.1. Overview
- 15.2.8.2. Products
- 15.2.8.3. SWOT Analysis
- 15.2.8.4. Recent Developments
- 15.2.8.5. Financials (Based on Availability)
- 15.2.9 Camlin Fine Sciences Ltd
- 15.2.9.1. Overview
- 15.2.9.2. Products
- 15.2.9.3. SWOT Analysis
- 15.2.9.4. Recent Developments
- 15.2.9.5. Financials (Based on Availability)
- 15.2.10 Lesaffre Et Compagnie
- 15.2.10.1. Overview
- 15.2.10.2. Products
- 15.2.10.3. SWOT Analysis
- 15.2.10.4. Recent Developments
- 15.2.10.5. Financials (Based on Availability)
- 15.2.1 Borregaard AS
List of Figures
- Figure 1: Global Vanilla and Vanillin Market Revenue Breakdown (Million, %) by Region 2024 & 2032
- Figure 2: North America Vanilla and Vanillin Market Revenue (Million), by Country 2024 & 2032
- Figure 3: North America Vanilla and Vanillin Market Revenue Share (%), by Country 2024 & 2032
- Figure 4: Europe Vanilla and Vanillin Market Revenue (Million), by Country 2024 & 2032
- Figure 5: Europe Vanilla and Vanillin Market Revenue Share (%), by Country 2024 & 2032
- Figure 6: Asia Pacific Vanilla and Vanillin Market Revenue (Million), by Country 2024 & 2032
- Figure 7: Asia Pacific Vanilla and Vanillin Market Revenue Share (%), by Country 2024 & 2032
- Figure 8: South America Vanilla and Vanillin Market Revenue (Million), by Country 2024 & 2032
- Figure 9: South America Vanilla and Vanillin Market Revenue Share (%), by Country 2024 & 2032
- Figure 10: MEA Vanilla and Vanillin Market Revenue (Million), by Country 2024 & 2032
- Figure 11: MEA Vanilla and Vanillin Market Revenue Share (%), by Country 2024 & 2032
- Figure 12: North America Vanilla and Vanillin Market Revenue (Million), by Type 2024 & 2032
- Figure 13: North America Vanilla and Vanillin Market Revenue Share (%), by Type 2024 & 2032
- Figure 14: North America Vanilla and Vanillin Market Revenue (Million), by Application 2024 & 2032
- Figure 15: North America Vanilla and Vanillin Market Revenue Share (%), by Application 2024 & 2032
- Figure 16: North America Vanilla and Vanillin Market Revenue (Million), by Country 2024 & 2032
- Figure 17: North America Vanilla and Vanillin Market Revenue Share (%), by Country 2024 & 2032
- Figure 18: Europe Vanilla and Vanillin Market Revenue (Million), by Type 2024 & 2032
- Figure 19: Europe Vanilla and Vanillin Market Revenue Share (%), by Type 2024 & 2032
- Figure 20: Europe Vanilla and Vanillin Market Revenue (Million), by Application 2024 & 2032
- Figure 21: Europe Vanilla and Vanillin Market Revenue Share (%), by Application 2024 & 2032
- Figure 22: Europe Vanilla and Vanillin Market Revenue (Million), by Country 2024 & 2032
- Figure 23: Europe Vanilla and Vanillin Market Revenue Share (%), by Country 2024 & 2032
- Figure 24: Asia Pacific Vanilla and Vanillin Market Revenue (Million), by Type 2024 & 2032
- Figure 25: Asia Pacific Vanilla and Vanillin Market Revenue Share (%), by Type 2024 & 2032
- Figure 26: Asia Pacific Vanilla and Vanillin Market Revenue (Million), by Application 2024 & 2032
- Figure 27: Asia Pacific Vanilla and Vanillin Market Revenue Share (%), by Application 2024 & 2032
- Figure 28: Asia Pacific Vanilla and Vanillin Market Revenue (Million), by Country 2024 & 2032
- Figure 29: Asia Pacific Vanilla and Vanillin Market Revenue Share (%), by Country 2024 & 2032
- Figure 30: Rest of the World Vanilla and Vanillin Market Revenue (Million), by Type 2024 & 2032
- Figure 31: Rest of the World Vanilla and Vanillin Market Revenue Share (%), by Type 2024 & 2032
- Figure 32: Rest of the World Vanilla and Vanillin Market Revenue (Million), by Application 2024 & 2032
- Figure 33: Rest of the World Vanilla and Vanillin Market Revenue Share (%), by Application 2024 & 2032
- Figure 34: Rest of the World Vanilla and Vanillin Market Revenue (Million), by Country 2024 & 2032
- Figure 35: Rest of the World Vanilla and Vanillin Market Revenue Share (%), by Country 2024 & 2032
List of Tables
- Table 1: Global Vanilla and Vanillin Market Revenue Million Forecast, by Region 2019 & 2032
- Table 2: Global Vanilla and Vanillin Market Revenue Million Forecast, by Type 2019 & 2032
- Table 3: Global Vanilla and Vanillin Market Revenue Million Forecast, by Application 2019 & 2032
- Table 4: Global Vanilla and Vanillin Market Revenue Million Forecast, by Region 2019 & 2032
- Table 5: Global Vanilla and Vanillin Market Revenue Million Forecast, by Country 2019 & 2032
- Table 6: United States Vanilla and Vanillin Market Revenue (Million) Forecast, by Application 2019 & 2032
- Table 7: Canada Vanilla and Vanillin Market Revenue (Million) Forecast, by Application 2019 & 2032
- Table 8: Mexico Vanilla and Vanillin Market Revenue (Million) Forecast, by Application 2019 & 2032
- Table 9: Global Vanilla and Vanillin Market Revenue Million Forecast, by Country 2019 & 2032
- Table 10: Germany Vanilla and Vanillin Market Revenue (Million) Forecast, by Application 2019 & 2032
- Table 11: United Kingdom Vanilla and Vanillin Market Revenue (Million) Forecast, by Application 2019 & 2032
- Table 12: France Vanilla and Vanillin Market Revenue (Million) Forecast, by Application 2019 & 2032
- Table 13: Spain Vanilla and Vanillin Market Revenue (Million) Forecast, by Application 2019 & 2032
- Table 14: Italy Vanilla and Vanillin Market Revenue (Million) Forecast, by Application 2019 & 2032
- Table 15: Spain Vanilla and Vanillin Market Revenue (Million) Forecast, by Application 2019 & 2032
- Table 16: Belgium Vanilla and Vanillin Market Revenue (Million) Forecast, by Application 2019 & 2032
- Table 17: Netherland Vanilla and Vanillin Market Revenue (Million) Forecast, by Application 2019 & 2032
- Table 18: Nordics Vanilla and Vanillin Market Revenue (Million) Forecast, by Application 2019 & 2032
- Table 19: Rest of Europe Vanilla and Vanillin Market Revenue (Million) Forecast, by Application 2019 & 2032
- Table 20: Global Vanilla and Vanillin Market Revenue Million Forecast, by Country 2019 & 2032
- Table 21: China Vanilla and Vanillin Market Revenue (Million) Forecast, by Application 2019 & 2032
- Table 22: Japan Vanilla and Vanillin Market Revenue (Million) Forecast, by Application 2019 & 2032
- Table 23: India Vanilla and Vanillin Market Revenue (Million) Forecast, by Application 2019 & 2032
- Table 24: South Korea Vanilla and Vanillin Market Revenue (Million) Forecast, by Application 2019 & 2032
- Table 25: Southeast Asia Vanilla and Vanillin Market Revenue (Million) Forecast, by Application 2019 & 2032
- Table 26: Australia Vanilla and Vanillin Market Revenue (Million) Forecast, by Application 2019 & 2032
- Table 27: Indonesia Vanilla and Vanillin Market Revenue (Million) Forecast, by Application 2019 & 2032
- Table 28: Phillipes Vanilla and Vanillin Market Revenue (Million) Forecast, by Application 2019 & 2032
- Table 29: Singapore Vanilla and Vanillin Market Revenue (Million) Forecast, by Application 2019 & 2032
- Table 30: Thailandc Vanilla and Vanillin Market Revenue (Million) Forecast, by Application 2019 & 2032
- Table 31: Rest of Asia Pacific Vanilla and Vanillin Market Revenue (Million) Forecast, by Application 2019 & 2032
- Table 32: Global Vanilla and Vanillin Market Revenue Million Forecast, by Country 2019 & 2032
- Table 33: Brazil Vanilla and Vanillin Market Revenue (Million) Forecast, by Application 2019 & 2032
- Table 34: Argentina Vanilla and Vanillin Market Revenue (Million) Forecast, by Application 2019 & 2032
- Table 35: Peru Vanilla and Vanillin Market Revenue (Million) Forecast, by Application 2019 & 2032
- Table 36: Chile Vanilla and Vanillin Market Revenue (Million) Forecast, by Application 2019 & 2032
- Table 37: Colombia Vanilla and Vanillin Market Revenue (Million) Forecast, by Application 2019 & 2032
- Table 38: Ecuador Vanilla and Vanillin Market Revenue (Million) Forecast, by Application 2019 & 2032
- Table 39: Venezuela Vanilla and Vanillin Market Revenue (Million) Forecast, by Application 2019 & 2032
- Table 40: Rest of South America Vanilla and Vanillin Market Revenue (Million) Forecast, by Application 2019 & 2032
- Table 41: Global Vanilla and Vanillin Market Revenue Million Forecast, by Country 2019 & 2032
- Table 42: United Arab Emirates Vanilla and Vanillin Market Revenue (Million) Forecast, by Application 2019 & 2032
- Table 43: Saudi Arabia Vanilla and Vanillin Market Revenue (Million) Forecast, by Application 2019 & 2032
- Table 44: South Africa Vanilla and Vanillin Market Revenue (Million) Forecast, by Application 2019 & 2032
- Table 45: Rest of Middle East and Africa Vanilla and Vanillin Market Revenue (Million) Forecast, by Application 2019 & 2032
- Table 46: Global Vanilla and Vanillin Market Revenue Million Forecast, by Type 2019 & 2032
- Table 47: Global Vanilla and Vanillin Market Revenue Million Forecast, by Application 2019 & 2032
- Table 48: Global Vanilla and Vanillin Market Revenue Million Forecast, by Country 2019 & 2032
- Table 49: United States Vanilla and Vanillin Market Revenue (Million) Forecast, by Application 2019 & 2032
- Table 50: Canada Vanilla and Vanillin Market Revenue (Million) Forecast, by Application 2019 & 2032
- Table 51: Mexico Vanilla and Vanillin Market Revenue (Million) Forecast, by Application 2019 & 2032
- Table 52: Rest of North America Vanilla and Vanillin Market Revenue (Million) Forecast, by Application 2019 & 2032
- Table 53: Global Vanilla and Vanillin Market Revenue Million Forecast, by Type 2019 & 2032
- Table 54: Global Vanilla and Vanillin Market Revenue Million Forecast, by Application 2019 & 2032
- Table 55: Global Vanilla and Vanillin Market Revenue Million Forecast, by Country 2019 & 2032
- Table 56: Germany Vanilla and Vanillin Market Revenue (Million) Forecast, by Application 2019 & 2032
- Table 57: United Kingdom Vanilla and Vanillin Market Revenue (Million) Forecast, by Application 2019 & 2032
- Table 58: France Vanilla and Vanillin Market Revenue (Million) Forecast, by Application 2019 & 2032
- Table 59: Russia Vanilla and Vanillin Market Revenue (Million) Forecast, by Application 2019 & 2032
- Table 60: Spain Vanilla and Vanillin Market Revenue (Million) Forecast, by Application 2019 & 2032
- Table 61: Italy Vanilla and Vanillin Market Revenue (Million) Forecast, by Application 2019 & 2032
- Table 62: Rest of Europe Vanilla and Vanillin Market Revenue (Million) Forecast, by Application 2019 & 2032
- Table 63: Global Vanilla and Vanillin Market Revenue Million Forecast, by Type 2019 & 2032
- Table 64: Global Vanilla and Vanillin Market Revenue Million Forecast, by Application 2019 & 2032
- Table 65: Global Vanilla and Vanillin Market Revenue Million Forecast, by Country 2019 & 2032
- Table 66: China Vanilla and Vanillin Market Revenue (Million) Forecast, by Application 2019 & 2032
- Table 67: India Vanilla and Vanillin Market Revenue (Million) Forecast, by Application 2019 & 2032
- Table 68: Australia Vanilla and Vanillin Market Revenue (Million) Forecast, by Application 2019 & 2032
- Table 69: Japan Vanilla and Vanillin Market Revenue (Million) Forecast, by Application 2019 & 2032
- Table 70: Rest of Asia Pacific Vanilla and Vanillin Market Revenue (Million) Forecast, by Application 2019 & 2032
- Table 71: Global Vanilla and Vanillin Market Revenue Million Forecast, by Type 2019 & 2032
- Table 72: Global Vanilla and Vanillin Market Revenue Million Forecast, by Application 2019 & 2032
- Table 73: Global Vanilla and Vanillin Market Revenue Million Forecast, by Country 2019 & 2032
Frequently Asked Questions
1. What is the projected Compound Annual Growth Rate (CAGR) of the Vanilla and Vanillin Market?
The projected CAGR is approximately 8.17%.
2. Which companies are prominent players in the Vanilla and Vanillin Market?
Key companies in the market include Borregaard AS, Jiaxing Zhonghua Chemical Co Ltd, Veda Oils, Prinova Group LLC, Synesqo, Merck KGaA, FoodChem International Corporation, Evolva Holding SA, Camlin Fine Sciences Ltd, Lesaffre Et Compagnie.
3. What are the main segments of the Vanilla and Vanillin Market?
The market segments include Type, Application.
4. Can you provide details about the market size?
The market size is estimated to be USD 1.04 Million as of 2022.
5. What are some drivers contributing to market growth?
Innovation in Vanillin Synthesis; Diverse Functionality of Vanillin In End-use Industries.
6. What are the notable trends driving market growth?
Diverse Functionality of Vanillin in End-use Industries.
7. Are there any restraints impacting market growth?
Supply Chain Variability Impacting Vanilla Bean Availability For Flavor Production.
8. Can you provide examples of recent developments in the market?
July 2023: Camlin Fine Sciences Ltd. (CFS) launched its vanillin premium product—adorr in North America.
9. What pricing options are available for accessing the report?
Pricing options include single-user, multi-user, and enterprise licenses priced at USD 4750, USD 5250, and USD 8750 respectively.
10. Is the market size provided in terms of value or volume?
The market size is provided in terms of value, measured in Million.
11. Are there any specific market keywords associated with the report?
Yes, the market keyword associated with the report is "Vanilla and Vanillin Market," which aids in identifying and referencing the specific market segment covered.
12. How do I determine which pricing option suits my needs best?
The pricing options vary based on user requirements and access needs. Individual users may opt for single-user licenses, while businesses requiring broader access may choose multi-user or enterprise licenses for cost-effective access to the report.
13. Are there any additional resources or data provided in the Vanilla and Vanillin Market report?
While the report offers comprehensive insights, it's advisable to review the specific contents or supplementary materials provided to ascertain if additional resources or data are available.
14. How can I stay updated on further developments or reports in the Vanilla and Vanillin Market?
To stay informed about further developments, trends, and reports in the Vanilla and Vanillin Market, consider subscribing to industry newsletters, following relevant companies and organizations, or regularly checking reputable industry news sources and publications.
Methodology
Step 1 - Identification of Relevant Samples Size from Population Database


Step 2 - Approaches for Defining Global Market Size (Value, Volume* & Price*)

Note*: In applicable scenarios
Step 3 - Data Sources
Primary Research
- Web Analytics
- Survey Reports
- Research Institute
- Latest Research Reports
- Opinion Leaders
Secondary Research
- Annual Reports
- White Paper
- Latest Press Release
- Industry Association
- Paid Database
- Investor Presentations

Step 4 - Data Triangulation
Involves using different sources of information in order to increase the validity of a study
These sources are likely to be stakeholders in a program - participants, other researchers, program staff, other community members, and so on.
Then we put all data in single framework & apply various statistical tools to find out the dynamic on the market.
During the analysis stage, feedback from the stakeholder groups would be compared to determine areas of agreement as well as areas of divergence


