

Key Insights
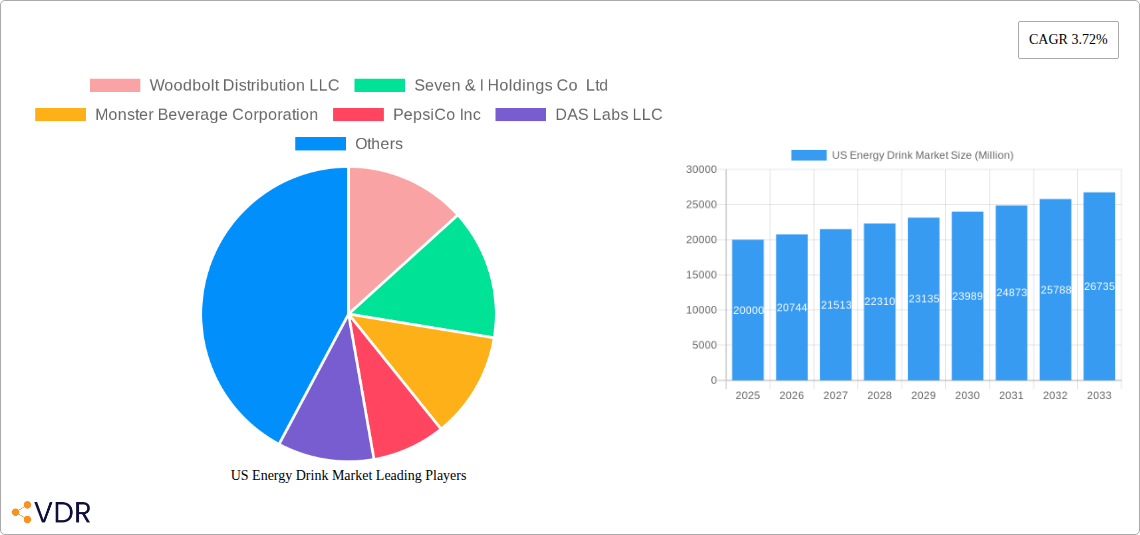
The US energy drink market is poised for substantial growth from 2025 to 2033. With an estimated market size of $50.33 billion in the base year 2025 and a projected CAGR of 2.33%, this dynamic sector is driven by evolving consumer preferences, including a demand for low-sugar and natural alternatives. The rising popularity of energy shots and sustained demand from younger demographics further fuel expansion. Key market segments include packaging (glass bottles, metal cans, PET bottles), distribution channels (off-trade, on-trade), and product types such as energy shots, natural/organic, sugar-free/low-calorie, and traditional energy drinks. Major players like Red Bull, Monster Beverage, PepsiCo, and Coca-Cola, alongside niche brands, are actively competing in this landscape. The trend towards functional beverages fortified with vitamins and antioxidants also contributes to market growth.
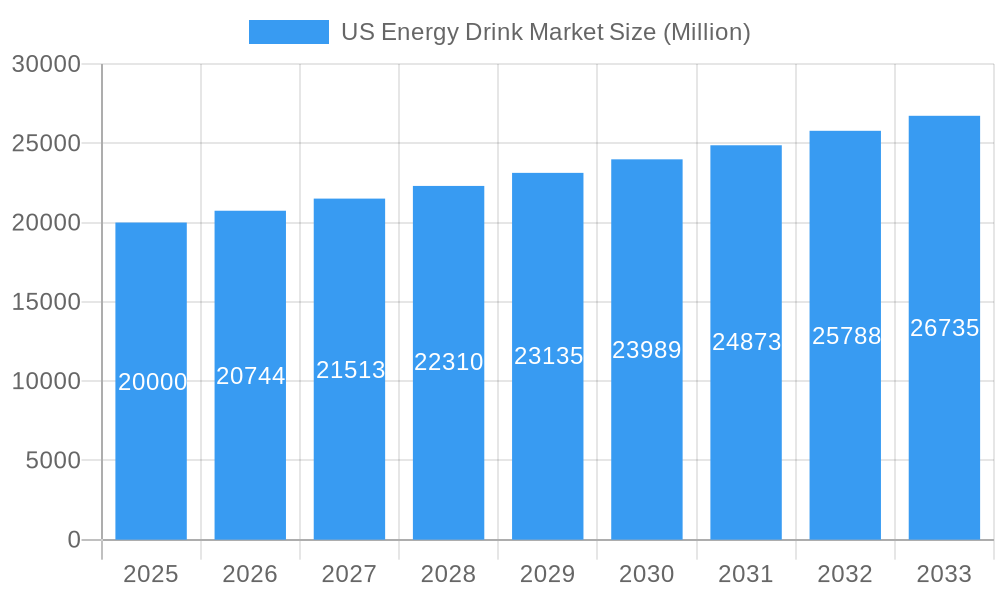
US Energy Drink Market Market Size (In Billion)
Despite this positive outlook, the market encounters challenges. Regulatory scrutiny over high caffeine and sugar content, coupled with increasing consumer health concerns, could impede growth. To navigate these obstacles, industry players are focusing on innovation, developing healthier formulations, and adopting sustainable packaging solutions to meet the demands of a more informed consumer base. The strong presence of established brands presents a significant barrier for new entrants. Future growth will depend on companies' adaptability to shifting consumer preferences and regulatory environments, alongside effective targeted marketing. The North American market, particularly the United States, is anticipated to remain a primary growth engine, driven by high per capita consumption and a strong preference for convenient energy solutions.
US Energy Drink Market Company Market Share
US Energy Drink Market: A Comprehensive Report (2019-2033)
This comprehensive report provides an in-depth analysis of the US energy drink market, encompassing market dynamics, growth trends, regional performance, product landscape, and key players. With a focus on the historical period (2019-2024), base year (2025), and forecast period (2025-2033), this report is an essential resource for industry professionals, investors, and market strategists. The report segments the market by packaging type (Glass Bottles, Metal Can, PET Bottles), distribution channel (Off-trade, On-trade), and soft drink type (Energy Shots, Natural/Organic Energy Drinks, Sugar-free or Low-calories Energy Drinks, Traditional Energy Drinks, Other Energy Drinks). The total market size is projected to reach xx Million units by 2033.
US Energy Drink Market Dynamics & Structure
The US energy drink market is characterized by a dynamic interplay of factors. Market concentration is relatively high, with a few major players dominating the landscape. Technological innovation, particularly in formulations (e.g., natural ingredients, low-sugar options) and packaging, is a key driver. Regulatory frameworks surrounding labeling, ingredients, and marketing significantly impact the industry. Competitive pressure from substitute beverages (e.g., sports drinks, functional beverages) is substantial. End-user demographics show a strong skew towards young adults, though broader market penetration is underway. M&A activity is frequent, reflecting consolidation and efforts to expand market share.
- Market Concentration: The top five players hold approximately xx% of the market share in 2025.
- Technological Innovation: Focus on natural ingredients and functional benefits is driving innovation.
- Regulatory Framework: FDA regulations on labeling and ingredient claims are significant barriers.
- Competitive Substitutes: Sports drinks and functional beverages pose a growing competitive challenge.
- End-User Demographics: 18-35 year olds are the primary target demographic, with growth in other age groups observed.
- M&A Activity: An average of xx M&A deals were recorded annually during the historical period.
US Energy Drink Market Growth Trends & Insights
The US energy drink market has experienced consistent growth over the past few years, fueled by changing consumer preferences and the increasing demand for functional beverages. The market size is projected to exhibit a CAGR of xx% from 2025 to 2033, driven by factors such as the rising popularity of health and wellness products and increasing disposable incomes. The adoption rate of sugar-free and low-calorie energy drinks is growing rapidly, reflecting a shift in consumer health consciousness. Technological advancements, such as the development of innovative packaging and improved manufacturing processes, have also contributed to the market's growth. Changes in consumer behavior, including heightened demand for convenience and portability, further fuel market expansion.
Market penetration in various segments, like natural/organic energy drinks, showcases significant growth potential. This is further supported by the emergence of new product formats and the growing presence of premium brands in the market. The rising popularity of online retail channels and e-commerce platforms has also broadened market access and increased sales.
Dominant Regions, Countries, or Segments in US Energy Drink Market
The US energy drink market demonstrates regional variations in consumption patterns. While market data indicates that [insert specific region/state with highest consumption here ] currently holds the largest market share due to [explain reason, e.g. higher population density, favorable economic conditions, etc.], significant growth is projected in [insert another region/state with high growth potential here] driven by [explain reason, e.g. rising disposable incomes, younger population, etc.].
Dominant Segments:
- Packaging Type: Metal cans currently dominate due to cost-effectiveness and durability, with a market share of approximately xx% in 2025. However, PET bottles are showing significant growth driven by sustainability concerns.
- Distribution Channel: Off-trade channels (e.g., supermarkets, convenience stores) account for a significant share, approximately xx% in 2025, while on-trade (e.g., restaurants, bars) contributes xx%.
- Soft Drink Type: Traditional energy drinks retain the highest market share, estimated at xx% in 2025. However, the segment of sugar-free/low-calorie energy drinks demonstrates the highest growth rate.
US Energy Drink Market Product Landscape
The US energy drink market showcases a diverse product landscape, characterized by both established brands and emerging players. Product innovations are focused on enhancing functionality, incorporating natural ingredients, and catering to diverse consumer preferences. For instance, the inclusion of adaptogens, nootropics, and botanical extracts is gaining popularity. Furthermore, there’s a growing trend towards creative packaging designs and sizes to improve appeal and convenience. Key performance metrics, including consumer satisfaction and sales figures, indicate a preference for functional benefits combined with appealing taste profiles. The success of products often hinges on effectively communicating their unique selling propositions, such as health benefits or a specific lifestyle association.
Key Drivers, Barriers & Challenges in US Energy Drink Market
Key Drivers:
- Increasing health consciousness is driving demand for low-sugar/natural options.
- Rising disposable incomes contribute to increased spending on premium beverages.
- The growing popularity of fitness and athletic activities fuels consumption.
Key Challenges:
- Intense competition from established brands limits growth for new entrants.
- Fluctuating raw material costs and supply chain disruptions can significantly impact margins.
- Strict regulations regarding ingredients and marketing create operational challenges. The regulatory environment adds to production costs which are estimated to cause a xx% increase in production costs by 2033.
Emerging Opportunities in US Energy Drink Market
- The increasing popularity of functional beverages beyond energy boosts creates opportunities for product diversification. This includes products targeting improved focus, stress reduction, or enhanced sleep.
- Untapped markets such as the older adult demographic present potential for growth through targeted product development and marketing.
- Innovative product formats, such as ready-to-drink (RTD) functional beverages, are set to drive further growth.
Growth Accelerators in the US Energy Drink Market Industry
Technological advancements, specifically in formulation and packaging, will act as a key growth driver. Strategic partnerships, including collaborations with fitness brands or health-conscious retailers, are crucial for market expansion. Furthermore, focusing on sustainable packaging and environmentally friendly sourcing strategies will enhance brand appeal and improve sustainability. The growing awareness of health benefits and convenience will continue to accelerate market expansion.
Key Players Shaping the US Energy Drink Market Market
- Woodbolt Distribution LLC
- Seven & I Holdings Co Ltd
- Monster Beverage Corporation
- PepsiCo Inc
- DAS Labs LLC
- Red Bull GmbH
- Living Essentials LLC
- Zevia LL
- The Coca-Cola Company
- N V E Pharmaceuticals
- Congo Brands
Notable Milestones in US Energy Drink Market Sector
- July 2023: Monster Beverage Corporation acquired Bang Energy for approximately USD 362 million, significantly altering market dynamics and expanding its product portfolio.
- July 2023: WWE and Nutrabolt launched a co-branded energy drink, leveraging brand recognition to enter new market segments.
- July 2023: Zevia LLC explored new distribution channels to broaden its market reach and target a wider consumer base.
In-Depth US Energy Drink Market Market Outlook
The US energy drink market is poised for continued expansion, driven by both established brands and innovative newcomers. Future growth will be fueled by increasing consumer demand for healthier options, convenient formats, and functional benefits beyond traditional energy boosts. Strategic partnerships, technological advancements, and a focus on sustainability will be critical for success. The market's potential for expansion remains significant, presenting numerous opportunities for established and emerging companies alike.
US Energy Drink Market Segmentation
-
1. Soft Drink Type
- 1.1. Energy Shots
- 1.2. Natural/Organic Energy Drinks
- 1.3. Sugar-free or Low-calories Energy Drinks
- 1.4. Traditional Energy Drinks
- 1.5. Other Energy Drinks
-
2. Packaging Type
- 2.1. Glass Bottles
- 2.2. Metal Can
- 2.3. PET Bottles
-
3. Distribution Channel
-
3.1. Off-trade
- 3.1.1. Convenience Stores
- 3.1.2. Online Retail
- 3.1.3. Supermarket/Hypermarket
- 3.1.4. Others
- 3.2. On-trade
-
3.1. Off-trade
US Energy Drink Market Segmentation By Geography
-
1. North America
- 1.1. United States
- 1.2. Canada
- 1.3. Mexico
-
2. South America
- 2.1. Brazil
- 2.2. Argentina
- 2.3. Rest of South America
-
3. Europe
- 3.1. United Kingdom
- 3.2. Germany
- 3.3. France
- 3.4. Italy
- 3.5. Spain
- 3.6. Russia
- 3.7. Benelux
- 3.8. Nordics
- 3.9. Rest of Europe
-
4. Middle East & Africa
- 4.1. Turkey
- 4.2. Israel
- 4.3. GCC
- 4.4. North Africa
- 4.5. South Africa
- 4.6. Rest of Middle East & Africa
-
5. Asia Pacific
- 5.1. China
- 5.2. India
- 5.3. Japan
- 5.4. South Korea
- 5.5. ASEAN
- 5.6. Oceania
- 5.7. Rest of Asia Pacific
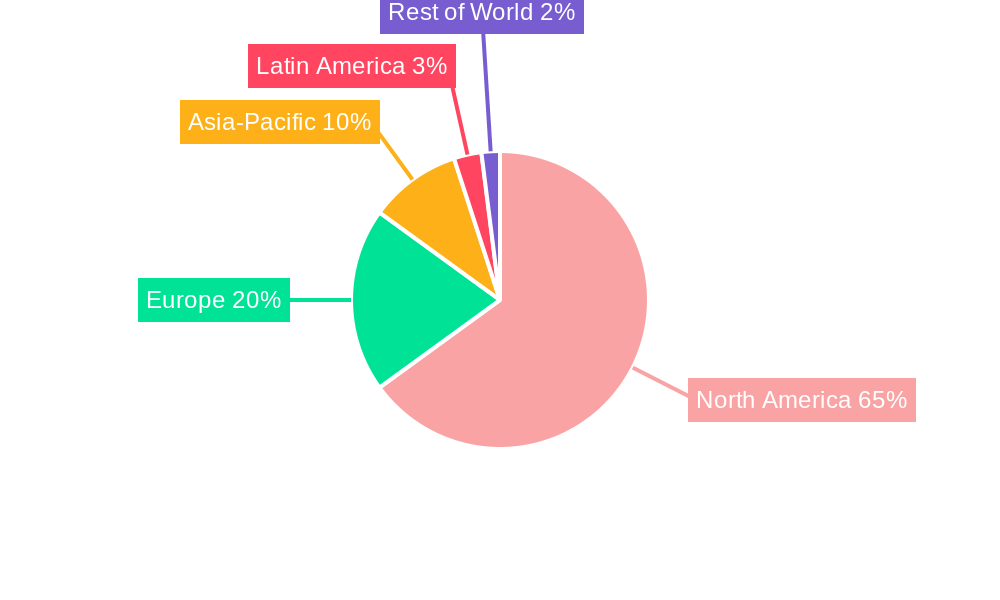
US Energy Drink Market Regional Market Share
Geographic Coverage of US Energy Drink Market
US Energy Drink Market REPORT HIGHLIGHTS
| Aspects | Details |
|---|---|
| Study Period | 2020-2034 |
| Base Year | 2025 |
| Estimated Year | 2026 |
| Forecast Period | 2026-2034 |
| Historical Period | 2020-2025 |
| Growth Rate | CAGR of 2.33% from 2020-2034 |
| Segmentation |
|
Table of Contents
- 1. Introduction
- 1.1. Research Scope
- 1.2. Market Segmentation
- 1.3. Research Objective
- 1.4. Definitions and Assumptions
- 2. Executive Summary
- 2.1. Market Snapshot
- 3. Market Dynamics
- 3.1. Market Drivers
- 3.2. Market Restrains
- 3.3. Market Trends
- 3.4. Market Opportunities
- 4. Market Factor Analysis
- 4.1. Porters Five Forces
- 4.1.1. Bargaining Power of Suppliers
- 4.1.2. Bargaining Power of Buyers
- 4.1.3. Threat of New Entrants
- 4.1.4. Threat of Substitutes
- 4.1.5. Competitive Rivalry
- 4.2. PESTEL analysis
- 4.3. BCG Analysis
- 4.3.1. Stars (High Growth, High Market Share)
- 4.3.2. Cash Cows (Low Growth, High Market Share)
- 4.3.3. Question Mark (High Growth, Low Market Share)
- 4.3.4. Dogs (Low Growth, Low Market Share)
- 4.4. Ansoff Matrix Analysis
- 4.5. Supply Chain Analysis
- 4.6. Regulatory Landscape
- 4.7. Current Market Potential and Opportunity Assessment (TAM–SAM–SOM Framework)
- 4.8. VDR Analyst Note
- 4.1. Porters Five Forces
- 5. Market Analysis, Insights and Forecast 2021-2033
- 5.1. Market Analysis, Insights and Forecast - by Soft Drink Type
- 5.1.1. Energy Shots
- 5.1.2. Natural/Organic Energy Drinks
- 5.1.3. Sugar-free or Low-calories Energy Drinks
- 5.1.4. Traditional Energy Drinks
- 5.1.5. Other Energy Drinks
- 5.2. Market Analysis, Insights and Forecast - by Packaging Type
- 5.2.1. Glass Bottles
- 5.2.2. Metal Can
- 5.2.3. PET Bottles
- 5.3. Market Analysis, Insights and Forecast - by Distribution Channel
- 5.3.1. Off-trade
- 5.3.1.1. Convenience Stores
- 5.3.1.2. Online Retail
- 5.3.1.3. Supermarket/Hypermarket
- 5.3.1.4. Others
- 5.3.2. On-trade
- 5.3.1. Off-trade
- 5.4. Market Analysis, Insights and Forecast - by Region
- 5.4.1. North America
- 5.4.2. South America
- 5.4.3. Europe
- 5.4.4. Middle East & Africa
- 5.4.5. Asia Pacific
- 5.1. Market Analysis, Insights and Forecast - by Soft Drink Type
- 6. Global US Energy Drink Market Analysis, Insights and Forecast, 2021-2033
- 6.1. Market Analysis, Insights and Forecast - by Soft Drink Type
- 6.1.1. Energy Shots
- 6.1.2. Natural/Organic Energy Drinks
- 6.1.3. Sugar-free or Low-calories Energy Drinks
- 6.1.4. Traditional Energy Drinks
- 6.1.5. Other Energy Drinks
- 6.2. Market Analysis, Insights and Forecast - by Packaging Type
- 6.2.1. Glass Bottles
- 6.2.2. Metal Can
- 6.2.3. PET Bottles
- 6.3. Market Analysis, Insights and Forecast - by Distribution Channel
- 6.3.1. Off-trade
- 6.3.1.1. Convenience Stores
- 6.3.1.2. Online Retail
- 6.3.1.3. Supermarket/Hypermarket
- 6.3.1.4. Others
- 6.3.2. On-trade
- 6.3.1. Off-trade
- 6.1. Market Analysis, Insights and Forecast - by Soft Drink Type
- 7. North America US Energy Drink Market Analysis, Insights and Forecast, 2021-2033
- 7.1. Market Analysis, Insights and Forecast - by Soft Drink Type
- 7.1.1. Energy Shots
- 7.1.2. Natural/Organic Energy Drinks
- 7.1.3. Sugar-free or Low-calories Energy Drinks
- 7.1.4. Traditional Energy Drinks
- 7.1.5. Other Energy Drinks
- 7.2. Market Analysis, Insights and Forecast - by Packaging Type
- 7.2.1. Glass Bottles
- 7.2.2. Metal Can
- 7.2.3. PET Bottles
- 7.3. Market Analysis, Insights and Forecast - by Distribution Channel
- 7.3.1. Off-trade
- 7.3.1.1. Convenience Stores
- 7.3.1.2. Online Retail
- 7.3.1.3. Supermarket/Hypermarket
- 7.3.1.4. Others
- 7.3.2. On-trade
- 7.3.1. Off-trade
- 7.1. Market Analysis, Insights and Forecast - by Soft Drink Type
- 8. South America US Energy Drink Market Analysis, Insights and Forecast, 2021-2033
- 8.1. Market Analysis, Insights and Forecast - by Soft Drink Type
- 8.1.1. Energy Shots
- 8.1.2. Natural/Organic Energy Drinks
- 8.1.3. Sugar-free or Low-calories Energy Drinks
- 8.1.4. Traditional Energy Drinks
- 8.1.5. Other Energy Drinks
- 8.2. Market Analysis, Insights and Forecast - by Packaging Type
- 8.2.1. Glass Bottles
- 8.2.2. Metal Can
- 8.2.3. PET Bottles
- 8.3. Market Analysis, Insights and Forecast - by Distribution Channel
- 8.3.1. Off-trade
- 8.3.1.1. Convenience Stores
- 8.3.1.2. Online Retail
- 8.3.1.3. Supermarket/Hypermarket
- 8.3.1.4. Others
- 8.3.2. On-trade
- 8.3.1. Off-trade
- 8.1. Market Analysis, Insights and Forecast - by Soft Drink Type
- 9. Europe US Energy Drink Market Analysis, Insights and Forecast, 2021-2033
- 9.1. Market Analysis, Insights and Forecast - by Soft Drink Type
- 9.1.1. Energy Shots
- 9.1.2. Natural/Organic Energy Drinks
- 9.1.3. Sugar-free or Low-calories Energy Drinks
- 9.1.4. Traditional Energy Drinks
- 9.1.5. Other Energy Drinks
- 9.2. Market Analysis, Insights and Forecast - by Packaging Type
- 9.2.1. Glass Bottles
- 9.2.2. Metal Can
- 9.2.3. PET Bottles
- 9.3. Market Analysis, Insights and Forecast - by Distribution Channel
- 9.3.1. Off-trade
- 9.3.1.1. Convenience Stores
- 9.3.1.2. Online Retail
- 9.3.1.3. Supermarket/Hypermarket
- 9.3.1.4. Others
- 9.3.2. On-trade
- 9.3.1. Off-trade
- 9.1. Market Analysis, Insights and Forecast - by Soft Drink Type
- 10. Middle East & Africa US Energy Drink Market Analysis, Insights and Forecast, 2021-2033
- 10.1. Market Analysis, Insights and Forecast - by Soft Drink Type
- 10.1.1. Energy Shots
- 10.1.2. Natural/Organic Energy Drinks
- 10.1.3. Sugar-free or Low-calories Energy Drinks
- 10.1.4. Traditional Energy Drinks
- 10.1.5. Other Energy Drinks
- 10.2. Market Analysis, Insights and Forecast - by Packaging Type
- 10.2.1. Glass Bottles
- 10.2.2. Metal Can
- 10.2.3. PET Bottles
- 10.3. Market Analysis, Insights and Forecast - by Distribution Channel
- 10.3.1. Off-trade
- 10.3.1.1. Convenience Stores
- 10.3.1.2. Online Retail
- 10.3.1.3. Supermarket/Hypermarket
- 10.3.1.4. Others
- 10.3.2. On-trade
- 10.3.1. Off-trade
- 10.1. Market Analysis, Insights and Forecast - by Soft Drink Type
- 11. Asia Pacific US Energy Drink Market Analysis, Insights and Forecast, 2021-2033
- 11.1. Market Analysis, Insights and Forecast - by Soft Drink Type
- 11.1.1. Energy Shots
- 11.1.2. Natural/Organic Energy Drinks
- 11.1.3. Sugar-free or Low-calories Energy Drinks
- 11.1.4. Traditional Energy Drinks
- 11.1.5. Other Energy Drinks
- 11.2. Market Analysis, Insights and Forecast - by Packaging Type
- 11.2.1. Glass Bottles
- 11.2.2. Metal Can
- 11.2.3. PET Bottles
- 11.3. Market Analysis, Insights and Forecast - by Distribution Channel
- 11.3.1. Off-trade
- 11.3.1.1. Convenience Stores
- 11.3.1.2. Online Retail
- 11.3.1.3. Supermarket/Hypermarket
- 11.3.1.4. Others
- 11.3.2. On-trade
- 11.3.1. Off-trade
- 11.1. Market Analysis, Insights and Forecast - by Soft Drink Type
- 12. Competitive Analysis
- 12.1. Company Profiles
- 12.1.1 Woodbolt Distribution LLC
- 12.1.1.1. Company Overview
- 12.1.1.2. Products
- 12.1.1.3. Company Financials
- 12.1.1.4. SWOT Analysis
- 12.1.2 Seven & I Holdings Co Ltd
- 12.1.2.1. Company Overview
- 12.1.2.2. Products
- 12.1.2.3. Company Financials
- 12.1.2.4. SWOT Analysis
- 12.1.3 Monster Beverage Corporation
- 12.1.3.1. Company Overview
- 12.1.3.2. Products
- 12.1.3.3. Company Financials
- 12.1.3.4. SWOT Analysis
- 12.1.4 PepsiCo Inc
- 12.1.4.1. Company Overview
- 12.1.4.2. Products
- 12.1.4.3. Company Financials
- 12.1.4.4. SWOT Analysis
- 12.1.5 DAS Labs LLC
- 12.1.5.1. Company Overview
- 12.1.5.2. Products
- 12.1.5.3. Company Financials
- 12.1.5.4. SWOT Analysis
- 12.1.6 Red Bull GmbH
- 12.1.6.1. Company Overview
- 12.1.6.2. Products
- 12.1.6.3. Company Financials
- 12.1.6.4. SWOT Analysis
- 12.1.7 Living Essentials LLC
- 12.1.7.1. Company Overview
- 12.1.7.2. Products
- 12.1.7.3. Company Financials
- 12.1.7.4. SWOT Analysis
- 12.1.8 Zevia LL
- 12.1.8.1. Company Overview
- 12.1.8.2. Products
- 12.1.8.3. Company Financials
- 12.1.8.4. SWOT Analysis
- 12.1.9 The Coca-Cola Company
- 12.1.9.1. Company Overview
- 12.1.9.2. Products
- 12.1.9.3. Company Financials
- 12.1.9.4. SWOT Analysis
- 12.1.10 N V E Pharmaceuticals
- 12.1.10.1. Company Overview
- 12.1.10.2. Products
- 12.1.10.3. Company Financials
- 12.1.10.4. SWOT Analysis
- 12.1.11 Congo Brands
- 12.1.11.1. Company Overview
- 12.1.11.2. Products
- 12.1.11.3. Company Financials
- 12.1.11.4. SWOT Analysis
- 12.1.1 Woodbolt Distribution LLC
- 12.2. Market Entropy
- 12.2.1 Company's Key Areas Served
- 12.2.2 Recent Developments
- 12.3. Company Market Share Analysis 2025
- 12.3.1 Top 5 Companies Market Share Analysis
- 12.3.2 Top 3 Companies Market Share Analysis
- 12.4. List of Potential Customers
- 13. Research Methodology
List of Figures
- Figure 1: Global US Energy Drink Market Revenue Breakdown (billion, %) by Region 2025 & 2033
- Figure 2: North America US Energy Drink Market Revenue (billion), by Soft Drink Type 2025 & 2033
- Figure 3: North America US Energy Drink Market Revenue Share (%), by Soft Drink Type 2025 & 2033
- Figure 4: North America US Energy Drink Market Revenue (billion), by Packaging Type 2025 & 2033
- Figure 5: North America US Energy Drink Market Revenue Share (%), by Packaging Type 2025 & 2033
- Figure 6: North America US Energy Drink Market Revenue (billion), by Distribution Channel 2025 & 2033
- Figure 7: North America US Energy Drink Market Revenue Share (%), by Distribution Channel 2025 & 2033
- Figure 8: North America US Energy Drink Market Revenue (billion), by Country 2025 & 2033
- Figure 9: North America US Energy Drink Market Revenue Share (%), by Country 2025 & 2033
- Figure 10: South America US Energy Drink Market Revenue (billion), by Soft Drink Type 2025 & 2033
- Figure 11: South America US Energy Drink Market Revenue Share (%), by Soft Drink Type 2025 & 2033
- Figure 12: South America US Energy Drink Market Revenue (billion), by Packaging Type 2025 & 2033
- Figure 13: South America US Energy Drink Market Revenue Share (%), by Packaging Type 2025 & 2033
- Figure 14: South America US Energy Drink Market Revenue (billion), by Distribution Channel 2025 & 2033
- Figure 15: South America US Energy Drink Market Revenue Share (%), by Distribution Channel 2025 & 2033
- Figure 16: South America US Energy Drink Market Revenue (billion), by Country 2025 & 2033
- Figure 17: South America US Energy Drink Market Revenue Share (%), by Country 2025 & 2033
- Figure 18: Europe US Energy Drink Market Revenue (billion), by Soft Drink Type 2025 & 2033
- Figure 19: Europe US Energy Drink Market Revenue Share (%), by Soft Drink Type 2025 & 2033
- Figure 20: Europe US Energy Drink Market Revenue (billion), by Packaging Type 2025 & 2033
- Figure 21: Europe US Energy Drink Market Revenue Share (%), by Packaging Type 2025 & 2033
- Figure 22: Europe US Energy Drink Market Revenue (billion), by Distribution Channel 2025 & 2033
- Figure 23: Europe US Energy Drink Market Revenue Share (%), by Distribution Channel 2025 & 2033
- Figure 24: Europe US Energy Drink Market Revenue (billion), by Country 2025 & 2033
- Figure 25: Europe US Energy Drink Market Revenue Share (%), by Country 2025 & 2033
- Figure 26: Middle East & Africa US Energy Drink Market Revenue (billion), by Soft Drink Type 2025 & 2033
- Figure 27: Middle East & Africa US Energy Drink Market Revenue Share (%), by Soft Drink Type 2025 & 2033
- Figure 28: Middle East & Africa US Energy Drink Market Revenue (billion), by Packaging Type 2025 & 2033
- Figure 29: Middle East & Africa US Energy Drink Market Revenue Share (%), by Packaging Type 2025 & 2033
- Figure 30: Middle East & Africa US Energy Drink Market Revenue (billion), by Distribution Channel 2025 & 2033
- Figure 31: Middle East & Africa US Energy Drink Market Revenue Share (%), by Distribution Channel 2025 & 2033
- Figure 32: Middle East & Africa US Energy Drink Market Revenue (billion), by Country 2025 & 2033
- Figure 33: Middle East & Africa US Energy Drink Market Revenue Share (%), by Country 2025 & 2033
- Figure 34: Asia Pacific US Energy Drink Market Revenue (billion), by Soft Drink Type 2025 & 2033
- Figure 35: Asia Pacific US Energy Drink Market Revenue Share (%), by Soft Drink Type 2025 & 2033
- Figure 36: Asia Pacific US Energy Drink Market Revenue (billion), by Packaging Type 2025 & 2033
- Figure 37: Asia Pacific US Energy Drink Market Revenue Share (%), by Packaging Type 2025 & 2033
- Figure 38: Asia Pacific US Energy Drink Market Revenue (billion), by Distribution Channel 2025 & 2033
- Figure 39: Asia Pacific US Energy Drink Market Revenue Share (%), by Distribution Channel 2025 & 2033
- Figure 40: Asia Pacific US Energy Drink Market Revenue (billion), by Country 2025 & 2033
- Figure 41: Asia Pacific US Energy Drink Market Revenue Share (%), by Country 2025 & 2033
List of Tables
- Table 1: Global US Energy Drink Market Revenue billion Forecast, by Soft Drink Type 2020 & 2033
- Table 2: Global US Energy Drink Market Revenue billion Forecast, by Packaging Type 2020 & 2033
- Table 3: Global US Energy Drink Market Revenue billion Forecast, by Distribution Channel 2020 & 2033
- Table 4: Global US Energy Drink Market Revenue billion Forecast, by Region 2020 & 2033
- Table 5: Global US Energy Drink Market Revenue billion Forecast, by Soft Drink Type 2020 & 2033
- Table 6: Global US Energy Drink Market Revenue billion Forecast, by Packaging Type 2020 & 2033
- Table 7: Global US Energy Drink Market Revenue billion Forecast, by Distribution Channel 2020 & 2033
- Table 8: Global US Energy Drink Market Revenue billion Forecast, by Country 2020 & 2033
- Table 9: United States US Energy Drink Market Revenue (billion) Forecast, by Application 2020 & 2033
- Table 10: Canada US Energy Drink Market Revenue (billion) Forecast, by Application 2020 & 2033
- Table 11: Mexico US Energy Drink Market Revenue (billion) Forecast, by Application 2020 & 2033
- Table 12: Global US Energy Drink Market Revenue billion Forecast, by Soft Drink Type 2020 & 2033
- Table 13: Global US Energy Drink Market Revenue billion Forecast, by Packaging Type 2020 & 2033
- Table 14: Global US Energy Drink Market Revenue billion Forecast, by Distribution Channel 2020 & 2033
- Table 15: Global US Energy Drink Market Revenue billion Forecast, by Country 2020 & 2033
- Table 16: Brazil US Energy Drink Market Revenue (billion) Forecast, by Application 2020 & 2033
- Table 17: Argentina US Energy Drink Market Revenue (billion) Forecast, by Application 2020 & 2033
- Table 18: Rest of South America US Energy Drink Market Revenue (billion) Forecast, by Application 2020 & 2033
- Table 19: Global US Energy Drink Market Revenue billion Forecast, by Soft Drink Type 2020 & 2033
- Table 20: Global US Energy Drink Market Revenue billion Forecast, by Packaging Type 2020 & 2033
- Table 21: Global US Energy Drink Market Revenue billion Forecast, by Distribution Channel 2020 & 2033
- Table 22: Global US Energy Drink Market Revenue billion Forecast, by Country 2020 & 2033
- Table 23: United Kingdom US Energy Drink Market Revenue (billion) Forecast, by Application 2020 & 2033
- Table 24: Germany US Energy Drink Market Revenue (billion) Forecast, by Application 2020 & 2033
- Table 25: France US Energy Drink Market Revenue (billion) Forecast, by Application 2020 & 2033
- Table 26: Italy US Energy Drink Market Revenue (billion) Forecast, by Application 2020 & 2033
- Table 27: Spain US Energy Drink Market Revenue (billion) Forecast, by Application 2020 & 2033
- Table 28: Russia US Energy Drink Market Revenue (billion) Forecast, by Application 2020 & 2033
- Table 29: Benelux US Energy Drink Market Revenue (billion) Forecast, by Application 2020 & 2033
- Table 30: Nordics US Energy Drink Market Revenue (billion) Forecast, by Application 2020 & 2033
- Table 31: Rest of Europe US Energy Drink Market Revenue (billion) Forecast, by Application 2020 & 2033
- Table 32: Global US Energy Drink Market Revenue billion Forecast, by Soft Drink Type 2020 & 2033
- Table 33: Global US Energy Drink Market Revenue billion Forecast, by Packaging Type 2020 & 2033
- Table 34: Global US Energy Drink Market Revenue billion Forecast, by Distribution Channel 2020 & 2033
- Table 35: Global US Energy Drink Market Revenue billion Forecast, by Country 2020 & 2033
- Table 36: Turkey US Energy Drink Market Revenue (billion) Forecast, by Application 2020 & 2033
- Table 37: Israel US Energy Drink Market Revenue (billion) Forecast, by Application 2020 & 2033
- Table 38: GCC US Energy Drink Market Revenue (billion) Forecast, by Application 2020 & 2033
- Table 39: North Africa US Energy Drink Market Revenue (billion) Forecast, by Application 2020 & 2033
- Table 40: South Africa US Energy Drink Market Revenue (billion) Forecast, by Application 2020 & 2033
- Table 41: Rest of Middle East & Africa US Energy Drink Market Revenue (billion) Forecast, by Application 2020 & 2033
- Table 42: Global US Energy Drink Market Revenue billion Forecast, by Soft Drink Type 2020 & 2033
- Table 43: Global US Energy Drink Market Revenue billion Forecast, by Packaging Type 2020 & 2033
- Table 44: Global US Energy Drink Market Revenue billion Forecast, by Distribution Channel 2020 & 2033
- Table 45: Global US Energy Drink Market Revenue billion Forecast, by Country 2020 & 2033
- Table 46: China US Energy Drink Market Revenue (billion) Forecast, by Application 2020 & 2033
- Table 47: India US Energy Drink Market Revenue (billion) Forecast, by Application 2020 & 2033
- Table 48: Japan US Energy Drink Market Revenue (billion) Forecast, by Application 2020 & 2033
- Table 49: South Korea US Energy Drink Market Revenue (billion) Forecast, by Application 2020 & 2033
- Table 50: ASEAN US Energy Drink Market Revenue (billion) Forecast, by Application 2020 & 2033
- Table 51: Oceania US Energy Drink Market Revenue (billion) Forecast, by Application 2020 & 2033
- Table 52: Rest of Asia Pacific US Energy Drink Market Revenue (billion) Forecast, by Application 2020 & 2033
Frequently Asked Questions
1. What is the projected Compound Annual Growth Rate (CAGR) of the US Energy Drink Market?
The projected CAGR is approximately 2.33%.
2. Which companies are prominent players in the US Energy Drink Market?
Key companies in the market include Woodbolt Distribution LLC, Seven & I Holdings Co Ltd, Monster Beverage Corporation, PepsiCo Inc, DAS Labs LLC, Red Bull GmbH, Living Essentials LLC, Zevia LL, The Coca-Cola Company, N V E Pharmaceuticals, Congo Brands.
3. What are the main segments of the US Energy Drink Market?
The market segments include Soft Drink Type, Packaging Type, Distribution Channel.
4. Can you provide details about the market size?
The market size is estimated to be USD 50.33 billion as of 2022.
5. What are some drivers contributing to market growth?
Rising Consumer Awareness about Health and Fitness; Increasing the Use of Casein and Caseinate in Food and Beverage Industry.
6. What are the notable trends driving market growth?
OTHER KEY INDUSTRY TRENDS COVERED IN THE REPORT.
7. Are there any restraints impacting market growth?
High Competition From Alternative Protein Sources.
8. Can you provide examples of recent developments in the market?
July 2023: Monster Beverage Corporation announced that its subsidiary, Blast Asset Acquisition LLC, completed its acquisition of substantially all of the assets of Vital Pharmaceuticals, Inc. and certain of its affiliates (collectively, “Bang Energy”) for approximately USD 362 million. The acquired assets include Bang Energy beverages and a beverage production facility in Phoenix, Arizona.July 2023: WWE and Nutrabolt, owner of the C4 brand, announced an expansion to their multi-year partnership with the launch of their first-ever co-branded product collaboration: WWE-inspired flavors of C4 Ultimate Pre-Workout Powder and C4 Ultimate Energy Drink.July 2023: The Los Angeles-based company Zevia LLC is considering getting a new distribution partner to expand its base business from selling multi-packs in grocery stores to selling single-serve cold beverages in c-stores.
9. What pricing options are available for accessing the report?
Pricing options include single-user, multi-user, and enterprise licenses priced at USD 3800, USD 4500, and USD 5800 respectively.
10. Is the market size provided in terms of value or volume?
The market size is provided in terms of value, measured in billion.
11. Are there any specific market keywords associated with the report?
Yes, the market keyword associated with the report is "US Energy Drink Market," which aids in identifying and referencing the specific market segment covered.
12. How do I determine which pricing option suits my needs best?
The pricing options vary based on user requirements and access needs. Individual users may opt for single-user licenses, while businesses requiring broader access may choose multi-user or enterprise licenses for cost-effective access to the report.
13. Are there any additional resources or data provided in the US Energy Drink Market report?
While the report offers comprehensive insights, it's advisable to review the specific contents or supplementary materials provided to ascertain if additional resources or data are available.
14. How can I stay updated on further developments or reports in the US Energy Drink Market?
To stay informed about further developments, trends, and reports in the US Energy Drink Market, consider subscribing to industry newsletters, following relevant companies and organizations, or regularly checking reputable industry news sources and publications.
Methodology
Step 1 - Identification of Relevant Samples Size from Population Database


Step 2 - Approaches for Defining Global Market Size (Value, Volume* & Price*)

Note*: In applicable scenarios
Step 3 - Data Sources
Primary Research
- Web Analytics
- Survey Reports
- Research Institute
- Latest Research Reports
- Opinion Leaders
Secondary Research
- Annual Reports
- White Paper
- Latest Press Release
- Industry Association
- Paid Database
- Investor Presentations

Step 4 - Data Triangulation
Involves using different sources of information in order to increase the validity of a study
These sources are likely to be stakeholders in a program - participants, other researchers, program staff, other community members, and so on.
Then we put all data in single framework & apply various statistical tools to find out the dynamic on the market.
During the analysis stage, feedback from the stakeholder groups would be compared to determine areas of agreement as well as areas of divergence