
Key Insights
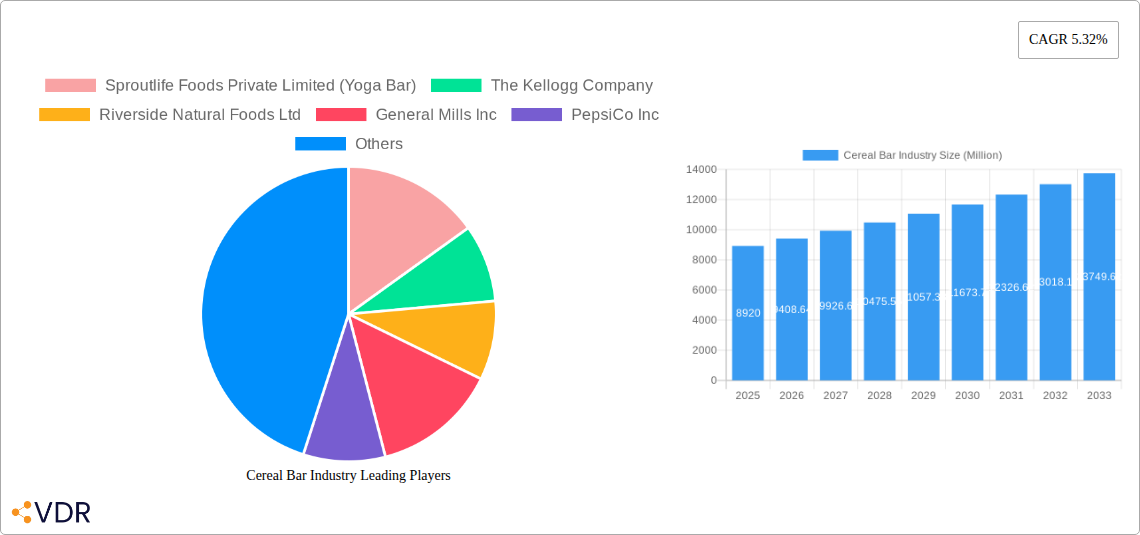
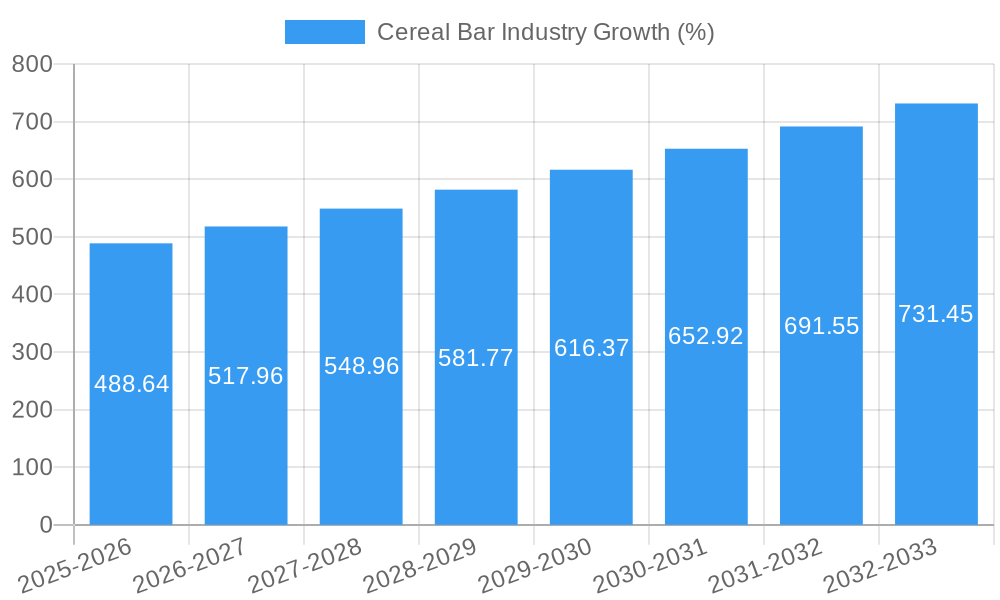
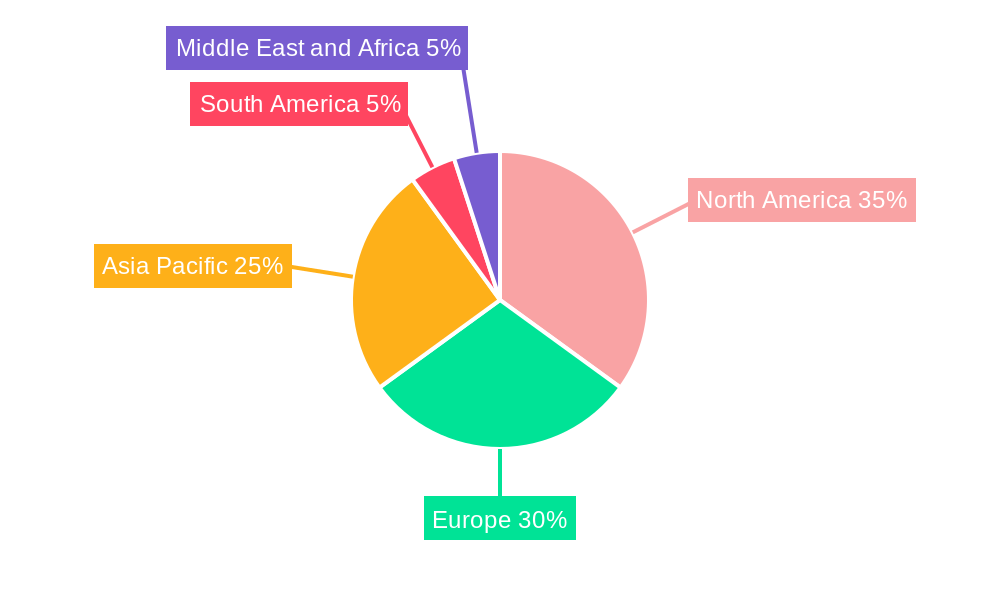
The global cereal bar market, valued at $8.92 billion in 2025, is projected to experience robust growth, driven by increasing consumer demand for convenient, nutritious, and on-the-go breakfast and snack options. The market's Compound Annual Growth Rate (CAGR) of 5.32% from 2025 to 2033 indicates a significant expansion opportunity. Key drivers include the rising prevalence of health-conscious lifestyles, the growing popularity of functional foods (bars enriched with protein, fiber, and vitamins), and the increasing demand for convenient and portable snacks. This trend is further amplified by the expanding presence of health-focused food retailers and the proliferation of online retail channels, offering increased accessibility to a wider range of cereal bar products. Segment-wise, granola/muesli bars hold a significant market share, driven by their perceived health benefits. However, other bar types, such as protein bars and energy bars, are witnessing considerable growth due to the burgeoning fitness and wellness industry. Geographically, North America and Europe currently dominate the market, but Asia Pacific is expected to witness substantial growth, fueled by rising disposable incomes and changing consumer preferences. While the market faces challenges such as increasing raw material costs and intense competition, the overall outlook remains positive, driven by continuous innovation in product offerings and expanding distribution networks.
The competitive landscape is characterized by a mix of established multinational food companies like Kellogg's and General Mills, alongside smaller, niche players focusing on organic and specialty cereal bars. This dynamic interplay between established brands and emerging players contributes to market innovation and diversity. Major companies are strategically focusing on product diversification, expanding distribution channels (e.g., online and direct-to-consumer sales), and launching innovative product lines to cater to the evolving consumer demands for healthier and more convenient snack options. Future market growth will hinge on factors such as successful product innovation, effective marketing strategies targeting health-conscious consumers, and the ability to maintain sustainable supply chains amid fluctuating raw material prices. The ongoing shift towards healthier lifestyles and the growing preference for on-the-go snacking will continue to propel the market’s expansion in the coming years.
Cereal Bar Industry Market Report: 2019-2033
This comprehensive report provides a detailed analysis of the global cereal bar industry, encompassing market dynamics, growth trends, competitive landscape, and future outlook. With a focus on key segments like Granola/Muesli bars and Other bars, and distribution channels including Convenience Stores, Supermarkets/Hypermarkets, and Online Retail, this report is an invaluable resource for industry professionals, investors, and strategists. The study period covers 2019-2033, with 2025 as the base and estimated year.
Cereal Bar Industry Market Dynamics & Structure
The global cereal bar market, valued at xx Million units in 2024, exhibits a moderately concentrated structure with key players like Kellogg's, General Mills, and PepsiCo holding significant market share. Technological innovation, particularly in healthier ingredients and sustainable packaging, is a key driver. Stringent food safety regulations and evolving consumer preferences influence market dynamics. Competitive pressures from substitute snacks and the rise of private label brands are also noteworthy. M&A activity has been moderate in recent years, with xx deals recorded between 2019 and 2024, primarily focused on expanding product portfolios and geographical reach.
- Market Concentration: Moderately concentrated, with top 5 players holding approximately xx% market share in 2024.
- Technological Innovation: Focus on healthier ingredients (e.g., organic, gluten-free), functional benefits (e.g., protein-rich), and sustainable packaging.
- Regulatory Framework: Stringent food safety and labeling regulations impacting product development and marketing.
- Competitive Substitutes: Competition from other convenient snack foods like protein bars, energy bars, and fruit snacks.
- End-User Demographics: Growing demand from health-conscious consumers, particularly millennials and Gen Z.
- M&A Trends: Moderate activity, driven by expansion strategies and portfolio diversification.
Cereal Bar Industry Growth Trends & Insights
The global cereal bar market experienced a CAGR of xx% during 2019-2024, driven by increasing health consciousness, convenience, and the growing demand for on-the-go snacks. Market penetration is high in developed regions, but significant growth potential remains in emerging markets. Technological disruptions, such as the rise of personalized nutrition and direct-to-consumer models, are reshaping the market landscape. Consumer behavior shifts towards healthier and more sustainable options are influencing product innovation and marketing strategies. The market is expected to reach xx Million units by 2033, with a projected CAGR of xx% during the forecast period (2025-2033).
Dominant Regions, Countries, or Segments in Cereal Bar Industry
North America currently dominates the global cereal bar market, driven by high consumer spending on convenient and healthy snacks. Within product types, Granola/Muesli bars hold a larger market share compared to other bars, reflecting consumer preference for healthier options. Supermarkets/Hypermarkets remain the leading distribution channel, due to their wide reach and established supply chains. However, online retail is experiencing rapid growth, fueled by e-commerce expansion and increased consumer preference for online shopping.
- Key Drivers:
- North America: High disposable income, health-conscious consumers, established retail infrastructure.
- Granola/Muesli Bars: Perceived health benefits, versatility, and availability in various formats.
- Supermarkets/Hypermarkets: Wide reach, established distribution networks, and consumer familiarity.
- Dominance Factors:
- Market share and growth potential of specific regions, product types, and distribution channels.
- Consumer preferences, economic conditions, and retail landscape.
Cereal Bar Industry Product Landscape
The cereal bar market features a diverse range of products, catering to varied consumer preferences and dietary needs. Innovations focus on healthier ingredients, unique flavor profiles, functional benefits (e.g., protein, fiber), and sustainable packaging. Key selling propositions include convenience, portability, and nutritional value. Technological advancements involve improved manufacturing processes, advanced packaging technologies, and personalized nutrition solutions.
Key Drivers, Barriers & Challenges in Cereal Bar Industry
Key Drivers:
- Growing demand for convenient and healthy snacks.
- Increasing health awareness among consumers.
- Rise of e-commerce and online retail channels.
- Product innovation and diversification.
Key Challenges:
- Intense competition from established players and private labels.
- Fluctuations in raw material prices.
- Stringent regulations regarding food safety and labeling.
- Maintaining consistent product quality and shelf life.
Emerging Opportunities in Cereal Bar Industry
- Untapped Markets: Expanding into emerging economies with rising disposable incomes and changing dietary habits.
- Innovative Applications: Development of new product formats, flavors, and functional benefits to cater to evolving consumer preferences.
- Evolving Consumer Preferences: Focusing on clean label products, organic ingredients, and sustainable packaging.
Growth Accelerators in the Cereal Bar Industry
Technological advancements in manufacturing and packaging, strategic partnerships to expand distribution reach, and aggressive marketing strategies focused on health and wellness are key catalysts driving long-term growth in the cereal bar industry. Expansion into new geographical markets and the development of innovative product lines targeting niche consumer segments are also crucial growth accelerators.
Key Players Shaping the Cereal Bar Industry Market
- Sproutlife Foods Private Limited (Yoga Bar)
- The Kellogg Company
- Riverside Natural Foods Ltd
- General Mills Inc
- PepsiCo Inc
- Associated British Foods PLC
- Mars Incorporated
- Mondelēz International Inc
- NuGo Nutrition
- McKee Foods Corporation
Notable Milestones in Cereal Bar Industry Sector
- January 2024: McKee Foods launched Sunbelt Bakery chewy granola bars in three flavors for the vending industry.
- January 2024: Mars China launched a SNICKERS bar with dark chocolate cereal in recyclable mono-PP packaging.
- March 2024: World of Sweets partnered with Mondelez International to expand the Clif brand's retail presence.
In-Depth Cereal Bar Industry Market Outlook
The cereal bar market is poised for sustained growth, driven by evolving consumer preferences and technological advancements. Strategic investments in product innovation, sustainable packaging, and targeted marketing campaigns will be crucial for success. Expansion into emerging markets and the development of niche product lines catering to specific dietary needs and lifestyles will unlock significant growth opportunities in the coming years.
Cereal Bar Industry Segmentation
-
1. Product Type
- 1.1. Granola/Muesli Bars
- 1.2. Other Bars
-
2. Distribution Channel
- 2.1. Convenience Stores
- 2.2. Supermarkets/Hypermarkets
- 2.3. Specialty Stores
- 2.4. Online Retail Stores
- 2.5. Other Distribution Channels
Cereal Bar Industry Segmentation By Geography
-
1. North America
- 1.1. United States
- 1.2. Canada
- 1.3. Mexico
- 1.4. Rest of North America
-
2. Europe
- 2.1. Spain
- 2.2. United Kingdom
- 2.3. Germany
- 2.4. France
- 2.5. Italy
- 2.6. Netherlands
- 2.7. Rest of Europe
-
3. Asia Pacific
- 3.1. China
- 3.2. Japan
- 3.3. India
- 3.4. Australia
- 3.5. Rest of Asia Pacific
-
4. South America
- 4.1. Brazil
- 4.2. Argentina
- 4.3. Rest of South America
-
5. Middle East and Africa
- 5.1. South Africa
- 5.2. United Arab Emirates
- 5.3. Rest of Middle East and Africa
Cereal Bar Industry REPORT HIGHLIGHTS
| Aspects | Details |
|---|---|
| Study Period | 2019-2033 |
| Base Year | 2024 |
| Estimated Year | 2025 |
| Forecast Period | 2025-2033 |
| Historical Period | 2019-2024 |
| Growth Rate | CAGR of 5.32% from 2019-2033 |
| Segmentation |
|
Table of Contents
- 1. Introduction
- 1.1. Research Scope
- 1.2. Market Segmentation
- 1.3. Research Methodology
- 1.4. Definitions and Assumptions
- 2. Executive Summary
- 2.1. Introduction
- 3. Market Dynamics
- 3.1. Introduction
- 3.2. Market Drivers
- 3.2.1. Popularity of On-the-Go Snacking Options; Trend Of Clean Label and Plant-Based Bars
- 3.3. Market Restrains
- 3.3.1. Availability of Counterfeit Products
- 3.4. Market Trends
- 3.4.1. Rising Demand for On-the-go and Small-portion Snacking
- 4. Market Factor Analysis
- 4.1. Porters Five Forces
- 4.2. Supply/Value Chain
- 4.3. PESTEL analysis
- 4.4. Market Entropy
- 4.5. Patent/Trademark Analysis
- 5. Global Cereal Bar Industry Analysis, Insights and Forecast, 2019-2031
- 5.1. Market Analysis, Insights and Forecast - by Product Type
- 5.1.1. Granola/Muesli Bars
- 5.1.2. Other Bars
- 5.2. Market Analysis, Insights and Forecast - by Distribution Channel
- 5.2.1. Convenience Stores
- 5.2.2. Supermarkets/Hypermarkets
- 5.2.3. Specialty Stores
- 5.2.4. Online Retail Stores
- 5.2.5. Other Distribution Channels
- 5.3. Market Analysis, Insights and Forecast - by Region
- 5.3.1. North America
- 5.3.2. Europe
- 5.3.3. Asia Pacific
- 5.3.4. South America
- 5.3.5. Middle East and Africa
- 5.1. Market Analysis, Insights and Forecast - by Product Type
- 6. North America Cereal Bar Industry Analysis, Insights and Forecast, 2019-2031
- 6.1. Market Analysis, Insights and Forecast - by Product Type
- 6.1.1. Granola/Muesli Bars
- 6.1.2. Other Bars
- 6.2. Market Analysis, Insights and Forecast - by Distribution Channel
- 6.2.1. Convenience Stores
- 6.2.2. Supermarkets/Hypermarkets
- 6.2.3. Specialty Stores
- 6.2.4. Online Retail Stores
- 6.2.5. Other Distribution Channels
- 6.1. Market Analysis, Insights and Forecast - by Product Type
- 7. Europe Cereal Bar Industry Analysis, Insights and Forecast, 2019-2031
- 7.1. Market Analysis, Insights and Forecast - by Product Type
- 7.1.1. Granola/Muesli Bars
- 7.1.2. Other Bars
- 7.2. Market Analysis, Insights and Forecast - by Distribution Channel
- 7.2.1. Convenience Stores
- 7.2.2. Supermarkets/Hypermarkets
- 7.2.3. Specialty Stores
- 7.2.4. Online Retail Stores
- 7.2.5. Other Distribution Channels
- 7.1. Market Analysis, Insights and Forecast - by Product Type
- 8. Asia Pacific Cereal Bar Industry Analysis, Insights and Forecast, 2019-2031
- 8.1. Market Analysis, Insights and Forecast - by Product Type
- 8.1.1. Granola/Muesli Bars
- 8.1.2. Other Bars
- 8.2. Market Analysis, Insights and Forecast - by Distribution Channel
- 8.2.1. Convenience Stores
- 8.2.2. Supermarkets/Hypermarkets
- 8.2.3. Specialty Stores
- 8.2.4. Online Retail Stores
- 8.2.5. Other Distribution Channels
- 8.1. Market Analysis, Insights and Forecast - by Product Type
- 9. South America Cereal Bar Industry Analysis, Insights and Forecast, 2019-2031
- 9.1. Market Analysis, Insights and Forecast - by Product Type
- 9.1.1. Granola/Muesli Bars
- 9.1.2. Other Bars
- 9.2. Market Analysis, Insights and Forecast - by Distribution Channel
- 9.2.1. Convenience Stores
- 9.2.2. Supermarkets/Hypermarkets
- 9.2.3. Specialty Stores
- 9.2.4. Online Retail Stores
- 9.2.5. Other Distribution Channels
- 9.1. Market Analysis, Insights and Forecast - by Product Type
- 10. Middle East and Africa Cereal Bar Industry Analysis, Insights and Forecast, 2019-2031
- 10.1. Market Analysis, Insights and Forecast - by Product Type
- 10.1.1. Granola/Muesli Bars
- 10.1.2. Other Bars
- 10.2. Market Analysis, Insights and Forecast - by Distribution Channel
- 10.2.1. Convenience Stores
- 10.2.2. Supermarkets/Hypermarkets
- 10.2.3. Specialty Stores
- 10.2.4. Online Retail Stores
- 10.2.5. Other Distribution Channels
- 10.1. Market Analysis, Insights and Forecast - by Product Type
- 11. North America Cereal Bar Industry Analysis, Insights and Forecast, 2019-2031
- 11.1. Market Analysis, Insights and Forecast - By Country/Sub-region
- 11.1.1 United States
- 11.1.2 Canada
- 11.1.3 Mexico
- 11.1.4 Rest of North America
- 12. Europe Cereal Bar Industry Analysis, Insights and Forecast, 2019-2031
- 12.1. Market Analysis, Insights and Forecast - By Country/Sub-region
- 12.1.1 Spain
- 12.1.2 United Kingdom
- 12.1.3 Germany
- 12.1.4 France
- 12.1.5 Italy
- 12.1.6 Netherlands
- 12.1.7 Rest of Europe
- 13. Asia Pacific Cereal Bar Industry Analysis, Insights and Forecast, 2019-2031
- 13.1. Market Analysis, Insights and Forecast - By Country/Sub-region
- 13.1.1 China
- 13.1.2 Japan
- 13.1.3 India
- 13.1.4 Australia
- 13.1.5 Rest of Asia Pacific
- 14. South America Cereal Bar Industry Analysis, Insights and Forecast, 2019-2031
- 14.1. Market Analysis, Insights and Forecast - By Country/Sub-region
- 14.1.1 Brazil
- 14.1.2 Argentina
- 14.1.3 Rest of South America
- 15. Middle East and Africa Cereal Bar Industry Analysis, Insights and Forecast, 2019-2031
- 15.1. Market Analysis, Insights and Forecast - By Country/Sub-region
- 15.1.1 South Africa
- 15.1.2 United Arab Emirates
- 15.1.3 Rest of Middle East and Africa
- 16. Competitive Analysis
- 16.1. Global Market Share Analysis 2024
- 16.2. Company Profiles
- 16.2.1 Sproutlife Foods Private Limited (Yoga Bar)
- 16.2.1.1. Overview
- 16.2.1.2. Products
- 16.2.1.3. SWOT Analysis
- 16.2.1.4. Recent Developments
- 16.2.1.5. Financials (Based on Availability)
- 16.2.2 The Kellogg Company
- 16.2.2.1. Overview
- 16.2.2.2. Products
- 16.2.2.3. SWOT Analysis
- 16.2.2.4. Recent Developments
- 16.2.2.5. Financials (Based on Availability)
- 16.2.3 Riverside Natural Foods Ltd
- 16.2.3.1. Overview
- 16.2.3.2. Products
- 16.2.3.3. SWOT Analysis
- 16.2.3.4. Recent Developments
- 16.2.3.5. Financials (Based on Availability)
- 16.2.4 General Mills Inc
- 16.2.4.1. Overview
- 16.2.4.2. Products
- 16.2.4.3. SWOT Analysis
- 16.2.4.4. Recent Developments
- 16.2.4.5. Financials (Based on Availability)
- 16.2.5 PepsiCo Inc
- 16.2.5.1. Overview
- 16.2.5.2. Products
- 16.2.5.3. SWOT Analysis
- 16.2.5.4. Recent Developments
- 16.2.5.5. Financials (Based on Availability)
- 16.2.6 Associated British Foods PLC*List Not Exhaustive
- 16.2.6.1. Overview
- 16.2.6.2. Products
- 16.2.6.3. SWOT Analysis
- 16.2.6.4. Recent Developments
- 16.2.6.5. Financials (Based on Availability)
- 16.2.7 Mars Incorporated
- 16.2.7.1. Overview
- 16.2.7.2. Products
- 16.2.7.3. SWOT Analysis
- 16.2.7.4. Recent Developments
- 16.2.7.5. Financials (Based on Availability)
- 16.2.8 Mondelēz International Inc
- 16.2.8.1. Overview
- 16.2.8.2. Products
- 16.2.8.3. SWOT Analysis
- 16.2.8.4. Recent Developments
- 16.2.8.5. Financials (Based on Availability)
- 16.2.9 NuGo Nutrition
- 16.2.9.1. Overview
- 16.2.9.2. Products
- 16.2.9.3. SWOT Analysis
- 16.2.9.4. Recent Developments
- 16.2.9.5. Financials (Based on Availability)
- 16.2.10 McKee Foods Corporation
- 16.2.10.1. Overview
- 16.2.10.2. Products
- 16.2.10.3. SWOT Analysis
- 16.2.10.4. Recent Developments
- 16.2.10.5. Financials (Based on Availability)
- 16.2.1 Sproutlife Foods Private Limited (Yoga Bar)
List of Figures
- Figure 1: Global Cereal Bar Industry Revenue Breakdown (Million, %) by Region 2024 & 2032
- Figure 2: North America Cereal Bar Industry Revenue (Million), by Country 2024 & 2032
- Figure 3: North America Cereal Bar Industry Revenue Share (%), by Country 2024 & 2032
- Figure 4: Europe Cereal Bar Industry Revenue (Million), by Country 2024 & 2032
- Figure 5: Europe Cereal Bar Industry Revenue Share (%), by Country 2024 & 2032
- Figure 6: Asia Pacific Cereal Bar Industry Revenue (Million), by Country 2024 & 2032
- Figure 7: Asia Pacific Cereal Bar Industry Revenue Share (%), by Country 2024 & 2032
- Figure 8: South America Cereal Bar Industry Revenue (Million), by Country 2024 & 2032
- Figure 9: South America Cereal Bar Industry Revenue Share (%), by Country 2024 & 2032
- Figure 10: Middle East and Africa Cereal Bar Industry Revenue (Million), by Country 2024 & 2032
- Figure 11: Middle East and Africa Cereal Bar Industry Revenue Share (%), by Country 2024 & 2032
- Figure 12: North America Cereal Bar Industry Revenue (Million), by Product Type 2024 & 2032
- Figure 13: North America Cereal Bar Industry Revenue Share (%), by Product Type 2024 & 2032
- Figure 14: North America Cereal Bar Industry Revenue (Million), by Distribution Channel 2024 & 2032
- Figure 15: North America Cereal Bar Industry Revenue Share (%), by Distribution Channel 2024 & 2032
- Figure 16: North America Cereal Bar Industry Revenue (Million), by Country 2024 & 2032
- Figure 17: North America Cereal Bar Industry Revenue Share (%), by Country 2024 & 2032
- Figure 18: Europe Cereal Bar Industry Revenue (Million), by Product Type 2024 & 2032
- Figure 19: Europe Cereal Bar Industry Revenue Share (%), by Product Type 2024 & 2032
- Figure 20: Europe Cereal Bar Industry Revenue (Million), by Distribution Channel 2024 & 2032
- Figure 21: Europe Cereal Bar Industry Revenue Share (%), by Distribution Channel 2024 & 2032
- Figure 22: Europe Cereal Bar Industry Revenue (Million), by Country 2024 & 2032
- Figure 23: Europe Cereal Bar Industry Revenue Share (%), by Country 2024 & 2032
- Figure 24: Asia Pacific Cereal Bar Industry Revenue (Million), by Product Type 2024 & 2032
- Figure 25: Asia Pacific Cereal Bar Industry Revenue Share (%), by Product Type 2024 & 2032
- Figure 26: Asia Pacific Cereal Bar Industry Revenue (Million), by Distribution Channel 2024 & 2032
- Figure 27: Asia Pacific Cereal Bar Industry Revenue Share (%), by Distribution Channel 2024 & 2032
- Figure 28: Asia Pacific Cereal Bar Industry Revenue (Million), by Country 2024 & 2032
- Figure 29: Asia Pacific Cereal Bar Industry Revenue Share (%), by Country 2024 & 2032
- Figure 30: South America Cereal Bar Industry Revenue (Million), by Product Type 2024 & 2032
- Figure 31: South America Cereal Bar Industry Revenue Share (%), by Product Type 2024 & 2032
- Figure 32: South America Cereal Bar Industry Revenue (Million), by Distribution Channel 2024 & 2032
- Figure 33: South America Cereal Bar Industry Revenue Share (%), by Distribution Channel 2024 & 2032
- Figure 34: South America Cereal Bar Industry Revenue (Million), by Country 2024 & 2032
- Figure 35: South America Cereal Bar Industry Revenue Share (%), by Country 2024 & 2032
- Figure 36: Middle East and Africa Cereal Bar Industry Revenue (Million), by Product Type 2024 & 2032
- Figure 37: Middle East and Africa Cereal Bar Industry Revenue Share (%), by Product Type 2024 & 2032
- Figure 38: Middle East and Africa Cereal Bar Industry Revenue (Million), by Distribution Channel 2024 & 2032
- Figure 39: Middle East and Africa Cereal Bar Industry Revenue Share (%), by Distribution Channel 2024 & 2032
- Figure 40: Middle East and Africa Cereal Bar Industry Revenue (Million), by Country 2024 & 2032
- Figure 41: Middle East and Africa Cereal Bar Industry Revenue Share (%), by Country 2024 & 2032
List of Tables
- Table 1: Global Cereal Bar Industry Revenue Million Forecast, by Region 2019 & 2032
- Table 2: Global Cereal Bar Industry Revenue Million Forecast, by Product Type 2019 & 2032
- Table 3: Global Cereal Bar Industry Revenue Million Forecast, by Distribution Channel 2019 & 2032
- Table 4: Global Cereal Bar Industry Revenue Million Forecast, by Region 2019 & 2032
- Table 5: Global Cereal Bar Industry Revenue Million Forecast, by Country 2019 & 2032
- Table 6: United States Cereal Bar Industry Revenue (Million) Forecast, by Application 2019 & 2032
- Table 7: Canada Cereal Bar Industry Revenue (Million) Forecast, by Application 2019 & 2032
- Table 8: Mexico Cereal Bar Industry Revenue (Million) Forecast, by Application 2019 & 2032
- Table 9: Rest of North America Cereal Bar Industry Revenue (Million) Forecast, by Application 2019 & 2032
- Table 10: Global Cereal Bar Industry Revenue Million Forecast, by Country 2019 & 2032
- Table 11: Spain Cereal Bar Industry Revenue (Million) Forecast, by Application 2019 & 2032
- Table 12: United Kingdom Cereal Bar Industry Revenue (Million) Forecast, by Application 2019 & 2032
- Table 13: Germany Cereal Bar Industry Revenue (Million) Forecast, by Application 2019 & 2032
- Table 14: France Cereal Bar Industry Revenue (Million) Forecast, by Application 2019 & 2032
- Table 15: Italy Cereal Bar Industry Revenue (Million) Forecast, by Application 2019 & 2032
- Table 16: Netherlands Cereal Bar Industry Revenue (Million) Forecast, by Application 2019 & 2032
- Table 17: Rest of Europe Cereal Bar Industry Revenue (Million) Forecast, by Application 2019 & 2032
- Table 18: Global Cereal Bar Industry Revenue Million Forecast, by Country 2019 & 2032
- Table 19: China Cereal Bar Industry Revenue (Million) Forecast, by Application 2019 & 2032
- Table 20: Japan Cereal Bar Industry Revenue (Million) Forecast, by Application 2019 & 2032
- Table 21: India Cereal Bar Industry Revenue (Million) Forecast, by Application 2019 & 2032
- Table 22: Australia Cereal Bar Industry Revenue (Million) Forecast, by Application 2019 & 2032
- Table 23: Rest of Asia Pacific Cereal Bar Industry Revenue (Million) Forecast, by Application 2019 & 2032
- Table 24: Global Cereal Bar Industry Revenue Million Forecast, by Country 2019 & 2032
- Table 25: Brazil Cereal Bar Industry Revenue (Million) Forecast, by Application 2019 & 2032
- Table 26: Argentina Cereal Bar Industry Revenue (Million) Forecast, by Application 2019 & 2032
- Table 27: Rest of South America Cereal Bar Industry Revenue (Million) Forecast, by Application 2019 & 2032
- Table 28: Global Cereal Bar Industry Revenue Million Forecast, by Country 2019 & 2032
- Table 29: South Africa Cereal Bar Industry Revenue (Million) Forecast, by Application 2019 & 2032
- Table 30: United Arab Emirates Cereal Bar Industry Revenue (Million) Forecast, by Application 2019 & 2032
- Table 31: Rest of Middle East and Africa Cereal Bar Industry Revenue (Million) Forecast, by Application 2019 & 2032
- Table 32: Global Cereal Bar Industry Revenue Million Forecast, by Product Type 2019 & 2032
- Table 33: Global Cereal Bar Industry Revenue Million Forecast, by Distribution Channel 2019 & 2032
- Table 34: Global Cereal Bar Industry Revenue Million Forecast, by Country 2019 & 2032
- Table 35: United States Cereal Bar Industry Revenue (Million) Forecast, by Application 2019 & 2032
- Table 36: Canada Cereal Bar Industry Revenue (Million) Forecast, by Application 2019 & 2032
- Table 37: Mexico Cereal Bar Industry Revenue (Million) Forecast, by Application 2019 & 2032
- Table 38: Rest of North America Cereal Bar Industry Revenue (Million) Forecast, by Application 2019 & 2032
- Table 39: Global Cereal Bar Industry Revenue Million Forecast, by Product Type 2019 & 2032
- Table 40: Global Cereal Bar Industry Revenue Million Forecast, by Distribution Channel 2019 & 2032
- Table 41: Global Cereal Bar Industry Revenue Million Forecast, by Country 2019 & 2032
- Table 42: Spain Cereal Bar Industry Revenue (Million) Forecast, by Application 2019 & 2032
- Table 43: United Kingdom Cereal Bar Industry Revenue (Million) Forecast, by Application 2019 & 2032
- Table 44: Germany Cereal Bar Industry Revenue (Million) Forecast, by Application 2019 & 2032
- Table 45: France Cereal Bar Industry Revenue (Million) Forecast, by Application 2019 & 2032
- Table 46: Italy Cereal Bar Industry Revenue (Million) Forecast, by Application 2019 & 2032
- Table 47: Netherlands Cereal Bar Industry Revenue (Million) Forecast, by Application 2019 & 2032
- Table 48: Rest of Europe Cereal Bar Industry Revenue (Million) Forecast, by Application 2019 & 2032
- Table 49: Global Cereal Bar Industry Revenue Million Forecast, by Product Type 2019 & 2032
- Table 50: Global Cereal Bar Industry Revenue Million Forecast, by Distribution Channel 2019 & 2032
- Table 51: Global Cereal Bar Industry Revenue Million Forecast, by Country 2019 & 2032
- Table 52: China Cereal Bar Industry Revenue (Million) Forecast, by Application 2019 & 2032
- Table 53: Japan Cereal Bar Industry Revenue (Million) Forecast, by Application 2019 & 2032
- Table 54: India Cereal Bar Industry Revenue (Million) Forecast, by Application 2019 & 2032
- Table 55: Australia Cereal Bar Industry Revenue (Million) Forecast, by Application 2019 & 2032
- Table 56: Rest of Asia Pacific Cereal Bar Industry Revenue (Million) Forecast, by Application 2019 & 2032
- Table 57: Global Cereal Bar Industry Revenue Million Forecast, by Product Type 2019 & 2032
- Table 58: Global Cereal Bar Industry Revenue Million Forecast, by Distribution Channel 2019 & 2032
- Table 59: Global Cereal Bar Industry Revenue Million Forecast, by Country 2019 & 2032
- Table 60: Brazil Cereal Bar Industry Revenue (Million) Forecast, by Application 2019 & 2032
- Table 61: Argentina Cereal Bar Industry Revenue (Million) Forecast, by Application 2019 & 2032
- Table 62: Rest of South America Cereal Bar Industry Revenue (Million) Forecast, by Application 2019 & 2032
- Table 63: Global Cereal Bar Industry Revenue Million Forecast, by Product Type 2019 & 2032
- Table 64: Global Cereal Bar Industry Revenue Million Forecast, by Distribution Channel 2019 & 2032
- Table 65: Global Cereal Bar Industry Revenue Million Forecast, by Country 2019 & 2032
- Table 66: South Africa Cereal Bar Industry Revenue (Million) Forecast, by Application 2019 & 2032
- Table 67: United Arab Emirates Cereal Bar Industry Revenue (Million) Forecast, by Application 2019 & 2032
- Table 68: Rest of Middle East and Africa Cereal Bar Industry Revenue (Million) Forecast, by Application 2019 & 2032
Frequently Asked Questions
1. What is the projected Compound Annual Growth Rate (CAGR) of the Cereal Bar Industry?
The projected CAGR is approximately 5.32%.
2. Which companies are prominent players in the Cereal Bar Industry?
Key companies in the market include Sproutlife Foods Private Limited (Yoga Bar), The Kellogg Company, Riverside Natural Foods Ltd, General Mills Inc, PepsiCo Inc, Associated British Foods PLC*List Not Exhaustive, Mars Incorporated, Mondelēz International Inc, NuGo Nutrition, McKee Foods Corporation.
3. What are the main segments of the Cereal Bar Industry?
The market segments include Product Type, Distribution Channel.
4. Can you provide details about the market size?
The market size is estimated to be USD 8.92 Million as of 2022.
5. What are some drivers contributing to market growth?
Popularity of On-the-Go Snacking Options; Trend Of Clean Label and Plant-Based Bars.
6. What are the notable trends driving market growth?
Rising Demand for On-the-go and Small-portion Snacking.
7. Are there any restraints impacting market growth?
Availability of Counterfeit Products.
8. Can you provide examples of recent developments in the market?
March 2024: World of Sweets partnered and collaborated with Mondelez International to grow the American-born Clif brand, supplying retailers with their products.
9. What pricing options are available for accessing the report?
Pricing options include single-user, multi-user, and enterprise licenses priced at USD 4750, USD 5250, and USD 8750 respectively.
10. Is the market size provided in terms of value or volume?
The market size is provided in terms of value, measured in Million.
11. Are there any specific market keywords associated with the report?
Yes, the market keyword associated with the report is "Cereal Bar Industry," which aids in identifying and referencing the specific market segment covered.
12. How do I determine which pricing option suits my needs best?
The pricing options vary based on user requirements and access needs. Individual users may opt for single-user licenses, while businesses requiring broader access may choose multi-user or enterprise licenses for cost-effective access to the report.
13. Are there any additional resources or data provided in the Cereal Bar Industry report?
While the report offers comprehensive insights, it's advisable to review the specific contents or supplementary materials provided to ascertain if additional resources or data are available.
14. How can I stay updated on further developments or reports in the Cereal Bar Industry?
To stay informed about further developments, trends, and reports in the Cereal Bar Industry, consider subscribing to industry newsletters, following relevant companies and organizations, or regularly checking reputable industry news sources and publications.
Methodology
Step 1 - Identification of Relevant Samples Size from Population Database


Step 2 - Approaches for Defining Global Market Size (Value, Volume* & Price*)

Note*: In applicable scenarios
Step 3 - Data Sources
Primary Research
- Web Analytics
- Survey Reports
- Research Institute
- Latest Research Reports
- Opinion Leaders
Secondary Research
- Annual Reports
- White Paper
- Latest Press Release
- Industry Association
- Paid Database
- Investor Presentations

Step 4 - Data Triangulation
Involves using different sources of information in order to increase the validity of a study
These sources are likely to be stakeholders in a program - participants, other researchers, program staff, other community members, and so on.
Then we put all data in single framework & apply various statistical tools to find out the dynamic on the market.
During the analysis stage, feedback from the stakeholder groups would be compared to determine areas of agreement as well as areas of divergence


