

Key Insights
The Asia Pacific functional water market, estimated at $11.4 billion in 2025, is projected for substantial expansion, forecasting a Compound Annual Growth Rate (CAGR) of 6.6% between 2025 and 2033. This growth is propelled by escalating consumer health consciousness across the region, driving demand for fortified beverages offering vitamins, minerals, and antioxidants. The increasing incidence of lifestyle-related health conditions and a preference for natural, low-sugar alternatives further bolster market ascent. Continuous innovation in product offerings, including novel flavors and functional ingredients, resonates with evolving consumer tastes and enhances market appeal. Distribution channels are diversifying, with online retail emerging as a significant avenue alongside traditional supermarkets and specialty stores. Despite facing challenges such as raw material price volatility and robust competition, the long-term market outlook remains optimistic, particularly in burgeoning economies like India and China, characterized by rising disposable incomes. Market segmentation indicates strong demand across various categories, with flavored functional waters anticipated to lead growth due to their broad consumer appeal.
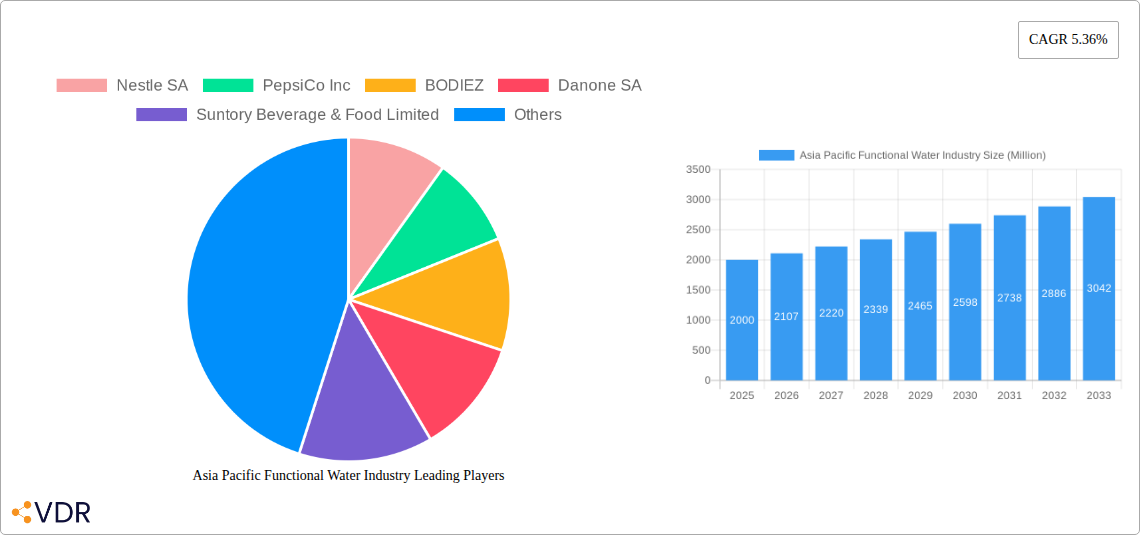
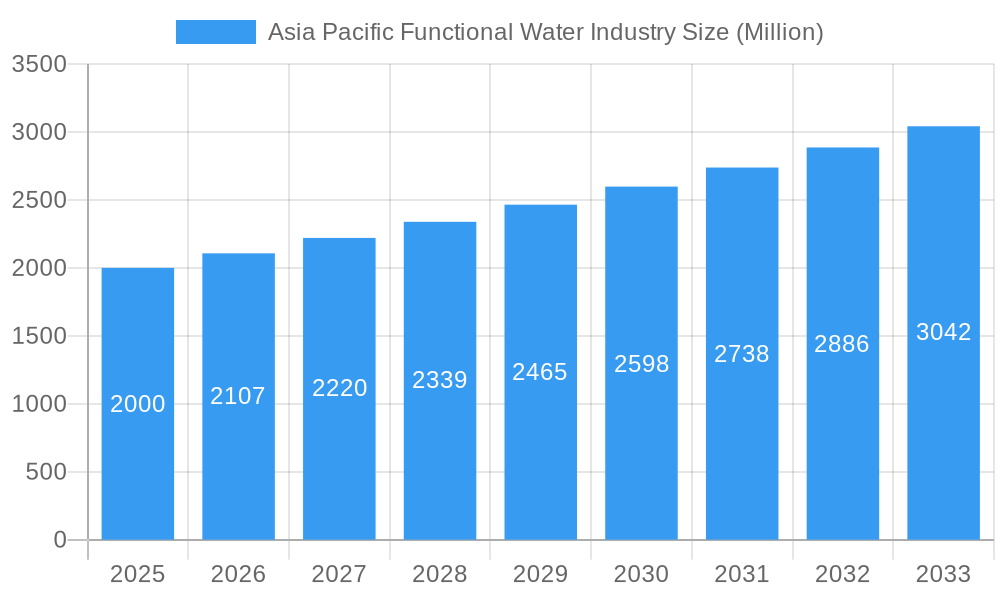
Asia Pacific Functional Water Industry Market Size (In Billion)
Key industry leaders, including Nestlé SA, PepsiCo Inc., Danone SA, Suntory Beverage & Food Limited, and The Coca-Cola Company, are actively investing in research & development, product innovation, and strategic alliances to sustain their competitive advantage. Market expansion into new Asia Pacific territories, especially Southeast Asia, offers significant growth prospects. Strategic partnerships with local entities are vital for market penetration and adapting to diverse regional consumer preferences. The market's trajectory is shaped by intricate consumer behaviors, dynamic regulatory environments, and ongoing innovation in the functional beverage sector, necessitating agile strategies from market participants to leverage emerging trends and address potential obstacles.
Asia Pacific Functional Water Industry Company Market Share
Asia Pacific Functional Water Industry: Market Report 2019-2033
This comprehensive report provides an in-depth analysis of the Asia Pacific functional water market, encompassing market dynamics, growth trends, regional dominance, product landscape, key players, and future outlook. The study covers the period 2019-2033, with a focus on the base year 2025 and a forecast period of 2025-2033. This report is essential for industry professionals, investors, and anyone seeking a detailed understanding of this rapidly evolving market. Key segments analyzed include distribution channels (supermarkets/hypermarkets, specialty stores, online stores, other) and product types (plain functional water, flavored functional water).
Asia Pacific Functional Water Industry Market Dynamics & Structure
The Asia Pacific functional water market exhibits a moderately concentrated structure, with major players like Nestle SA, PepsiCo Inc, and The Coca-Cola Company holding significant market share (estimated at xx% combined in 2025). Technological innovation, particularly in enhanced water filtration and flavoring techniques, is a key driver. Stringent regulatory frameworks concerning water purity and labeling influence market dynamics. Competition from other beverages, including sports drinks and juices, presents a challenge. End-user demographics are shifting towards health-conscious consumers, particularly millennials and Gen Z, boosting demand for functional water. M&A activity remains moderate, with xx deals recorded between 2019 and 2024.
- Market Concentration: Moderately concentrated, with top 3 players holding xx% market share (2025).
- Technological Innovation: Focus on enhanced filtration, innovative flavor profiles, and sustainable packaging.
- Regulatory Framework: Strict regulations on water purity and labeling impact product development and marketing.
- Competitive Substitutes: Sports drinks, juices, and other beverages pose competitive pressure.
- End-User Demographics: Growing health-conscious population, especially millennials and Gen Z, fuels demand.
- M&A Activity: Moderate activity, with xx deals recorded between 2019 and 2024.
Asia Pacific Functional Water Industry Growth Trends & Insights
The Asia Pacific functional water market experienced robust growth during the historical period (2019-2024), with a Compound Annual Growth Rate (CAGR) of xx%. This growth is projected to continue during the forecast period (2025-2033), albeit at a slightly moderated CAGR of xx%, reaching a market size of xx million units by 2033. Increased consumer awareness of health and wellness, coupled with rising disposable incomes in several key markets, is driving adoption rates. Technological advancements, such as the introduction of enhanced functional ingredients and innovative packaging, further contribute to market expansion. Changing consumer behavior, including a preference for healthier alternatives to sugary drinks, significantly impacts market growth. Market penetration is expected to increase from xx% in 2025 to xx% by 2033.
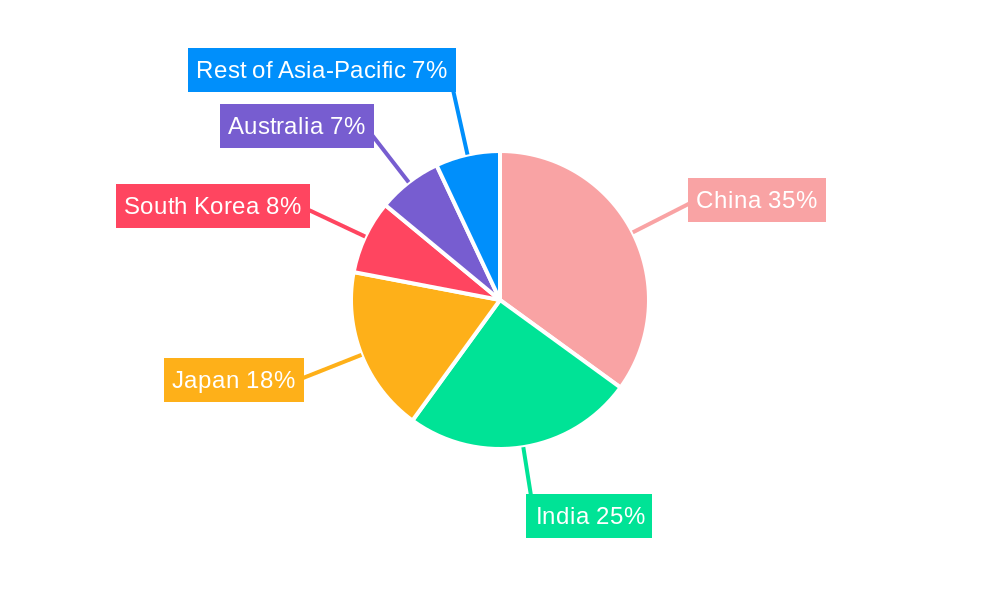
Dominant Regions, Countries, or Segments in Asia Pacific Functional Water Industry
China and India are the dominant markets within the Asia Pacific region, fueled by large populations, rising disposable incomes, and growing health consciousness. Within distribution channels, supermarkets/hypermarkets hold the largest market share, attributed to their extensive reach and established consumer base. Flavored functional water exhibits faster growth compared to plain functional water due to consumer preference for diverse taste profiles.
- Key Drivers (China & India): Large population base, rising disposable incomes, increased health awareness, expanding retail infrastructure.
- Distribution Channel Dominance: Supermarkets/hypermarkets lead with xx% market share (2025), due to wide reach and established consumer base.
- Product Type Dominance: Flavored functional water demonstrates faster growth, driven by evolving taste preferences.
- Growth Potential: Significant growth potential exists in emerging markets like Vietnam, Indonesia, and the Philippines.
Asia Pacific Functional Water Industry Product Landscape
The functional water product landscape is characterized by innovation in flavor profiles, the addition of vitamins and minerals, and sustainable packaging options. Companies are focusing on unique selling propositions like enhanced hydration benefits, improved immunity support, and natural ingredients. Technological advancements in water filtration and purification techniques ensure high-quality products.
Key Drivers, Barriers & Challenges in Asia Pacific Functional Water Industry
Key Drivers: Increasing health consciousness, growing disposable incomes, and technological advancements in flavoring and packaging are major drivers. The rising popularity of fitness and wellness trends also positively impacts market growth.
Challenges: Intense competition from established beverage companies, fluctuating raw material costs, and stringent regulatory compliance pose significant challenges. Supply chain disruptions and the need for sustainable packaging solutions add further complexity.
Emerging Opportunities in Asia Pacific Functional Water Industry
Emerging opportunities include tapping into untapped markets in Southeast Asia, developing functional water infused with novel ingredients (e.g., adaptogens), and catering to specific health needs (e.g., electrolyte replenishment). Personalized functional water offerings based on consumer preferences present a significant avenue for growth.
Growth Accelerators in the Asia Pacific Functional Water Industry
Strategic partnerships with health and wellness brands, expansion into new geographical markets, and investments in R&D for innovative product formulations are key growth accelerators. The adoption of sustainable practices in production and packaging enhances brand image and attracts environmentally conscious consumers.
Key Players Shaping the Asia Pacific Functional Water Industry Market
- Nestle SA
- PepsiCo Inc
- BODIEZ
- Danone SA
- Suntory Beverage & Food Limited
- Malaki
- The Coca-Cola Company
- Veda Beverages Private Limited
Notable Milestones in Asia Pacific Functional Water Industry Sector
- 2020: Nestle SA launches a new range of functional water with added electrolytes.
- 2022: PepsiCo Inc acquires a regional functional water brand in Indonesia.
- 2023: Suntory Beverage & Food Limited introduces sustainable packaging for its functional water products.
In-Depth Asia Pacific Functional Water Industry Market Outlook
The Asia Pacific functional water market is poised for continued growth, driven by favorable demographics, rising health awareness, and ongoing innovation. Strategic investments in product development, sustainable practices, and market expansion will be crucial for success. The market's future potential is considerable, particularly in emerging markets and segments focusing on specific health benefits.
Asia Pacific Functional Water Industry Segmentation
-
1. Product Type
- 1.1. Vitamin
- 1.2. Protein
- 1.3. Others
-
2. Distribution Channel
- 2.1. Supermarket/Hypermarket
- 2.2. Specialty Stores
- 2.3. Online Stores
- 2.4. Others
-
3. Geography
- 3.1. China
- 3.2. Japan
- 3.3. Australia
- 3.4. India
- 3.5. Rest of Asia-Pacific
Asia Pacific Functional Water Industry Segmentation By Geography
- 1. China
- 2. Japan
- 3. Australia
- 4. India
- 5. Rest of Asia Pacific
Asia Pacific Functional Water Industry Regional Market Share
Geographic Coverage of Asia Pacific Functional Water Industry
Asia Pacific Functional Water Industry REPORT HIGHLIGHTS
| Aspects | Details |
|---|---|
| Study Period | 2020-2034 |
| Base Year | 2025 |
| Estimated Year | 2026 |
| Forecast Period | 2026-2034 |
| Historical Period | 2020-2025 |
| Growth Rate | CAGR of 6.6% from 2020-2034 |
| Segmentation |
|
Table of Contents
- 1. Introduction
- 1.1. Research Scope
- 1.2. Market Segmentation
- 1.3. Research Objective
- 1.4. Definitions and Assumptions
- 2. Executive Summary
- 2.1. Market Snapshot
- 3. Market Dynamics
- 3.1. Market Drivers
- 3.2. Market Restrains
- 3.3. Market Trends
- 3.4. Market Opportunities
- 4. Market Factor Analysis
- 4.1. Porters Five Forces
- 4.1.1. Bargaining Power of Suppliers
- 4.1.2. Bargaining Power of Buyers
- 4.1.3. Threat of New Entrants
- 4.1.4. Threat of Substitutes
- 4.1.5. Competitive Rivalry
- 4.2. PESTEL analysis
- 4.3. BCG Analysis
- 4.3.1. Stars (High Growth, High Market Share)
- 4.3.2. Cash Cows (Low Growth, High Market Share)
- 4.3.3. Question Mark (High Growth, Low Market Share)
- 4.3.4. Dogs (Low Growth, Low Market Share)
- 4.4. Ansoff Matrix Analysis
- 4.5. Supply Chain Analysis
- 4.6. Regulatory Landscape
- 4.7. Current Market Potential and Opportunity Assessment (TAM–SAM–SOM Framework)
- 4.8. VDR Analyst Note
- 4.1. Porters Five Forces
- 5. Market Analysis, Insights and Forecast 2021-2033
- 5.1. Market Analysis, Insights and Forecast - by Product Type
- 5.1.1. Vitamin
- 5.1.2. Protein
- 5.1.3. Others
- 5.2. Market Analysis, Insights and Forecast - by Distribution Channel
- 5.2.1. Supermarket/Hypermarket
- 5.2.2. Specialty Stores
- 5.2.3. Online Stores
- 5.2.4. Others
- 5.3. Market Analysis, Insights and Forecast - by Geography
- 5.3.1. China
- 5.3.2. Japan
- 5.3.3. Australia
- 5.3.4. India
- 5.3.5. Rest of Asia-Pacific
- 5.4. Market Analysis, Insights and Forecast - by Region
- 5.4.1. China
- 5.4.2. Japan
- 5.4.3. Australia
- 5.4.4. India
- 5.4.5. Rest of Asia Pacific
- 5.1. Market Analysis, Insights and Forecast - by Product Type
- 6. Asia Pacific Functional Water Industry Analysis, Insights and Forecast, 2021-2033
- 6.1. Market Analysis, Insights and Forecast - by Product Type
- 6.1.1. Vitamin
- 6.1.2. Protein
- 6.1.3. Others
- 6.2. Market Analysis, Insights and Forecast - by Distribution Channel
- 6.2.1. Supermarket/Hypermarket
- 6.2.2. Specialty Stores
- 6.2.3. Online Stores
- 6.2.4. Others
- 6.3. Market Analysis, Insights and Forecast - by Geography
- 6.3.1. China
- 6.3.2. Japan
- 6.3.3. Australia
- 6.3.4. India
- 6.3.5. Rest of Asia-Pacific
- 6.1. Market Analysis, Insights and Forecast - by Product Type
- 7. China Asia Pacific Functional Water Industry Analysis, Insights and Forecast, 2021-2033
- 7.1. Market Analysis, Insights and Forecast - by Product Type
- 7.1.1. Vitamin
- 7.1.2. Protein
- 7.1.3. Others
- 7.2. Market Analysis, Insights and Forecast - by Distribution Channel
- 7.2.1. Supermarket/Hypermarket
- 7.2.2. Specialty Stores
- 7.2.3. Online Stores
- 7.2.4. Others
- 7.3. Market Analysis, Insights and Forecast - by Geography
- 7.3.1. China
- 7.3.2. Japan
- 7.3.3. Australia
- 7.3.4. India
- 7.3.5. Rest of Asia-Pacific
- 7.1. Market Analysis, Insights and Forecast - by Product Type
- 8. Japan Asia Pacific Functional Water Industry Analysis, Insights and Forecast, 2021-2033
- 8.1. Market Analysis, Insights and Forecast - by Product Type
- 8.1.1. Vitamin
- 8.1.2. Protein
- 8.1.3. Others
- 8.2. Market Analysis, Insights and Forecast - by Distribution Channel
- 8.2.1. Supermarket/Hypermarket
- 8.2.2. Specialty Stores
- 8.2.3. Online Stores
- 8.2.4. Others
- 8.3. Market Analysis, Insights and Forecast - by Geography
- 8.3.1. China
- 8.3.2. Japan
- 8.3.3. Australia
- 8.3.4. India
- 8.3.5. Rest of Asia-Pacific
- 8.1. Market Analysis, Insights and Forecast - by Product Type
- 9. Australia Asia Pacific Functional Water Industry Analysis, Insights and Forecast, 2021-2033
- 9.1. Market Analysis, Insights and Forecast - by Product Type
- 9.1.1. Vitamin
- 9.1.2. Protein
- 9.1.3. Others
- 9.2. Market Analysis, Insights and Forecast - by Distribution Channel
- 9.2.1. Supermarket/Hypermarket
- 9.2.2. Specialty Stores
- 9.2.3. Online Stores
- 9.2.4. Others
- 9.3. Market Analysis, Insights and Forecast - by Geography
- 9.3.1. China
- 9.3.2. Japan
- 9.3.3. Australia
- 9.3.4. India
- 9.3.5. Rest of Asia-Pacific
- 9.1. Market Analysis, Insights and Forecast - by Product Type
- 10. India Asia Pacific Functional Water Industry Analysis, Insights and Forecast, 2021-2033
- 10.1. Market Analysis, Insights and Forecast - by Product Type
- 10.1.1. Vitamin
- 10.1.2. Protein
- 10.1.3. Others
- 10.2. Market Analysis, Insights and Forecast - by Distribution Channel
- 10.2.1. Supermarket/Hypermarket
- 10.2.2. Specialty Stores
- 10.2.3. Online Stores
- 10.2.4. Others
- 10.3. Market Analysis, Insights and Forecast - by Geography
- 10.3.1. China
- 10.3.2. Japan
- 10.3.3. Australia
- 10.3.4. India
- 10.3.5. Rest of Asia-Pacific
- 10.1. Market Analysis, Insights and Forecast - by Product Type
- 11. Rest of Asia Pacific Asia Pacific Functional Water Industry Analysis, Insights and Forecast, 2021-2033
- 11.1. Market Analysis, Insights and Forecast - by Product Type
- 11.1.1. Vitamin
- 11.1.2. Protein
- 11.1.3. Others
- 11.2. Market Analysis, Insights and Forecast - by Distribution Channel
- 11.2.1. Supermarket/Hypermarket
- 11.2.2. Specialty Stores
- 11.2.3. Online Stores
- 11.2.4. Others
- 11.3. Market Analysis, Insights and Forecast - by Geography
- 11.3.1. China
- 11.3.2. Japan
- 11.3.3. Australia
- 11.3.4. India
- 11.3.5. Rest of Asia-Pacific
- 11.1. Market Analysis, Insights and Forecast - by Product Type
- 12. Competitive Analysis
- 12.1. Company Profiles
- 12.1.1 Nestle SA
- 12.1.1.1. Company Overview
- 12.1.1.2. Products
- 12.1.1.3. Company Financials
- 12.1.1.4. SWOT Analysis
- 12.1.2 PepsiCo Inc
- 12.1.2.1. Company Overview
- 12.1.2.2. Products
- 12.1.2.3. Company Financials
- 12.1.2.4. SWOT Analysis
- 12.1.3 BODIEZ
- 12.1.3.1. Company Overview
- 12.1.3.2. Products
- 12.1.3.3. Company Financials
- 12.1.3.4. SWOT Analysis
- 12.1.4 Danone SA
- 12.1.4.1. Company Overview
- 12.1.4.2. Products
- 12.1.4.3. Company Financials
- 12.1.4.4. SWOT Analysis
- 12.1.5 Suntory Beverage & Food Limited
- 12.1.5.1. Company Overview
- 12.1.5.2. Products
- 12.1.5.3. Company Financials
- 12.1.5.4. SWOT Analysis
- 12.1.6 Malaki
- 12.1.6.1. Company Overview
- 12.1.6.2. Products
- 12.1.6.3. Company Financials
- 12.1.6.4. SWOT Analysis
- 12.1.7 The Coca-Cola Company
- 12.1.7.1. Company Overview
- 12.1.7.2. Products
- 12.1.7.3. Company Financials
- 12.1.7.4. SWOT Analysis
- 12.1.8 Veda Beverages Private Limited
- 12.1.8.1. Company Overview
- 12.1.8.2. Products
- 12.1.8.3. Company Financials
- 12.1.8.4. SWOT Analysis
- 12.1.1 Nestle SA
- 12.2. Market Entropy
- 12.2.1 Company's Key Areas Served
- 12.2.2 Recent Developments
- 12.3. Company Market Share Analysis 2025
- 12.3.1 Top 5 Companies Market Share Analysis
- 12.3.2 Top 3 Companies Market Share Analysis
- 12.4. List of Potential Customers
- 13. Research Methodology
List of Figures
- Figure 1: Asia Pacific Functional Water Industry Revenue Breakdown (billion, %) by Product 2025 & 2033
- Figure 2: Asia Pacific Functional Water Industry Share (%) by Company 2025
List of Tables
- Table 1: Asia Pacific Functional Water Industry Revenue billion Forecast, by Product Type 2020 & 2033
- Table 2: Asia Pacific Functional Water Industry Volume K Litres Forecast, by Product Type 2020 & 2033
- Table 3: Asia Pacific Functional Water Industry Revenue billion Forecast, by Distribution Channel 2020 & 2033
- Table 4: Asia Pacific Functional Water Industry Volume K Litres Forecast, by Distribution Channel 2020 & 2033
- Table 5: Asia Pacific Functional Water Industry Revenue billion Forecast, by Geography 2020 & 2033
- Table 6: Asia Pacific Functional Water Industry Volume K Litres Forecast, by Geography 2020 & 2033
- Table 7: Asia Pacific Functional Water Industry Revenue billion Forecast, by Region 2020 & 2033
- Table 8: Asia Pacific Functional Water Industry Volume K Litres Forecast, by Region 2020 & 2033
- Table 9: Asia Pacific Functional Water Industry Revenue billion Forecast, by Product Type 2020 & 2033
- Table 10: Asia Pacific Functional Water Industry Volume K Litres Forecast, by Product Type 2020 & 2033
- Table 11: Asia Pacific Functional Water Industry Revenue billion Forecast, by Distribution Channel 2020 & 2033
- Table 12: Asia Pacific Functional Water Industry Volume K Litres Forecast, by Distribution Channel 2020 & 2033
- Table 13: Asia Pacific Functional Water Industry Revenue billion Forecast, by Geography 2020 & 2033
- Table 14: Asia Pacific Functional Water Industry Volume K Litres Forecast, by Geography 2020 & 2033
- Table 15: Asia Pacific Functional Water Industry Revenue billion Forecast, by Country 2020 & 2033
- Table 16: Asia Pacific Functional Water Industry Volume K Litres Forecast, by Country 2020 & 2033
- Table 17: Asia Pacific Functional Water Industry Revenue billion Forecast, by Product Type 2020 & 2033
- Table 18: Asia Pacific Functional Water Industry Volume K Litres Forecast, by Product Type 2020 & 2033
- Table 19: Asia Pacific Functional Water Industry Revenue billion Forecast, by Distribution Channel 2020 & 2033
- Table 20: Asia Pacific Functional Water Industry Volume K Litres Forecast, by Distribution Channel 2020 & 2033
- Table 21: Asia Pacific Functional Water Industry Revenue billion Forecast, by Geography 2020 & 2033
- Table 22: Asia Pacific Functional Water Industry Volume K Litres Forecast, by Geography 2020 & 2033
- Table 23: Asia Pacific Functional Water Industry Revenue billion Forecast, by Country 2020 & 2033
- Table 24: Asia Pacific Functional Water Industry Volume K Litres Forecast, by Country 2020 & 2033
- Table 25: Asia Pacific Functional Water Industry Revenue billion Forecast, by Product Type 2020 & 2033
- Table 26: Asia Pacific Functional Water Industry Volume K Litres Forecast, by Product Type 2020 & 2033
- Table 27: Asia Pacific Functional Water Industry Revenue billion Forecast, by Distribution Channel 2020 & 2033
- Table 28: Asia Pacific Functional Water Industry Volume K Litres Forecast, by Distribution Channel 2020 & 2033
- Table 29: Asia Pacific Functional Water Industry Revenue billion Forecast, by Geography 2020 & 2033
- Table 30: Asia Pacific Functional Water Industry Volume K Litres Forecast, by Geography 2020 & 2033
- Table 31: Asia Pacific Functional Water Industry Revenue billion Forecast, by Country 2020 & 2033
- Table 32: Asia Pacific Functional Water Industry Volume K Litres Forecast, by Country 2020 & 2033
- Table 33: Asia Pacific Functional Water Industry Revenue billion Forecast, by Product Type 2020 & 2033
- Table 34: Asia Pacific Functional Water Industry Volume K Litres Forecast, by Product Type 2020 & 2033
- Table 35: Asia Pacific Functional Water Industry Revenue billion Forecast, by Distribution Channel 2020 & 2033
- Table 36: Asia Pacific Functional Water Industry Volume K Litres Forecast, by Distribution Channel 2020 & 2033
- Table 37: Asia Pacific Functional Water Industry Revenue billion Forecast, by Geography 2020 & 2033
- Table 38: Asia Pacific Functional Water Industry Volume K Litres Forecast, by Geography 2020 & 2033
- Table 39: Asia Pacific Functional Water Industry Revenue billion Forecast, by Country 2020 & 2033
- Table 40: Asia Pacific Functional Water Industry Volume K Litres Forecast, by Country 2020 & 2033
- Table 41: Asia Pacific Functional Water Industry Revenue billion Forecast, by Product Type 2020 & 2033
- Table 42: Asia Pacific Functional Water Industry Volume K Litres Forecast, by Product Type 2020 & 2033
- Table 43: Asia Pacific Functional Water Industry Revenue billion Forecast, by Distribution Channel 2020 & 2033
- Table 44: Asia Pacific Functional Water Industry Volume K Litres Forecast, by Distribution Channel 2020 & 2033
- Table 45: Asia Pacific Functional Water Industry Revenue billion Forecast, by Geography 2020 & 2033
- Table 46: Asia Pacific Functional Water Industry Volume K Litres Forecast, by Geography 2020 & 2033
- Table 47: Asia Pacific Functional Water Industry Revenue billion Forecast, by Country 2020 & 2033
- Table 48: Asia Pacific Functional Water Industry Volume K Litres Forecast, by Country 2020 & 2033
Frequently Asked Questions
1. What is the projected Compound Annual Growth Rate (CAGR) of the Asia Pacific Functional Water Industry?
The projected CAGR is approximately 6.6%.
2. Which companies are prominent players in the Asia Pacific Functional Water Industry?
Key companies in the market include Nestle SA, PepsiCo Inc, BODIEZ, Danone SA, Suntory Beverage & Food Limited, Malaki, The Coca-Cola Company, Veda Beverages Private Limited.
3. What are the main segments of the Asia Pacific Functional Water Industry?
The market segments include Product Type, Distribution Channel, Geography.
4. Can you provide details about the market size?
The market size is estimated to be USD 11.4 billion as of 2022.
5. What are some drivers contributing to market growth?
Increasing awareness of health and wellness drives demand for functional waters.
6. What are the notable trends driving market growth?
Growing preference for functional waters with clean labels and natural ingredients.
7. Are there any restraints impacting market growth?
High Production Costs.
8. Can you provide examples of recent developments in the market?
N/A
9. What pricing options are available for accessing the report?
Pricing options include single-user, multi-user, and enterprise licenses priced at USD 4750, USD 5250, and USD 8750 respectively.
10. Is the market size provided in terms of value or volume?
The market size is provided in terms of value, measured in billion and volume, measured in K Litres.
11. Are there any specific market keywords associated with the report?
Yes, the market keyword associated with the report is "Asia Pacific Functional Water Industry," which aids in identifying and referencing the specific market segment covered.
12. How do I determine which pricing option suits my needs best?
The pricing options vary based on user requirements and access needs. Individual users may opt for single-user licenses, while businesses requiring broader access may choose multi-user or enterprise licenses for cost-effective access to the report.
13. Are there any additional resources or data provided in the Asia Pacific Functional Water Industry report?
While the report offers comprehensive insights, it's advisable to review the specific contents or supplementary materials provided to ascertain if additional resources or data are available.
14. How can I stay updated on further developments or reports in the Asia Pacific Functional Water Industry?
To stay informed about further developments, trends, and reports in the Asia Pacific Functional Water Industry, consider subscribing to industry newsletters, following relevant companies and organizations, or regularly checking reputable industry news sources and publications.
Methodology
Step 1 - Identification of Relevant Samples Size from Population Database


Step 2 - Approaches for Defining Global Market Size (Value, Volume* & Price*)

Note*: In applicable scenarios
Step 3 - Data Sources
Primary Research
- Web Analytics
- Survey Reports
- Research Institute
- Latest Research Reports
- Opinion Leaders
Secondary Research
- Annual Reports
- White Paper
- Latest Press Release
- Industry Association
- Paid Database
- Investor Presentations

Step 4 - Data Triangulation
Involves using different sources of information in order to increase the validity of a study
These sources are likely to be stakeholders in a program - participants, other researchers, program staff, other community members, and so on.
Then we put all data in single framework & apply various statistical tools to find out the dynamic on the market.
During the analysis stage, feedback from the stakeholder groups would be compared to determine areas of agreement as well as areas of divergence