
Key Insights
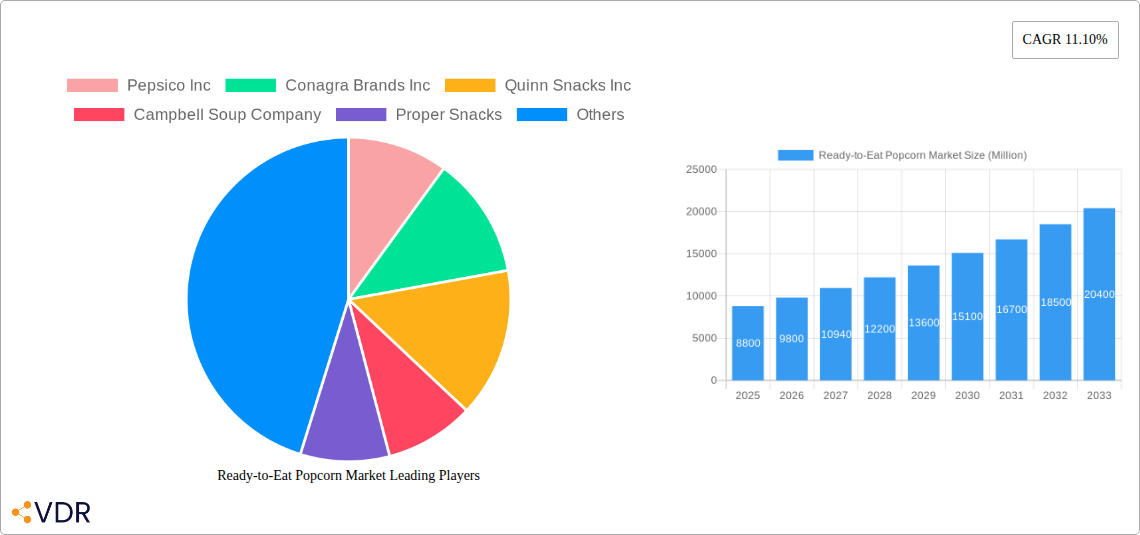
The ready-to-eat (RTE) popcorn market, valued at $8.80 billion in 2025, is projected to experience robust growth, driven by several key factors. The increasing popularity of convenient snack options among health-conscious consumers fuels demand for RTE popcorn, particularly those with reduced fat and healthier flavor profiles. Rising disposable incomes, especially in developing economies within Asia-Pacific and South America, further contribute to market expansion. The shift towards online retail channels offers significant growth opportunities, providing direct access to a wider consumer base. Furthermore, innovative product launches, such as gourmet popcorn varieties with unique flavors and textures, cater to evolving consumer preferences and drive premiumization within the market. Strategic partnerships between established snack food companies and smaller, specialty popcorn brands are also contributing to the market's dynamism.
However, the market faces certain challenges. Fluctuations in raw material prices (corn) can impact profitability. Intense competition from other snack food categories, like potato chips and pretzels, necessitates continuous product innovation and effective marketing strategies. Concerns regarding high sodium content and potential health risks associated with excessive popcorn consumption necessitate the development and promotion of healthier options. Despite these challenges, the overall market outlook remains positive, with projected compound annual growth rate (CAGR) of 11.10% from 2025 to 2033. This growth is anticipated to be predominantly driven by expanding consumer demand in emerging markets and the continuous adaptation of products to meet changing consumer preferences for healthier and more convenient snacking options.
Ready-to-Eat Popcorn Market: A Comprehensive Market Report (2019-2033)
This comprehensive report provides an in-depth analysis of the Ready-to-Eat Popcorn market, encompassing its dynamics, growth trends, dominant segments, and key players. The study period covers 2019-2033, with 2025 as the base and estimated year, and a forecast period of 2025-2033. The report is a valuable resource for industry professionals, investors, and anyone seeking a thorough understanding of this dynamic market. The snack food market, encompassing both the parent market of snacks and the child market of ready-to-eat popcorn, is experiencing significant growth, driven by changing consumer preferences and innovation.
Ready-to-Eat Popcorn Market Dynamics & Structure
This section analyzes the competitive landscape, technological advancements, regulatory influences, and market trends impacting the Ready-to-Eat Popcorn market. The market exhibits moderate concentration, with key players such as PepsiCo Inc, Conagra Brands Inc, and others holding significant market share (xx%).
- Market Concentration: Moderate, with top 5 players holding approximately xx% of the market share in 2024.
- Technological Innovation: Focus on flavor innovation, healthier options (e.g., reduced sodium, organic), and improved packaging for extended shelf life.
- Regulatory Frameworks: Food safety regulations and labeling requirements significantly impact market operations.
- Competitive Substitutes: Other snack foods (chips, pretzels) compete for consumer spending.
- End-User Demographics: Young adults and families are key consumer segments, driven by convenience and portability.
- M&A Trends: Consolidation is expected, with larger companies acquiring smaller, specialized popcorn brands (xx M&A deals in the last 5 years).
Ready-to-Eat Popcorn Market Growth Trends & Insights
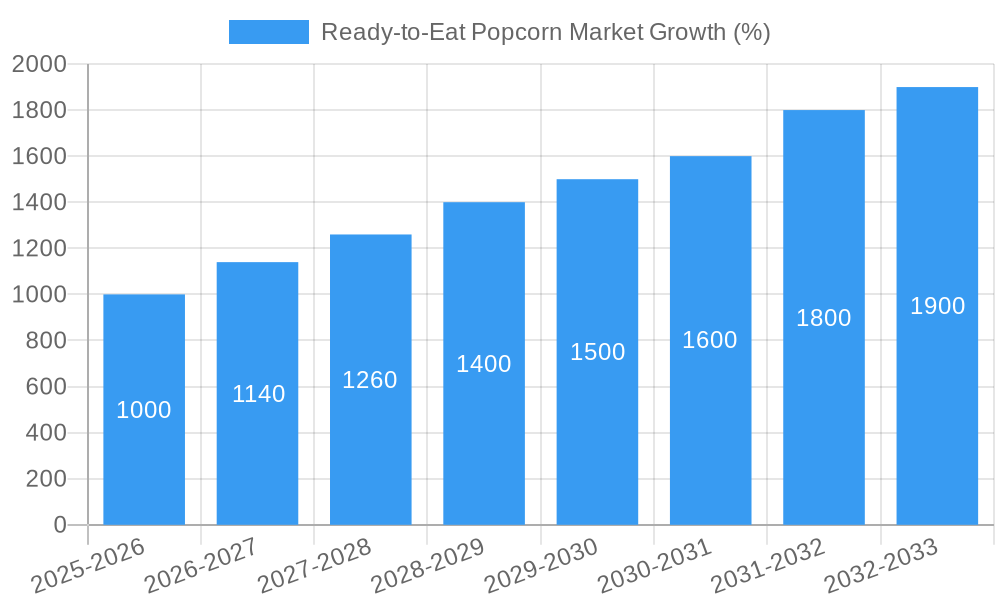
The Ready-to-Eat Popcorn market has witnessed robust growth over the historical period (2019-2024). The market size was valued at xx million units in 2024 and is projected to reach xx million units by 2033, exhibiting a CAGR of xx% during the forecast period (2025-2033). This growth is attributed to several factors including the rising demand for convenient snack options, increased disposable incomes in key markets, and the introduction of innovative flavors and healthier alternatives. Technological advancements, such as improved processing techniques and packaging solutions, have also contributed to this expansion. Consumer behavior shifts toward healthier and more convenient snacking options are fueling the market's expansion. Market penetration is currently at approximately xx% in developed markets and is expected to increase in emerging markets.
Dominant Regions, Countries, or Segments in Ready-to-Eat Popcorn Market
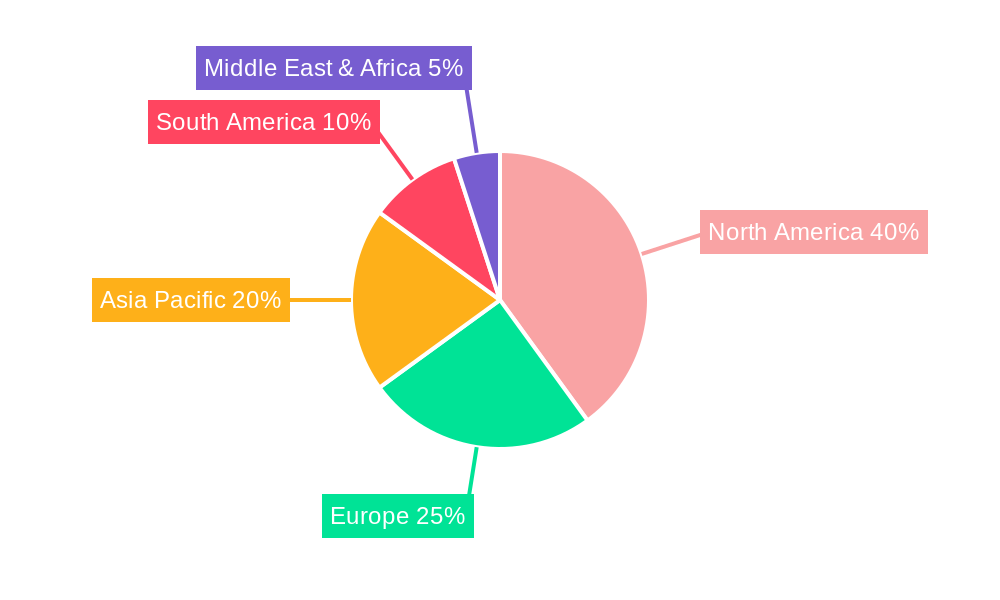
North America currently holds the largest market share in the Ready-to-Eat Popcorn market due to high consumption rates and established distribution networks. The Ready-to-Eat (RTE) popcorn segment dominates over microwave popcorn due to convenience and immediate consumption. Hypermarkets/supermarkets are the leading distribution channel, followed by convenience stores and online retail stores.
- Key Regional Drivers: Strong consumer demand in North America and Europe. Emerging markets in Asia-Pacific show significant growth potential.
- Leading Distribution Channel: Hypermarkets/supermarkets (xx% market share in 2024).
- Dominant Segment: Ready-to-Eat (RTE) Popcorn (xx% market share in 2024).
- Growth Potential: Untapped markets in developing countries and the increasing popularity of online retail offer considerable growth opportunities.
Ready-to-Eat Popcorn Market Product Landscape
The Ready-to-Eat Popcorn market offers a diverse range of products catering to different consumer preferences. Innovations focus on unique flavor profiles (e.g., spicy, sweet, gourmet), healthier options (e.g., organic, low-sodium), and convenient packaging formats. Product differentiation is a key competitive strategy, with companies emphasizing unique selling propositions such as organic ingredients, specific flavor combinations, and sustainable packaging. Technological advancements in processing and packaging enable the creation of enhanced products with extended shelf life and improved texture.
Key Drivers, Barriers & Challenges in Ready-to-Eat Popcorn Market
Key Drivers:
- Increasing demand for convenient snack options.
- Growing popularity of healthy and organic snack choices.
- Product innovation and new flavor introductions.
Challenges & Restraints:
- Price fluctuations in raw materials (corn).
- Intense competition among established brands and new entrants.
- Maintaining product quality and freshness during distribution. Supply chain disruptions can negatively impact sales (estimated xx% impact during 2020-2021).
Emerging Opportunities in Ready-to-Eat Popcorn Market
- Expansion into emerging markets.
- Development of novel flavors and product formulations (e.g., protein-enhanced popcorn).
- Growing demand for sustainable and ethically sourced popcorn.
- Increased adoption of online retail channels.
Growth Accelerators in the Ready-to-Eat Popcorn Market Industry
The Ready-to-Eat Popcorn market is poised for continued growth, driven by strategic partnerships between established snack food companies and innovative smaller brands. Technological advancements in flavor development and healthier ingredient sourcing, coupled with efficient supply chain management, will further accelerate market expansion. Aggressive marketing campaigns targeting specific consumer segments and increased penetration into emerging markets are key growth drivers.
Key Players Shaping the Ready-to-Eat Popcorn Market Market
- PepsiCo Inc
- Conagra Brands Inc
- Quinn Snacks Inc
- Campbell Soup Company
- Proper Snacks
- Weaver Popcorn Bulk LLC
- Eagle Family Foods Group LLC
- Intersnack Group GmbH & Co KG
- Hain Celestial
- The Hershey Company
Notable Milestones in Ready-to-Eat Popcorn Market Sector
- November 2022: University of Nebraska and Conagra Brands collaborate on developing high-lysine popcorn.
- September 2022: General Mills launches Trix Popcorn, expanding its brand into the snack food market.
- January 2021: PepsiCo introduces Cheetos-flavored ready-to-eat popcorn.
In-Depth Ready-to-Eat Popcorn Market Outlook
The Ready-to-Eat Popcorn market presents significant growth potential driven by evolving consumer preferences and innovative product development. Strategic partnerships, efficient supply chain management, and effective marketing strategies will be crucial for success. Companies focusing on healthy and sustainable options, as well as those leveraging online retail channels, are positioned for strong growth in the coming years. The market is expected to show continued expansion, driven by both established brands and innovative new entrants.
Ready-to-Eat Popcorn Market Segmentation
-
1. Type
- 1.1. Microwave Popcorn
- 1.2. Ready-to-Eat (RTE) Popcorn
-
2. Distribution Channel
- 2.1. Hypermarkets/Supermarkets
- 2.2. Convenience Stores
- 2.3. Online Retail Stores
- 2.4. Other Distribution Channels
Ready-to-Eat Popcorn Market Segmentation By Geography
-
1. North America
- 1.1. United States
- 1.2. Canada
- 1.3. Mexico
- 1.4. Rest of North America
-
2. Europe
- 2.1. United Kingdom
- 2.2. Germany
- 2.3. Spain
- 2.4. France
- 2.5. Italy
- 2.6. Russia
- 2.7. Rest of Europe
-
3. Asia Pacific
- 3.1. China
- 3.2. Japan
- 3.3. India
- 3.4. Australia
- 3.5. Rest of Asia Pacific
-
4. South America
- 4.1. Brazil
- 4.2. Argentina
- 4.3. Rest of South America
- 5. Middle East
-
6. United Arab Emirates
- 6.1. South Africa
- 6.2. Rest of Middle East
Ready-to-Eat Popcorn Market REPORT HIGHLIGHTS
| Aspects | Details |
|---|---|
| Study Period | 2019-2033 |
| Base Year | 2024 |
| Estimated Year | 2025 |
| Forecast Period | 2025-2033 |
| Historical Period | 2019-2024 |
| Growth Rate | CAGR of 11.10% from 2019-2033 |
| Segmentation |
|
Table of Contents
- 1. Introduction
- 1.1. Research Scope
- 1.2. Market Segmentation
- 1.3. Research Methodology
- 1.4. Definitions and Assumptions
- 2. Executive Summary
- 2.1. Introduction
- 3. Market Dynamics
- 3.1. Introduction
- 3.2. Market Drivers
- 3.2.1. Rising Demand for Convenient Snacking Options; Increase in Demand for New and Innovative Flavored Meat Snacks
- 3.3. Market Restrains
- 3.3.1. Fluctuations in the Price of Raw Materials
- 3.4. Market Trends
- 3.4.1. Innovation in Flavor driving the market
- 4. Market Factor Analysis
- 4.1. Porters Five Forces
- 4.2. Supply/Value Chain
- 4.3. PESTEL analysis
- 4.4. Market Entropy
- 4.5. Patent/Trademark Analysis
- 5. Global Ready-to-Eat Popcorn Market Analysis, Insights and Forecast, 2019-2031
- 5.1. Market Analysis, Insights and Forecast - by Type
- 5.1.1. Microwave Popcorn
- 5.1.2. Ready-to-Eat (RTE) Popcorn
- 5.2. Market Analysis, Insights and Forecast - by Distribution Channel
- 5.2.1. Hypermarkets/Supermarkets
- 5.2.2. Convenience Stores
- 5.2.3. Online Retail Stores
- 5.2.4. Other Distribution Channels
- 5.3. Market Analysis, Insights and Forecast - by Region
- 5.3.1. North America
- 5.3.2. Europe
- 5.3.3. Asia Pacific
- 5.3.4. South America
- 5.3.5. Middle East
- 5.3.6. United Arab Emirates
- 5.1. Market Analysis, Insights and Forecast - by Type
- 6. North America Ready-to-Eat Popcorn Market Analysis, Insights and Forecast, 2019-2031
- 6.1. Market Analysis, Insights and Forecast - by Type
- 6.1.1. Microwave Popcorn
- 6.1.2. Ready-to-Eat (RTE) Popcorn
- 6.2. Market Analysis, Insights and Forecast - by Distribution Channel
- 6.2.1. Hypermarkets/Supermarkets
- 6.2.2. Convenience Stores
- 6.2.3. Online Retail Stores
- 6.2.4. Other Distribution Channels
- 6.1. Market Analysis, Insights and Forecast - by Type
- 7. Europe Ready-to-Eat Popcorn Market Analysis, Insights and Forecast, 2019-2031
- 7.1. Market Analysis, Insights and Forecast - by Type
- 7.1.1. Microwave Popcorn
- 7.1.2. Ready-to-Eat (RTE) Popcorn
- 7.2. Market Analysis, Insights and Forecast - by Distribution Channel
- 7.2.1. Hypermarkets/Supermarkets
- 7.2.2. Convenience Stores
- 7.2.3. Online Retail Stores
- 7.2.4. Other Distribution Channels
- 7.1. Market Analysis, Insights and Forecast - by Type
- 8. Asia Pacific Ready-to-Eat Popcorn Market Analysis, Insights and Forecast, 2019-2031
- 8.1. Market Analysis, Insights and Forecast - by Type
- 8.1.1. Microwave Popcorn
- 8.1.2. Ready-to-Eat (RTE) Popcorn
- 8.2. Market Analysis, Insights and Forecast - by Distribution Channel
- 8.2.1. Hypermarkets/Supermarkets
- 8.2.2. Convenience Stores
- 8.2.3. Online Retail Stores
- 8.2.4. Other Distribution Channels
- 8.1. Market Analysis, Insights and Forecast - by Type
- 9. South America Ready-to-Eat Popcorn Market Analysis, Insights and Forecast, 2019-2031
- 9.1. Market Analysis, Insights and Forecast - by Type
- 9.1.1. Microwave Popcorn
- 9.1.2. Ready-to-Eat (RTE) Popcorn
- 9.2. Market Analysis, Insights and Forecast - by Distribution Channel
- 9.2.1. Hypermarkets/Supermarkets
- 9.2.2. Convenience Stores
- 9.2.3. Online Retail Stores
- 9.2.4. Other Distribution Channels
- 9.1. Market Analysis, Insights and Forecast - by Type
- 10. Middle East Ready-to-Eat Popcorn Market Analysis, Insights and Forecast, 2019-2031
- 10.1. Market Analysis, Insights and Forecast - by Type
- 10.1.1. Microwave Popcorn
- 10.1.2. Ready-to-Eat (RTE) Popcorn
- 10.2. Market Analysis, Insights and Forecast - by Distribution Channel
- 10.2.1. Hypermarkets/Supermarkets
- 10.2.2. Convenience Stores
- 10.2.3. Online Retail Stores
- 10.2.4. Other Distribution Channels
- 10.1. Market Analysis, Insights and Forecast - by Type
- 11. United Arab Emirates Ready-to-Eat Popcorn Market Analysis, Insights and Forecast, 2019-2031
- 11.1. Market Analysis, Insights and Forecast - by Type
- 11.1.1. Microwave Popcorn
- 11.1.2. Ready-to-Eat (RTE) Popcorn
- 11.2. Market Analysis, Insights and Forecast - by Distribution Channel
- 11.2.1. Hypermarkets/Supermarkets
- 11.2.2. Convenience Stores
- 11.2.3. Online Retail Stores
- 11.2.4. Other Distribution Channels
- 11.1. Market Analysis, Insights and Forecast - by Type
- 12. North America Ready-to-Eat Popcorn Market Analysis, Insights and Forecast, 2019-2031
- 12.1. Market Analysis, Insights and Forecast - By Country/Sub-region
- 12.1.1 United States
- 12.1.2 Canada
- 12.1.3 Mexico
- 12.1.4 Rest of North America
- 13. Europe Ready-to-Eat Popcorn Market Analysis, Insights and Forecast, 2019-2031
- 13.1. Market Analysis, Insights and Forecast - By Country/Sub-region
- 13.1.1 United Kingdom
- 13.1.2 Germany
- 13.1.3 Spain
- 13.1.4 France
- 13.1.5 Italy
- 13.1.6 Russia
- 13.1.7 Rest of Europe
- 14. Asia Pacific Ready-to-Eat Popcorn Market Analysis, Insights and Forecast, 2019-2031
- 14.1. Market Analysis, Insights and Forecast - By Country/Sub-region
- 14.1.1 China
- 14.1.2 Japan
- 14.1.3 India
- 14.1.4 Australia
- 14.1.5 Rest of Asia Pacific
- 15. South America Ready-to-Eat Popcorn Market Analysis, Insights and Forecast, 2019-2031
- 15.1. Market Analysis, Insights and Forecast - By Country/Sub-region
- 15.1.1 Brazil
- 15.1.2 Argentina
- 15.1.3 Rest of South America
- 16. Middle East Ready-to-Eat Popcorn Market Analysis, Insights and Forecast, 2019-2031
- 16.1. Market Analysis, Insights and Forecast - By Country/Sub-region
- 16.1.1.
- 17. United Arab Emirates Ready-to-Eat Popcorn Market Analysis, Insights and Forecast, 2019-2031
- 17.1. Market Analysis, Insights and Forecast - By Country/Sub-region
- 17.1.1 South Africa
- 17.1.2 Rest of Middle East
- 18. Competitive Analysis
- 18.1. Global Market Share Analysis 2024
- 18.2. Company Profiles
- 18.2.1 Pepsico Inc
- 18.2.1.1. Overview
- 18.2.1.2. Products
- 18.2.1.3. SWOT Analysis
- 18.2.1.4. Recent Developments
- 18.2.1.5. Financials (Based on Availability)
- 18.2.2 Conagra Brands Inc
- 18.2.2.1. Overview
- 18.2.2.2. Products
- 18.2.2.3. SWOT Analysis
- 18.2.2.4. Recent Developments
- 18.2.2.5. Financials (Based on Availability)
- 18.2.3 Quinn Snacks Inc
- 18.2.3.1. Overview
- 18.2.3.2. Products
- 18.2.3.3. SWOT Analysis
- 18.2.3.4. Recent Developments
- 18.2.3.5. Financials (Based on Availability)
- 18.2.4 Campbell Soup Company
- 18.2.4.1. Overview
- 18.2.4.2. Products
- 18.2.4.3. SWOT Analysis
- 18.2.4.4. Recent Developments
- 18.2.4.5. Financials (Based on Availability)
- 18.2.5 Proper Snacks
- 18.2.5.1. Overview
- 18.2.5.2. Products
- 18.2.5.3. SWOT Analysis
- 18.2.5.4. Recent Developments
- 18.2.5.5. Financials (Based on Availability)
- 18.2.6 Weaver Popcorn Bulk LLC
- 18.2.6.1. Overview
- 18.2.6.2. Products
- 18.2.6.3. SWOT Analysis
- 18.2.6.4. Recent Developments
- 18.2.6.5. Financials (Based on Availability)
- 18.2.7 Eagle Family Foods Group LLC*List Not Exhaustive
- 18.2.7.1. Overview
- 18.2.7.2. Products
- 18.2.7.3. SWOT Analysis
- 18.2.7.4. Recent Developments
- 18.2.7.5. Financials (Based on Availability)
- 18.2.8 Intersnack Group GmbH & Co KG
- 18.2.8.1. Overview
- 18.2.8.2. Products
- 18.2.8.3. SWOT Analysis
- 18.2.8.4. Recent Developments
- 18.2.8.5. Financials (Based on Availability)
- 18.2.9 Hain Celestial
- 18.2.9.1. Overview
- 18.2.9.2. Products
- 18.2.9.3. SWOT Analysis
- 18.2.9.4. Recent Developments
- 18.2.9.5. Financials (Based on Availability)
- 18.2.10 The Hershey Company
- 18.2.10.1. Overview
- 18.2.10.2. Products
- 18.2.10.3. SWOT Analysis
- 18.2.10.4. Recent Developments
- 18.2.10.5. Financials (Based on Availability)
- 18.2.1 Pepsico Inc
List of Figures
- Figure 1: Global Ready-to-Eat Popcorn Market Revenue Breakdown (Million, %) by Region 2024 & 2032
- Figure 2: North America Ready-to-Eat Popcorn Market Revenue (Million), by Country 2024 & 2032
- Figure 3: North America Ready-to-Eat Popcorn Market Revenue Share (%), by Country 2024 & 2032
- Figure 4: Europe Ready-to-Eat Popcorn Market Revenue (Million), by Country 2024 & 2032
- Figure 5: Europe Ready-to-Eat Popcorn Market Revenue Share (%), by Country 2024 & 2032
- Figure 6: Asia Pacific Ready-to-Eat Popcorn Market Revenue (Million), by Country 2024 & 2032
- Figure 7: Asia Pacific Ready-to-Eat Popcorn Market Revenue Share (%), by Country 2024 & 2032
- Figure 8: South America Ready-to-Eat Popcorn Market Revenue (Million), by Country 2024 & 2032
- Figure 9: South America Ready-to-Eat Popcorn Market Revenue Share (%), by Country 2024 & 2032
- Figure 10: Middle East Ready-to-Eat Popcorn Market Revenue (Million), by Country 2024 & 2032
- Figure 11: Middle East Ready-to-Eat Popcorn Market Revenue Share (%), by Country 2024 & 2032
- Figure 12: United Arab Emirates Ready-to-Eat Popcorn Market Revenue (Million), by Country 2024 & 2032
- Figure 13: United Arab Emirates Ready-to-Eat Popcorn Market Revenue Share (%), by Country 2024 & 2032
- Figure 14: North America Ready-to-Eat Popcorn Market Revenue (Million), by Type 2024 & 2032
- Figure 15: North America Ready-to-Eat Popcorn Market Revenue Share (%), by Type 2024 & 2032
- Figure 16: North America Ready-to-Eat Popcorn Market Revenue (Million), by Distribution Channel 2024 & 2032
- Figure 17: North America Ready-to-Eat Popcorn Market Revenue Share (%), by Distribution Channel 2024 & 2032
- Figure 18: North America Ready-to-Eat Popcorn Market Revenue (Million), by Country 2024 & 2032
- Figure 19: North America Ready-to-Eat Popcorn Market Revenue Share (%), by Country 2024 & 2032
- Figure 20: Europe Ready-to-Eat Popcorn Market Revenue (Million), by Type 2024 & 2032
- Figure 21: Europe Ready-to-Eat Popcorn Market Revenue Share (%), by Type 2024 & 2032
- Figure 22: Europe Ready-to-Eat Popcorn Market Revenue (Million), by Distribution Channel 2024 & 2032
- Figure 23: Europe Ready-to-Eat Popcorn Market Revenue Share (%), by Distribution Channel 2024 & 2032
- Figure 24: Europe Ready-to-Eat Popcorn Market Revenue (Million), by Country 2024 & 2032
- Figure 25: Europe Ready-to-Eat Popcorn Market Revenue Share (%), by Country 2024 & 2032
- Figure 26: Asia Pacific Ready-to-Eat Popcorn Market Revenue (Million), by Type 2024 & 2032
- Figure 27: Asia Pacific Ready-to-Eat Popcorn Market Revenue Share (%), by Type 2024 & 2032
- Figure 28: Asia Pacific Ready-to-Eat Popcorn Market Revenue (Million), by Distribution Channel 2024 & 2032
- Figure 29: Asia Pacific Ready-to-Eat Popcorn Market Revenue Share (%), by Distribution Channel 2024 & 2032
- Figure 30: Asia Pacific Ready-to-Eat Popcorn Market Revenue (Million), by Country 2024 & 2032
- Figure 31: Asia Pacific Ready-to-Eat Popcorn Market Revenue Share (%), by Country 2024 & 2032
- Figure 32: South America Ready-to-Eat Popcorn Market Revenue (Million), by Type 2024 & 2032
- Figure 33: South America Ready-to-Eat Popcorn Market Revenue Share (%), by Type 2024 & 2032
- Figure 34: South America Ready-to-Eat Popcorn Market Revenue (Million), by Distribution Channel 2024 & 2032
- Figure 35: South America Ready-to-Eat Popcorn Market Revenue Share (%), by Distribution Channel 2024 & 2032
- Figure 36: South America Ready-to-Eat Popcorn Market Revenue (Million), by Country 2024 & 2032
- Figure 37: South America Ready-to-Eat Popcorn Market Revenue Share (%), by Country 2024 & 2032
- Figure 38: Middle East Ready-to-Eat Popcorn Market Revenue (Million), by Type 2024 & 2032
- Figure 39: Middle East Ready-to-Eat Popcorn Market Revenue Share (%), by Type 2024 & 2032
- Figure 40: Middle East Ready-to-Eat Popcorn Market Revenue (Million), by Distribution Channel 2024 & 2032
- Figure 41: Middle East Ready-to-Eat Popcorn Market Revenue Share (%), by Distribution Channel 2024 & 2032
- Figure 42: Middle East Ready-to-Eat Popcorn Market Revenue (Million), by Country 2024 & 2032
- Figure 43: Middle East Ready-to-Eat Popcorn Market Revenue Share (%), by Country 2024 & 2032
- Figure 44: United Arab Emirates Ready-to-Eat Popcorn Market Revenue (Million), by Type 2024 & 2032
- Figure 45: United Arab Emirates Ready-to-Eat Popcorn Market Revenue Share (%), by Type 2024 & 2032
- Figure 46: United Arab Emirates Ready-to-Eat Popcorn Market Revenue (Million), by Distribution Channel 2024 & 2032
- Figure 47: United Arab Emirates Ready-to-Eat Popcorn Market Revenue Share (%), by Distribution Channel 2024 & 2032
- Figure 48: United Arab Emirates Ready-to-Eat Popcorn Market Revenue (Million), by Country 2024 & 2032
- Figure 49: United Arab Emirates Ready-to-Eat Popcorn Market Revenue Share (%), by Country 2024 & 2032
List of Tables
- Table 1: Global Ready-to-Eat Popcorn Market Revenue Million Forecast, by Region 2019 & 2032
- Table 2: Global Ready-to-Eat Popcorn Market Revenue Million Forecast, by Type 2019 & 2032
- Table 3: Global Ready-to-Eat Popcorn Market Revenue Million Forecast, by Distribution Channel 2019 & 2032
- Table 4: Global Ready-to-Eat Popcorn Market Revenue Million Forecast, by Region 2019 & 2032
- Table 5: Global Ready-to-Eat Popcorn Market Revenue Million Forecast, by Country 2019 & 2032
- Table 6: United States Ready-to-Eat Popcorn Market Revenue (Million) Forecast, by Application 2019 & 2032
- Table 7: Canada Ready-to-Eat Popcorn Market Revenue (Million) Forecast, by Application 2019 & 2032
- Table 8: Mexico Ready-to-Eat Popcorn Market Revenue (Million) Forecast, by Application 2019 & 2032
- Table 9: Rest of North America Ready-to-Eat Popcorn Market Revenue (Million) Forecast, by Application 2019 & 2032
- Table 10: Global Ready-to-Eat Popcorn Market Revenue Million Forecast, by Country 2019 & 2032
- Table 11: United Kingdom Ready-to-Eat Popcorn Market Revenue (Million) Forecast, by Application 2019 & 2032
- Table 12: Germany Ready-to-Eat Popcorn Market Revenue (Million) Forecast, by Application 2019 & 2032
- Table 13: Spain Ready-to-Eat Popcorn Market Revenue (Million) Forecast, by Application 2019 & 2032
- Table 14: France Ready-to-Eat Popcorn Market Revenue (Million) Forecast, by Application 2019 & 2032
- Table 15: Italy Ready-to-Eat Popcorn Market Revenue (Million) Forecast, by Application 2019 & 2032
- Table 16: Russia Ready-to-Eat Popcorn Market Revenue (Million) Forecast, by Application 2019 & 2032
- Table 17: Rest of Europe Ready-to-Eat Popcorn Market Revenue (Million) Forecast, by Application 2019 & 2032
- Table 18: Global Ready-to-Eat Popcorn Market Revenue Million Forecast, by Country 2019 & 2032
- Table 19: China Ready-to-Eat Popcorn Market Revenue (Million) Forecast, by Application 2019 & 2032
- Table 20: Japan Ready-to-Eat Popcorn Market Revenue (Million) Forecast, by Application 2019 & 2032
- Table 21: India Ready-to-Eat Popcorn Market Revenue (Million) Forecast, by Application 2019 & 2032
- Table 22: Australia Ready-to-Eat Popcorn Market Revenue (Million) Forecast, by Application 2019 & 2032
- Table 23: Rest of Asia Pacific Ready-to-Eat Popcorn Market Revenue (Million) Forecast, by Application 2019 & 2032
- Table 24: Global Ready-to-Eat Popcorn Market Revenue Million Forecast, by Country 2019 & 2032
- Table 25: Brazil Ready-to-Eat Popcorn Market Revenue (Million) Forecast, by Application 2019 & 2032
- Table 26: Argentina Ready-to-Eat Popcorn Market Revenue (Million) Forecast, by Application 2019 & 2032
- Table 27: Rest of South America Ready-to-Eat Popcorn Market Revenue (Million) Forecast, by Application 2019 & 2032
- Table 28: Global Ready-to-Eat Popcorn Market Revenue Million Forecast, by Country 2019 & 2032
- Table 29: Ready-to-Eat Popcorn Market Revenue (Million) Forecast, by Application 2019 & 2032
- Table 30: Global Ready-to-Eat Popcorn Market Revenue Million Forecast, by Country 2019 & 2032
- Table 31: South Africa Ready-to-Eat Popcorn Market Revenue (Million) Forecast, by Application 2019 & 2032
- Table 32: Rest of Middle East Ready-to-Eat Popcorn Market Revenue (Million) Forecast, by Application 2019 & 2032
- Table 33: Global Ready-to-Eat Popcorn Market Revenue Million Forecast, by Type 2019 & 2032
- Table 34: Global Ready-to-Eat Popcorn Market Revenue Million Forecast, by Distribution Channel 2019 & 2032
- Table 35: Global Ready-to-Eat Popcorn Market Revenue Million Forecast, by Country 2019 & 2032
- Table 36: United States Ready-to-Eat Popcorn Market Revenue (Million) Forecast, by Application 2019 & 2032
- Table 37: Canada Ready-to-Eat Popcorn Market Revenue (Million) Forecast, by Application 2019 & 2032
- Table 38: Mexico Ready-to-Eat Popcorn Market Revenue (Million) Forecast, by Application 2019 & 2032
- Table 39: Rest of North America Ready-to-Eat Popcorn Market Revenue (Million) Forecast, by Application 2019 & 2032
- Table 40: Global Ready-to-Eat Popcorn Market Revenue Million Forecast, by Type 2019 & 2032
- Table 41: Global Ready-to-Eat Popcorn Market Revenue Million Forecast, by Distribution Channel 2019 & 2032
- Table 42: Global Ready-to-Eat Popcorn Market Revenue Million Forecast, by Country 2019 & 2032
- Table 43: United Kingdom Ready-to-Eat Popcorn Market Revenue (Million) Forecast, by Application 2019 & 2032
- Table 44: Germany Ready-to-Eat Popcorn Market Revenue (Million) Forecast, by Application 2019 & 2032
- Table 45: Spain Ready-to-Eat Popcorn Market Revenue (Million) Forecast, by Application 2019 & 2032
- Table 46: France Ready-to-Eat Popcorn Market Revenue (Million) Forecast, by Application 2019 & 2032
- Table 47: Italy Ready-to-Eat Popcorn Market Revenue (Million) Forecast, by Application 2019 & 2032
- Table 48: Russia Ready-to-Eat Popcorn Market Revenue (Million) Forecast, by Application 2019 & 2032
- Table 49: Rest of Europe Ready-to-Eat Popcorn Market Revenue (Million) Forecast, by Application 2019 & 2032
- Table 50: Global Ready-to-Eat Popcorn Market Revenue Million Forecast, by Type 2019 & 2032
- Table 51: Global Ready-to-Eat Popcorn Market Revenue Million Forecast, by Distribution Channel 2019 & 2032
- Table 52: Global Ready-to-Eat Popcorn Market Revenue Million Forecast, by Country 2019 & 2032
- Table 53: China Ready-to-Eat Popcorn Market Revenue (Million) Forecast, by Application 2019 & 2032
- Table 54: Japan Ready-to-Eat Popcorn Market Revenue (Million) Forecast, by Application 2019 & 2032
- Table 55: India Ready-to-Eat Popcorn Market Revenue (Million) Forecast, by Application 2019 & 2032
- Table 56: Australia Ready-to-Eat Popcorn Market Revenue (Million) Forecast, by Application 2019 & 2032
- Table 57: Rest of Asia Pacific Ready-to-Eat Popcorn Market Revenue (Million) Forecast, by Application 2019 & 2032
- Table 58: Global Ready-to-Eat Popcorn Market Revenue Million Forecast, by Type 2019 & 2032
- Table 59: Global Ready-to-Eat Popcorn Market Revenue Million Forecast, by Distribution Channel 2019 & 2032
- Table 60: Global Ready-to-Eat Popcorn Market Revenue Million Forecast, by Country 2019 & 2032
- Table 61: Brazil Ready-to-Eat Popcorn Market Revenue (Million) Forecast, by Application 2019 & 2032
- Table 62: Argentina Ready-to-Eat Popcorn Market Revenue (Million) Forecast, by Application 2019 & 2032
- Table 63: Rest of South America Ready-to-Eat Popcorn Market Revenue (Million) Forecast, by Application 2019 & 2032
- Table 64: Global Ready-to-Eat Popcorn Market Revenue Million Forecast, by Type 2019 & 2032
- Table 65: Global Ready-to-Eat Popcorn Market Revenue Million Forecast, by Distribution Channel 2019 & 2032
- Table 66: Global Ready-to-Eat Popcorn Market Revenue Million Forecast, by Country 2019 & 2032
- Table 67: Global Ready-to-Eat Popcorn Market Revenue Million Forecast, by Type 2019 & 2032
- Table 68: Global Ready-to-Eat Popcorn Market Revenue Million Forecast, by Distribution Channel 2019 & 2032
- Table 69: Global Ready-to-Eat Popcorn Market Revenue Million Forecast, by Country 2019 & 2032
- Table 70: South Africa Ready-to-Eat Popcorn Market Revenue (Million) Forecast, by Application 2019 & 2032
- Table 71: Rest of Middle East Ready-to-Eat Popcorn Market Revenue (Million) Forecast, by Application 2019 & 2032
Frequently Asked Questions
1. What is the projected Compound Annual Growth Rate (CAGR) of the Ready-to-Eat Popcorn Market?
The projected CAGR is approximately 11.10%.
2. Which companies are prominent players in the Ready-to-Eat Popcorn Market?
Key companies in the market include Pepsico Inc, Conagra Brands Inc, Quinn Snacks Inc, Campbell Soup Company, Proper Snacks, Weaver Popcorn Bulk LLC, Eagle Family Foods Group LLC*List Not Exhaustive, Intersnack Group GmbH & Co KG, Hain Celestial, The Hershey Company.
3. What are the main segments of the Ready-to-Eat Popcorn Market?
The market segments include Type, Distribution Channel.
4. Can you provide details about the market size?
The market size is estimated to be USD 8.80 Million as of 2022.
5. What are some drivers contributing to market growth?
Rising Demand for Convenient Snacking Options; Increase in Demand for New and Innovative Flavored Meat Snacks.
6. What are the notable trends driving market growth?
Innovation in Flavor driving the market.
7. Are there any restraints impacting market growth?
Fluctuations in the Price of Raw Materials.
8. Can you provide examples of recent developments in the market?
In November 2022, the University of Nebraska in Lincoln is working on developing popcorn types with higher levels of lysine, an amino acid that offers popcorn more nutritional value. Conagra Brands, Inc. is funding the research and is already testing two varieties of popcorn that have nearly twice as much lysine as standard popcorn.
9. What pricing options are available for accessing the report?
Pricing options include single-user, multi-user, and enterprise licenses priced at USD 4750, USD 5250, and USD 8750 respectively.
10. Is the market size provided in terms of value or volume?
The market size is provided in terms of value, measured in Million.
11. Are there any specific market keywords associated with the report?
Yes, the market keyword associated with the report is "Ready-to-Eat Popcorn Market," which aids in identifying and referencing the specific market segment covered.
12. How do I determine which pricing option suits my needs best?
The pricing options vary based on user requirements and access needs. Individual users may opt for single-user licenses, while businesses requiring broader access may choose multi-user or enterprise licenses for cost-effective access to the report.
13. Are there any additional resources or data provided in the Ready-to-Eat Popcorn Market report?
While the report offers comprehensive insights, it's advisable to review the specific contents or supplementary materials provided to ascertain if additional resources or data are available.
14. How can I stay updated on further developments or reports in the Ready-to-Eat Popcorn Market?
To stay informed about further developments, trends, and reports in the Ready-to-Eat Popcorn Market, consider subscribing to industry newsletters, following relevant companies and organizations, or regularly checking reputable industry news sources and publications.
Methodology
Step 1 - Identification of Relevant Samples Size from Population Database


Step 2 - Approaches for Defining Global Market Size (Value, Volume* & Price*)

Note*: In applicable scenarios
Step 3 - Data Sources
Primary Research
- Web Analytics
- Survey Reports
- Research Institute
- Latest Research Reports
- Opinion Leaders
Secondary Research
- Annual Reports
- White Paper
- Latest Press Release
- Industry Association
- Paid Database
- Investor Presentations

Step 4 - Data Triangulation
Involves using different sources of information in order to increase the validity of a study
These sources are likely to be stakeholders in a program - participants, other researchers, program staff, other community members, and so on.
Then we put all data in single framework & apply various statistical tools to find out the dynamic on the market.
During the analysis stage, feedback from the stakeholder groups would be compared to determine areas of agreement as well as areas of divergence


