
Key Insights
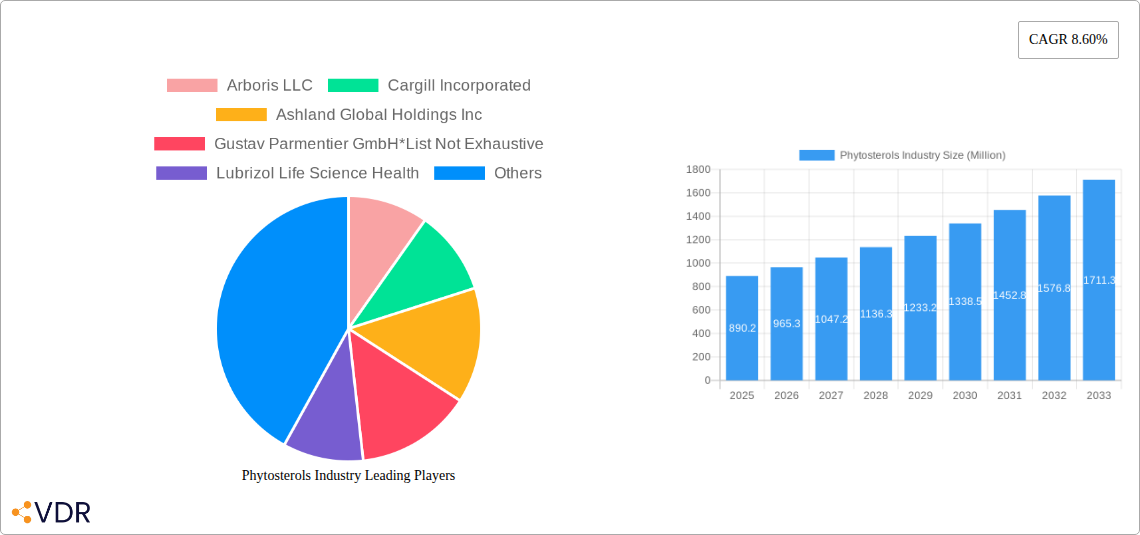
The phytosterols market, valued at $890.2 million in 2025, is projected to experience robust growth, driven by increasing consumer awareness of heart health and the rising prevalence of cardiovascular diseases. This surge in demand is particularly pronounced in the food and beverage sector, with applications expanding into bakery and confectionery products enriched with phytosterols to lower cholesterol levels. The pharmaceutical and dietary supplement industries also contribute significantly to market growth, leveraging phytosterols' cholesterol-lowering properties in various formulations. Growth is further fueled by the expanding cosmetics industry, utilizing phytosterols for their emollient and skin-conditioning properties. While the market faces some restraints, such as the potential for adverse effects at high doses and the relatively high cost of production compared to other cholesterol-reducing agents, these are largely offset by the growing preference for natural and plant-based ingredients. The market is segmented by product type (Beta-Sitosterol, Campesterol, Stigmasterol, and Others) and application (Food & Beverages, Bakery & Confectionery, Pharmaceuticals, Cosmetics, Dietary Supplements, and Animal Feed). Major players like Cargill, Ashland, and BASF are actively involved in research and development, driving innovation and expanding market penetration. Regional analysis reveals strong growth in North America and Europe, driven by high consumer awareness and established regulatory frameworks. However, Asia-Pacific presents a significant opportunity for future expansion, fueled by growing disposable incomes and increasing health consciousness.
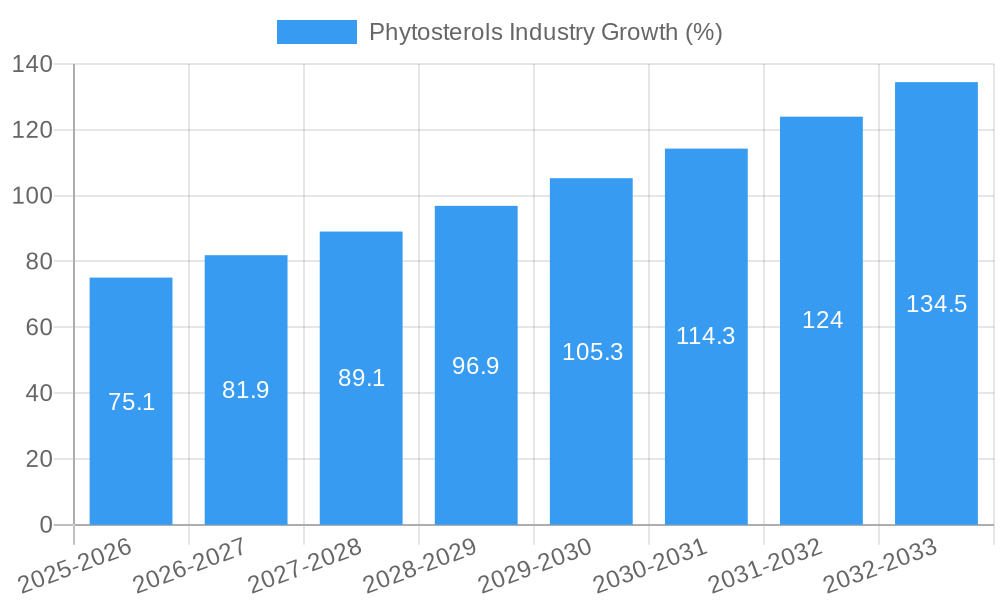
The forecast period (2025-2033) anticipates a continued upward trajectory, with the CAGR of 8.60% indicating substantial market expansion. This growth is expected to be propelled by ongoing research into the health benefits of phytosterols, the development of new applications in functional foods and nutraceuticals, and the increasing adoption of phytosterols in various industries. Competition among major players will remain intense, with a focus on product innovation, strategic partnerships, and expansion into emerging markets. Companies are likely to focus on developing cost-effective production methods and exploring novel applications to maintain a competitive edge and capitalize on the market's growth potential. The development of more bioavailable forms of phytosterols and improved delivery systems could further unlock market growth opportunities in the coming years.
Phytosterols Industry Market Report: 2019-2033
This comprehensive report provides an in-depth analysis of the Phytosterols industry, encompassing market dynamics, growth trends, regional performance, product landscape, and key players. With a focus on the parent market (plant-based ingredients) and child markets (food & beverages, pharmaceuticals, cosmetics), this report offers crucial insights for industry professionals, investors, and stakeholders seeking to navigate this evolving landscape. The study period covers 2019-2033, with a base year of 2025 and a forecast period of 2025-2033. Market values are presented in million units.
Phytosterols Industry Market Dynamics & Structure
The Phytosterols market exhibits a moderately concentrated structure, with key players such as Cargill Incorporated, Ashland Global Holdings Inc, and BASF SE holding significant market share. Technological innovation, particularly in extraction and purification methods, is a primary driver, alongside increasing consumer demand for natural and functional ingredients. Regulatory frameworks governing food additives and dietary supplements significantly influence market growth. Competitive substitutes include other cholesterol-lowering agents, impacting market penetration. Mergers and acquisitions (M&A) activity, exemplified by Kensing LLC's acquisition of Vitae Naturals in June 2022, indicates consolidation and strategic expansion within the industry.
- Market Concentration: Moderately concentrated, with top 5 players holding xx% market share in 2024.
- Technological Innovation: Focus on sustainable extraction, improved purity, and novel delivery systems.
- Regulatory Landscape: Stringent regulations for food and pharmaceutical applications influence product development and market access.
- Competitive Substitutes: Other cholesterol-reducing agents pose competitive pressure.
- M&A Activity: xx M&A deals recorded between 2019-2024, indicating industry consolidation.
- End-User Demographics: Growing health-conscious population fuels demand for functional foods and supplements.
Phytosterols Industry Growth Trends & Insights
The Phytosterols market witnessed robust growth during the historical period (2019-2024), driven by increasing awareness of cardiovascular health and the rising adoption of phytosterol-enriched products across various applications. The market is expected to maintain a healthy CAGR of xx% during the forecast period (2025-2033). This growth is fueled by technological advancements in extraction and purification processes, leading to higher purity and cost-effectiveness. Consumer preference for natural and clean-label ingredients further bolsters market expansion. Shifting dietary habits and a growing focus on preventative healthcare contribute to increased adoption rates. Specific metrics regarding market penetration in key segments are detailed in the full report.
Dominant Regions, Countries, or Segments in Phytosterols Industry
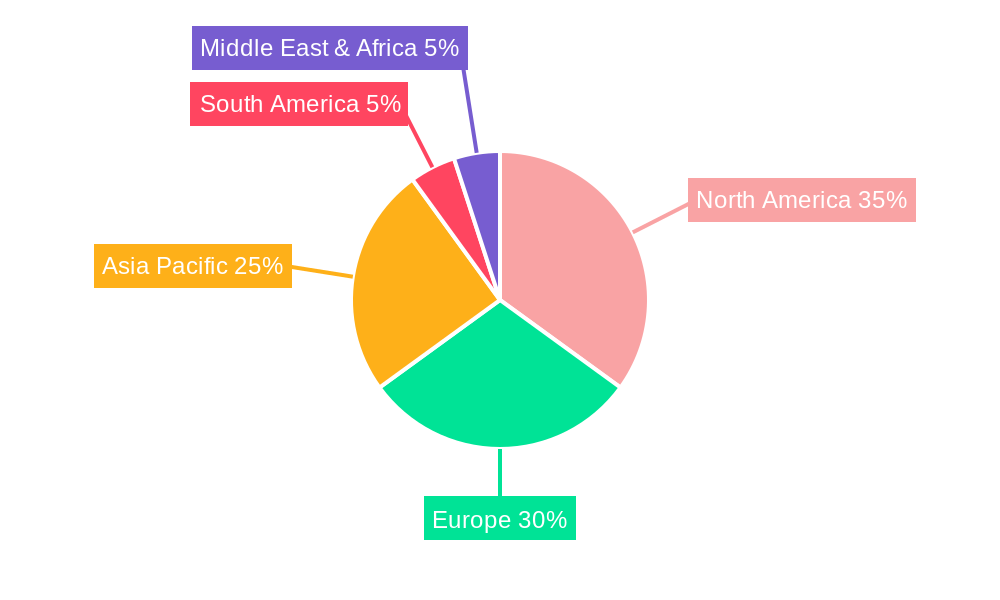
North America and Europe currently dominate the Phytosterols market, driven by high consumer awareness, established regulatory frameworks, and strong demand from the food and beverage and pharmaceutical sectors. Within product types, Beta-Sitosterol holds the largest market share due to its widespread availability and established applications. The Food and Beverages segment accounts for a significant portion of overall consumption, followed by the Pharmaceuticals and Dietary Supplements segments.
- Leading Regions: North America and Europe hold the largest market share due to high consumer demand and established distribution channels.
- Dominant Product Type: Beta-Sitosterol, followed by Campesterol and Stigmasterol.
- Key Application Segment: Food and Beverages, exhibiting significant growth potential in functional foods and beverages.
- Growth Drivers: Increasing health consciousness, regulatory support for functional foods, and strong R&D investment in novel phytosterol applications.
Phytosterols Industry Product Landscape
The Phytosterols product landscape encompasses various forms, including powders, oils, and esters, each catering to specific application needs. Recent innovations focus on enhancing bioavailability, improving solubility, and developing novel delivery systems for optimal efficacy. Unique selling propositions emphasize purity, sustainability, and functionality, catering to evolving consumer preferences. Technological advancements in extraction and purification processes have resulted in higher quality products at reduced costs.
Key Drivers, Barriers & Challenges in Phytosterols Industry
Key Drivers:
- Growing demand for natural and functional ingredients.
- Increasing awareness of the health benefits of phytosterols.
- Technological advancements in extraction and purification methods.
- Favorable regulatory environment in key markets.
Challenges & Restraints:
- Price volatility of raw materials.
- Potential for supply chain disruptions.
- Stringent regulatory requirements for certain applications.
- Competition from synthetic cholesterol-lowering agents. This competition reduces market penetration by xx% annually.
Emerging Opportunities in Phytosterols Industry
- Expanding applications in cosmetics and personal care.
- Growth in the animal feed industry due to its cholesterol-lowering effects.
- Development of novel phytosterol-based solutions for specific health conditions.
- Penetration of emerging markets with rising health awareness.
Growth Accelerators in the Phytosterols Industry
Technological advancements, particularly in efficient and sustainable extraction methods, coupled with strategic partnerships between ingredient suppliers and end-product manufacturers, will fuel long-term growth. Expansion into untapped markets in Asia-Pacific and Latin America, driven by increasing disposable incomes and health awareness, presents significant opportunities.
Key Players Shaping the Phytosterols Industry Market
- Arboris LLC
- Cargill Incorporated
- Ashland Global Holdings Inc
- Gustav Parmentier GmbH
- Lubrizol Life Science Health
- DuPont de Nemours Inc
- Archer Daniels Midland Company
- BASF SE
- Berkshire Hathaway Inc
- Merck Group
Notable Milestones in Phytosterols Industry Sector
- June 2022: Kensing LLC acquired Vitae Naturals, expanding its presence in plant sterol esters and vitamin E derivatives, strengthening its position in the skincare, food, and nutrition markets.
- February 2022: Elicit Plant secured USD 17.26 million in Series funding to advance its phytosterol-based solutions addressing water stress in agriculture. This underscores the growing interest in sustainable and climate-resilient agricultural practices.
In-Depth Phytosterols Industry Market Outlook
The Phytosterols market is poised for sustained growth, driven by ongoing technological advancements, strategic collaborations, and expanding applications. The focus on sustainability and natural ingredients will further propel market expansion. Strategic partnerships and market diversification into emerging regions will create significant opportunities for market participants, promising a positive long-term outlook for the industry.
Phytosterols Industry Segmentation
-
1. Product Type
- 1.1. Beta-Sitosterol
- 1.2. Campesterol
- 1.3. Stigmasterol
- 1.4. Other Product Types
-
2. Application
-
2.1. Food and Beverages
- 2.1.1. Dairy Products
- 2.1.2. Sauces and Condiments
- 2.1.3. Bakery and Confectionery
- 2.2. Pharmaceuticals
- 2.3. Cosmetics
- 2.4. Dietary Supplements
- 2.5. Animal Feed
-
2.1. Food and Beverages
Phytosterols Industry Segmentation By Geography
-
1. North America
- 1.1. United States
- 1.2. Canada
- 1.3. Mexico
- 1.4. Rest of North America
-
2. Europe
- 2.1. Germany
- 2.2. United Kingdom
- 2.3. France
- 2.4. Russia
- 2.5. Spain
- 2.6. Italy
- 2.7. Rest of Europe
-
3. Asia Pacific
- 3.1. India
- 3.2. China
- 3.3. Japan
- 3.4. Australia
- 3.5. Rest of Asia Pacific
-
4. South America
- 4.1. Brazil
- 4.2. Argentina
- 4.3. Rest of South America
- 5. Middle East
-
6. Saudi Arabia
- 6.1. South Africa
- 6.2. Rest of Middle East
Phytosterols Industry REPORT HIGHLIGHTS
| Aspects | Details |
|---|---|
| Study Period | 2019-2033 |
| Base Year | 2024 |
| Estimated Year | 2025 |
| Forecast Period | 2025-2033 |
| Historical Period | 2019-2024 |
| Growth Rate | CAGR of 8.60% from 2019-2033 |
| Segmentation |
|
Table of Contents
- 1. Introduction
- 1.1. Research Scope
- 1.2. Market Segmentation
- 1.3. Research Methodology
- 1.4. Definitions and Assumptions
- 2. Executive Summary
- 2.1. Introduction
- 3. Market Dynamics
- 3.1. Introduction
- 3.2. Market Drivers
- 3.2.1. Increasing awareness towards fitness among consumers; Demand for convenient fortified foods
- 3.3. Market Restrains
- 3.3.1. Prevalence of allergen intolerance among the consumers
- 3.4. Market Trends
- 3.4.1. Increasing Prevalence of Cardiovascular Disease
- 4. Market Factor Analysis
- 4.1. Porters Five Forces
- 4.2. Supply/Value Chain
- 4.3. PESTEL analysis
- 4.4. Market Entropy
- 4.5. Patent/Trademark Analysis
- 5. Global Phytosterols Industry Analysis, Insights and Forecast, 2019-2031
- 5.1. Market Analysis, Insights and Forecast - by Product Type
- 5.1.1. Beta-Sitosterol
- 5.1.2. Campesterol
- 5.1.3. Stigmasterol
- 5.1.4. Other Product Types
- 5.2. Market Analysis, Insights and Forecast - by Application
- 5.2.1. Food and Beverages
- 5.2.1.1. Dairy Products
- 5.2.1.2. Sauces and Condiments
- 5.2.1.3. Bakery and Confectionery
- 5.2.2. Pharmaceuticals
- 5.2.3. Cosmetics
- 5.2.4. Dietary Supplements
- 5.2.5. Animal Feed
- 5.2.1. Food and Beverages
- 5.3. Market Analysis, Insights and Forecast - by Region
- 5.3.1. North America
- 5.3.2. Europe
- 5.3.3. Asia Pacific
- 5.3.4. South America
- 5.3.5. Middle East
- 5.3.6. Saudi Arabia
- 5.1. Market Analysis, Insights and Forecast - by Product Type
- 6. North America Phytosterols Industry Analysis, Insights and Forecast, 2019-2031
- 6.1. Market Analysis, Insights and Forecast - by Product Type
- 6.1.1. Beta-Sitosterol
- 6.1.2. Campesterol
- 6.1.3. Stigmasterol
- 6.1.4. Other Product Types
- 6.2. Market Analysis, Insights and Forecast - by Application
- 6.2.1. Food and Beverages
- 6.2.1.1. Dairy Products
- 6.2.1.2. Sauces and Condiments
- 6.2.1.3. Bakery and Confectionery
- 6.2.2. Pharmaceuticals
- 6.2.3. Cosmetics
- 6.2.4. Dietary Supplements
- 6.2.5. Animal Feed
- 6.2.1. Food and Beverages
- 6.1. Market Analysis, Insights and Forecast - by Product Type
- 7. Europe Phytosterols Industry Analysis, Insights and Forecast, 2019-2031
- 7.1. Market Analysis, Insights and Forecast - by Product Type
- 7.1.1. Beta-Sitosterol
- 7.1.2. Campesterol
- 7.1.3. Stigmasterol
- 7.1.4. Other Product Types
- 7.2. Market Analysis, Insights and Forecast - by Application
- 7.2.1. Food and Beverages
- 7.2.1.1. Dairy Products
- 7.2.1.2. Sauces and Condiments
- 7.2.1.3. Bakery and Confectionery
- 7.2.2. Pharmaceuticals
- 7.2.3. Cosmetics
- 7.2.4. Dietary Supplements
- 7.2.5. Animal Feed
- 7.2.1. Food and Beverages
- 7.1. Market Analysis, Insights and Forecast - by Product Type
- 8. Asia Pacific Phytosterols Industry Analysis, Insights and Forecast, 2019-2031
- 8.1. Market Analysis, Insights and Forecast - by Product Type
- 8.1.1. Beta-Sitosterol
- 8.1.2. Campesterol
- 8.1.3. Stigmasterol
- 8.1.4. Other Product Types
- 8.2. Market Analysis, Insights and Forecast - by Application
- 8.2.1. Food and Beverages
- 8.2.1.1. Dairy Products
- 8.2.1.2. Sauces and Condiments
- 8.2.1.3. Bakery and Confectionery
- 8.2.2. Pharmaceuticals
- 8.2.3. Cosmetics
- 8.2.4. Dietary Supplements
- 8.2.5. Animal Feed
- 8.2.1. Food and Beverages
- 8.1. Market Analysis, Insights and Forecast - by Product Type
- 9. South America Phytosterols Industry Analysis, Insights and Forecast, 2019-2031
- 9.1. Market Analysis, Insights and Forecast - by Product Type
- 9.1.1. Beta-Sitosterol
- 9.1.2. Campesterol
- 9.1.3. Stigmasterol
- 9.1.4. Other Product Types
- 9.2. Market Analysis, Insights and Forecast - by Application
- 9.2.1. Food and Beverages
- 9.2.1.1. Dairy Products
- 9.2.1.2. Sauces and Condiments
- 9.2.1.3. Bakery and Confectionery
- 9.2.2. Pharmaceuticals
- 9.2.3. Cosmetics
- 9.2.4. Dietary Supplements
- 9.2.5. Animal Feed
- 9.2.1. Food and Beverages
- 9.1. Market Analysis, Insights and Forecast - by Product Type
- 10. Middle East Phytosterols Industry Analysis, Insights and Forecast, 2019-2031
- 10.1. Market Analysis, Insights and Forecast - by Product Type
- 10.1.1. Beta-Sitosterol
- 10.1.2. Campesterol
- 10.1.3. Stigmasterol
- 10.1.4. Other Product Types
- 10.2. Market Analysis, Insights and Forecast - by Application
- 10.2.1. Food and Beverages
- 10.2.1.1. Dairy Products
- 10.2.1.2. Sauces and Condiments
- 10.2.1.3. Bakery and Confectionery
- 10.2.2. Pharmaceuticals
- 10.2.3. Cosmetics
- 10.2.4. Dietary Supplements
- 10.2.5. Animal Feed
- 10.2.1. Food and Beverages
- 10.1. Market Analysis, Insights and Forecast - by Product Type
- 11. Saudi Arabia Phytosterols Industry Analysis, Insights and Forecast, 2019-2031
- 11.1. Market Analysis, Insights and Forecast - by Product Type
- 11.1.1. Beta-Sitosterol
- 11.1.2. Campesterol
- 11.1.3. Stigmasterol
- 11.1.4. Other Product Types
- 11.2. Market Analysis, Insights and Forecast - by Application
- 11.2.1. Food and Beverages
- 11.2.1.1. Dairy Products
- 11.2.1.2. Sauces and Condiments
- 11.2.1.3. Bakery and Confectionery
- 11.2.2. Pharmaceuticals
- 11.2.3. Cosmetics
- 11.2.4. Dietary Supplements
- 11.2.5. Animal Feed
- 11.2.1. Food and Beverages
- 11.1. Market Analysis, Insights and Forecast - by Product Type
- 12. North America Phytosterols Industry Analysis, Insights and Forecast, 2019-2031
- 12.1. Market Analysis, Insights and Forecast - By Country/Sub-region
- 12.1.1 United States
- 12.1.2 Canada
- 12.1.3 Mexico
- 12.1.4 Rest of North America
- 13. Europe Phytosterols Industry Analysis, Insights and Forecast, 2019-2031
- 13.1. Market Analysis, Insights and Forecast - By Country/Sub-region
- 13.1.1 Germany
- 13.1.2 United Kingdom
- 13.1.3 France
- 13.1.4 Russia
- 13.1.5 Spain
- 13.1.6 Italy
- 13.1.7 Rest of Europe
- 14. Asia Pacific Phytosterols Industry Analysis, Insights and Forecast, 2019-2031
- 14.1. Market Analysis, Insights and Forecast - By Country/Sub-region
- 14.1.1 India
- 14.1.2 China
- 14.1.3 Japan
- 14.1.4 Australia
- 14.1.5 Rest of Asia Pacific
- 15. South America Phytosterols Industry Analysis, Insights and Forecast, 2019-2031
- 15.1. Market Analysis, Insights and Forecast - By Country/Sub-region
- 15.1.1 Brazil
- 15.1.2 Argentina
- 15.1.3 Rest of South America
- 16. Middle East Phytosterols Industry Analysis, Insights and Forecast, 2019-2031
- 16.1. Market Analysis, Insights and Forecast - By Country/Sub-region
- 16.1.1 Middle East
- 16.1.2 Africa
- 17. Saudi Arabia Phytosterols Industry Analysis, Insights and Forecast, 2019-2031
- 17.1. Market Analysis, Insights and Forecast - By Country/Sub-region
- 17.1.1 South Africa
- 17.1.2 Rest of Middle East
- 18. Competitive Analysis
- 18.1. Global Market Share Analysis 2024
- 18.2. Company Profiles
- 18.2.1 Arboris LLC
- 18.2.1.1. Overview
- 18.2.1.2. Products
- 18.2.1.3. SWOT Analysis
- 18.2.1.4. Recent Developments
- 18.2.1.5. Financials (Based on Availability)
- 18.2.2 Cargill Incorporated
- 18.2.2.1. Overview
- 18.2.2.2. Products
- 18.2.2.3. SWOT Analysis
- 18.2.2.4. Recent Developments
- 18.2.2.5. Financials (Based on Availability)
- 18.2.3 Ashland Global Holdings Inc
- 18.2.3.1. Overview
- 18.2.3.2. Products
- 18.2.3.3. SWOT Analysis
- 18.2.3.4. Recent Developments
- 18.2.3.5. Financials (Based on Availability)
- 18.2.4 Gustav Parmentier GmbH*List Not Exhaustive
- 18.2.4.1. Overview
- 18.2.4.2. Products
- 18.2.4.3. SWOT Analysis
- 18.2.4.4. Recent Developments
- 18.2.4.5. Financials (Based on Availability)
- 18.2.5 Lubrizol Life Science Health
- 18.2.5.1. Overview
- 18.2.5.2. Products
- 18.2.5.3. SWOT Analysis
- 18.2.5.4. Recent Developments
- 18.2.5.5. Financials (Based on Availability)
- 18.2.6 DuPont de Nemours Inc
- 18.2.6.1. Overview
- 18.2.6.2. Products
- 18.2.6.3. SWOT Analysis
- 18.2.6.4. Recent Developments
- 18.2.6.5. Financials (Based on Availability)
- 18.2.7 Archer Daniels Midland Company
- 18.2.7.1. Overview
- 18.2.7.2. Products
- 18.2.7.3. SWOT Analysis
- 18.2.7.4. Recent Developments
- 18.2.7.5. Financials (Based on Availability)
- 18.2.8 BASF SE
- 18.2.8.1. Overview
- 18.2.8.2. Products
- 18.2.8.3. SWOT Analysis
- 18.2.8.4. Recent Developments
- 18.2.8.5. Financials (Based on Availability)
- 18.2.9 Berkshire Hathaway Inc
- 18.2.9.1. Overview
- 18.2.9.2. Products
- 18.2.9.3. SWOT Analysis
- 18.2.9.4. Recent Developments
- 18.2.9.5. Financials (Based on Availability)
- 18.2.10 Merck Group
- 18.2.10.1. Overview
- 18.2.10.2. Products
- 18.2.10.3. SWOT Analysis
- 18.2.10.4. Recent Developments
- 18.2.10.5. Financials (Based on Availability)
- 18.2.1 Arboris LLC
List of Figures
- Figure 1: Global Phytosterols Industry Revenue Breakdown (Million, %) by Region 2024 & 2032
- Figure 2: Global Phytosterols Industry Volume Breakdown (K Tons, %) by Region 2024 & 2032
- Figure 3: North America Phytosterols Industry Revenue (Million), by Country 2024 & 2032
- Figure 4: North America Phytosterols Industry Volume (K Tons), by Country 2024 & 2032
- Figure 5: North America Phytosterols Industry Revenue Share (%), by Country 2024 & 2032
- Figure 6: North America Phytosterols Industry Volume Share (%), by Country 2024 & 2032
- Figure 7: Europe Phytosterols Industry Revenue (Million), by Country 2024 & 2032
- Figure 8: Europe Phytosterols Industry Volume (K Tons), by Country 2024 & 2032
- Figure 9: Europe Phytosterols Industry Revenue Share (%), by Country 2024 & 2032
- Figure 10: Europe Phytosterols Industry Volume Share (%), by Country 2024 & 2032
- Figure 11: Asia Pacific Phytosterols Industry Revenue (Million), by Country 2024 & 2032
- Figure 12: Asia Pacific Phytosterols Industry Volume (K Tons), by Country 2024 & 2032
- Figure 13: Asia Pacific Phytosterols Industry Revenue Share (%), by Country 2024 & 2032
- Figure 14: Asia Pacific Phytosterols Industry Volume Share (%), by Country 2024 & 2032
- Figure 15: South America Phytosterols Industry Revenue (Million), by Country 2024 & 2032
- Figure 16: South America Phytosterols Industry Volume (K Tons), by Country 2024 & 2032
- Figure 17: South America Phytosterols Industry Revenue Share (%), by Country 2024 & 2032
- Figure 18: South America Phytosterols Industry Volume Share (%), by Country 2024 & 2032
- Figure 19: Middle East Phytosterols Industry Revenue (Million), by Country 2024 & 2032
- Figure 20: Middle East Phytosterols Industry Volume (K Tons), by Country 2024 & 2032
- Figure 21: Middle East Phytosterols Industry Revenue Share (%), by Country 2024 & 2032
- Figure 22: Middle East Phytosterols Industry Volume Share (%), by Country 2024 & 2032
- Figure 23: Saudi Arabia Phytosterols Industry Revenue (Million), by Country 2024 & 2032
- Figure 24: Saudi Arabia Phytosterols Industry Volume (K Tons), by Country 2024 & 2032
- Figure 25: Saudi Arabia Phytosterols Industry Revenue Share (%), by Country 2024 & 2032
- Figure 26: Saudi Arabia Phytosterols Industry Volume Share (%), by Country 2024 & 2032
- Figure 27: North America Phytosterols Industry Revenue (Million), by Product Type 2024 & 2032
- Figure 28: North America Phytosterols Industry Volume (K Tons), by Product Type 2024 & 2032
- Figure 29: North America Phytosterols Industry Revenue Share (%), by Product Type 2024 & 2032
- Figure 30: North America Phytosterols Industry Volume Share (%), by Product Type 2024 & 2032
- Figure 31: North America Phytosterols Industry Revenue (Million), by Application 2024 & 2032
- Figure 32: North America Phytosterols Industry Volume (K Tons), by Application 2024 & 2032
- Figure 33: North America Phytosterols Industry Revenue Share (%), by Application 2024 & 2032
- Figure 34: North America Phytosterols Industry Volume Share (%), by Application 2024 & 2032
- Figure 35: North America Phytosterols Industry Revenue (Million), by Country 2024 & 2032
- Figure 36: North America Phytosterols Industry Volume (K Tons), by Country 2024 & 2032
- Figure 37: North America Phytosterols Industry Revenue Share (%), by Country 2024 & 2032
- Figure 38: North America Phytosterols Industry Volume Share (%), by Country 2024 & 2032
- Figure 39: Europe Phytosterols Industry Revenue (Million), by Product Type 2024 & 2032
- Figure 40: Europe Phytosterols Industry Volume (K Tons), by Product Type 2024 & 2032
- Figure 41: Europe Phytosterols Industry Revenue Share (%), by Product Type 2024 & 2032
- Figure 42: Europe Phytosterols Industry Volume Share (%), by Product Type 2024 & 2032
- Figure 43: Europe Phytosterols Industry Revenue (Million), by Application 2024 & 2032
- Figure 44: Europe Phytosterols Industry Volume (K Tons), by Application 2024 & 2032
- Figure 45: Europe Phytosterols Industry Revenue Share (%), by Application 2024 & 2032
- Figure 46: Europe Phytosterols Industry Volume Share (%), by Application 2024 & 2032
- Figure 47: Europe Phytosterols Industry Revenue (Million), by Country 2024 & 2032
- Figure 48: Europe Phytosterols Industry Volume (K Tons), by Country 2024 & 2032
- Figure 49: Europe Phytosterols Industry Revenue Share (%), by Country 2024 & 2032
- Figure 50: Europe Phytosterols Industry Volume Share (%), by Country 2024 & 2032
- Figure 51: Asia Pacific Phytosterols Industry Revenue (Million), by Product Type 2024 & 2032
- Figure 52: Asia Pacific Phytosterols Industry Volume (K Tons), by Product Type 2024 & 2032
- Figure 53: Asia Pacific Phytosterols Industry Revenue Share (%), by Product Type 2024 & 2032
- Figure 54: Asia Pacific Phytosterols Industry Volume Share (%), by Product Type 2024 & 2032
- Figure 55: Asia Pacific Phytosterols Industry Revenue (Million), by Application 2024 & 2032
- Figure 56: Asia Pacific Phytosterols Industry Volume (K Tons), by Application 2024 & 2032
- Figure 57: Asia Pacific Phytosterols Industry Revenue Share (%), by Application 2024 & 2032
- Figure 58: Asia Pacific Phytosterols Industry Volume Share (%), by Application 2024 & 2032
- Figure 59: Asia Pacific Phytosterols Industry Revenue (Million), by Country 2024 & 2032
- Figure 60: Asia Pacific Phytosterols Industry Volume (K Tons), by Country 2024 & 2032
- Figure 61: Asia Pacific Phytosterols Industry Revenue Share (%), by Country 2024 & 2032
- Figure 62: Asia Pacific Phytosterols Industry Volume Share (%), by Country 2024 & 2032
- Figure 63: South America Phytosterols Industry Revenue (Million), by Product Type 2024 & 2032
- Figure 64: South America Phytosterols Industry Volume (K Tons), by Product Type 2024 & 2032
- Figure 65: South America Phytosterols Industry Revenue Share (%), by Product Type 2024 & 2032
- Figure 66: South America Phytosterols Industry Volume Share (%), by Product Type 2024 & 2032
- Figure 67: South America Phytosterols Industry Revenue (Million), by Application 2024 & 2032
- Figure 68: South America Phytosterols Industry Volume (K Tons), by Application 2024 & 2032
- Figure 69: South America Phytosterols Industry Revenue Share (%), by Application 2024 & 2032
- Figure 70: South America Phytosterols Industry Volume Share (%), by Application 2024 & 2032
- Figure 71: South America Phytosterols Industry Revenue (Million), by Country 2024 & 2032
- Figure 72: South America Phytosterols Industry Volume (K Tons), by Country 2024 & 2032
- Figure 73: South America Phytosterols Industry Revenue Share (%), by Country 2024 & 2032
- Figure 74: South America Phytosterols Industry Volume Share (%), by Country 2024 & 2032
- Figure 75: Middle East Phytosterols Industry Revenue (Million), by Product Type 2024 & 2032
- Figure 76: Middle East Phytosterols Industry Volume (K Tons), by Product Type 2024 & 2032
- Figure 77: Middle East Phytosterols Industry Revenue Share (%), by Product Type 2024 & 2032
- Figure 78: Middle East Phytosterols Industry Volume Share (%), by Product Type 2024 & 2032
- Figure 79: Middle East Phytosterols Industry Revenue (Million), by Application 2024 & 2032
- Figure 80: Middle East Phytosterols Industry Volume (K Tons), by Application 2024 & 2032
- Figure 81: Middle East Phytosterols Industry Revenue Share (%), by Application 2024 & 2032
- Figure 82: Middle East Phytosterols Industry Volume Share (%), by Application 2024 & 2032
- Figure 83: Middle East Phytosterols Industry Revenue (Million), by Country 2024 & 2032
- Figure 84: Middle East Phytosterols Industry Volume (K Tons), by Country 2024 & 2032
- Figure 85: Middle East Phytosterols Industry Revenue Share (%), by Country 2024 & 2032
- Figure 86: Middle East Phytosterols Industry Volume Share (%), by Country 2024 & 2032
- Figure 87: Saudi Arabia Phytosterols Industry Revenue (Million), by Product Type 2024 & 2032
- Figure 88: Saudi Arabia Phytosterols Industry Volume (K Tons), by Product Type 2024 & 2032
- Figure 89: Saudi Arabia Phytosterols Industry Revenue Share (%), by Product Type 2024 & 2032
- Figure 90: Saudi Arabia Phytosterols Industry Volume Share (%), by Product Type 2024 & 2032
- Figure 91: Saudi Arabia Phytosterols Industry Revenue (Million), by Application 2024 & 2032
- Figure 92: Saudi Arabia Phytosterols Industry Volume (K Tons), by Application 2024 & 2032
- Figure 93: Saudi Arabia Phytosterols Industry Revenue Share (%), by Application 2024 & 2032
- Figure 94: Saudi Arabia Phytosterols Industry Volume Share (%), by Application 2024 & 2032
- Figure 95: Saudi Arabia Phytosterols Industry Revenue (Million), by Country 2024 & 2032
- Figure 96: Saudi Arabia Phytosterols Industry Volume (K Tons), by Country 2024 & 2032
- Figure 97: Saudi Arabia Phytosterols Industry Revenue Share (%), by Country 2024 & 2032
- Figure 98: Saudi Arabia Phytosterols Industry Volume Share (%), by Country 2024 & 2032
List of Tables
- Table 1: Global Phytosterols Industry Revenue Million Forecast, by Region 2019 & 2032
- Table 2: Global Phytosterols Industry Volume K Tons Forecast, by Region 2019 & 2032
- Table 3: Global Phytosterols Industry Revenue Million Forecast, by Product Type 2019 & 2032
- Table 4: Global Phytosterols Industry Volume K Tons Forecast, by Product Type 2019 & 2032
- Table 5: Global Phytosterols Industry Revenue Million Forecast, by Application 2019 & 2032
- Table 6: Global Phytosterols Industry Volume K Tons Forecast, by Application 2019 & 2032
- Table 7: Global Phytosterols Industry Revenue Million Forecast, by Region 2019 & 2032
- Table 8: Global Phytosterols Industry Volume K Tons Forecast, by Region 2019 & 2032
- Table 9: Global Phytosterols Industry Revenue Million Forecast, by Country 2019 & 2032
- Table 10: Global Phytosterols Industry Volume K Tons Forecast, by Country 2019 & 2032
- Table 11: United States Phytosterols Industry Revenue (Million) Forecast, by Application 2019 & 2032
- Table 12: United States Phytosterols Industry Volume (K Tons) Forecast, by Application 2019 & 2032
- Table 13: Canada Phytosterols Industry Revenue (Million) Forecast, by Application 2019 & 2032
- Table 14: Canada Phytosterols Industry Volume (K Tons) Forecast, by Application 2019 & 2032
- Table 15: Mexico Phytosterols Industry Revenue (Million) Forecast, by Application 2019 & 2032
- Table 16: Mexico Phytosterols Industry Volume (K Tons) Forecast, by Application 2019 & 2032
- Table 17: Rest of North America Phytosterols Industry Revenue (Million) Forecast, by Application 2019 & 2032
- Table 18: Rest of North America Phytosterols Industry Volume (K Tons) Forecast, by Application 2019 & 2032
- Table 19: Global Phytosterols Industry Revenue Million Forecast, by Country 2019 & 2032
- Table 20: Global Phytosterols Industry Volume K Tons Forecast, by Country 2019 & 2032
- Table 21: Germany Phytosterols Industry Revenue (Million) Forecast, by Application 2019 & 2032
- Table 22: Germany Phytosterols Industry Volume (K Tons) Forecast, by Application 2019 & 2032
- Table 23: United Kingdom Phytosterols Industry Revenue (Million) Forecast, by Application 2019 & 2032
- Table 24: United Kingdom Phytosterols Industry Volume (K Tons) Forecast, by Application 2019 & 2032
- Table 25: France Phytosterols Industry Revenue (Million) Forecast, by Application 2019 & 2032
- Table 26: France Phytosterols Industry Volume (K Tons) Forecast, by Application 2019 & 2032
- Table 27: Russia Phytosterols Industry Revenue (Million) Forecast, by Application 2019 & 2032
- Table 28: Russia Phytosterols Industry Volume (K Tons) Forecast, by Application 2019 & 2032
- Table 29: Spain Phytosterols Industry Revenue (Million) Forecast, by Application 2019 & 2032
- Table 30: Spain Phytosterols Industry Volume (K Tons) Forecast, by Application 2019 & 2032
- Table 31: Italy Phytosterols Industry Revenue (Million) Forecast, by Application 2019 & 2032
- Table 32: Italy Phytosterols Industry Volume (K Tons) Forecast, by Application 2019 & 2032
- Table 33: Rest of Europe Phytosterols Industry Revenue (Million) Forecast, by Application 2019 & 2032
- Table 34: Rest of Europe Phytosterols Industry Volume (K Tons) Forecast, by Application 2019 & 2032
- Table 35: Global Phytosterols Industry Revenue Million Forecast, by Country 2019 & 2032
- Table 36: Global Phytosterols Industry Volume K Tons Forecast, by Country 2019 & 2032
- Table 37: India Phytosterols Industry Revenue (Million) Forecast, by Application 2019 & 2032
- Table 38: India Phytosterols Industry Volume (K Tons) Forecast, by Application 2019 & 2032
- Table 39: China Phytosterols Industry Revenue (Million) Forecast, by Application 2019 & 2032
- Table 40: China Phytosterols Industry Volume (K Tons) Forecast, by Application 2019 & 2032
- Table 41: Japan Phytosterols Industry Revenue (Million) Forecast, by Application 2019 & 2032
- Table 42: Japan Phytosterols Industry Volume (K Tons) Forecast, by Application 2019 & 2032
- Table 43: Australia Phytosterols Industry Revenue (Million) Forecast, by Application 2019 & 2032
- Table 44: Australia Phytosterols Industry Volume (K Tons) Forecast, by Application 2019 & 2032
- Table 45: Rest of Asia Pacific Phytosterols Industry Revenue (Million) Forecast, by Application 2019 & 2032
- Table 46: Rest of Asia Pacific Phytosterols Industry Volume (K Tons) Forecast, by Application 2019 & 2032
- Table 47: Global Phytosterols Industry Revenue Million Forecast, by Country 2019 & 2032
- Table 48: Global Phytosterols Industry Volume K Tons Forecast, by Country 2019 & 2032
- Table 49: Brazil Phytosterols Industry Revenue (Million) Forecast, by Application 2019 & 2032
- Table 50: Brazil Phytosterols Industry Volume (K Tons) Forecast, by Application 2019 & 2032
- Table 51: Argentina Phytosterols Industry Revenue (Million) Forecast, by Application 2019 & 2032
- Table 52: Argentina Phytosterols Industry Volume (K Tons) Forecast, by Application 2019 & 2032
- Table 53: Rest of South America Phytosterols Industry Revenue (Million) Forecast, by Application 2019 & 2032
- Table 54: Rest of South America Phytosterols Industry Volume (K Tons) Forecast, by Application 2019 & 2032
- Table 55: Global Phytosterols Industry Revenue Million Forecast, by Country 2019 & 2032
- Table 56: Global Phytosterols Industry Volume K Tons Forecast, by Country 2019 & 2032
- Table 57: Middle East Phytosterols Industry Revenue (Million) Forecast, by Application 2019 & 2032
- Table 58: Middle East Phytosterols Industry Volume (K Tons) Forecast, by Application 2019 & 2032
- Table 59: Africa Phytosterols Industry Revenue (Million) Forecast, by Application 2019 & 2032
- Table 60: Africa Phytosterols Industry Volume (K Tons) Forecast, by Application 2019 & 2032
- Table 61: Global Phytosterols Industry Revenue Million Forecast, by Country 2019 & 2032
- Table 62: Global Phytosterols Industry Volume K Tons Forecast, by Country 2019 & 2032
- Table 63: South Africa Phytosterols Industry Revenue (Million) Forecast, by Application 2019 & 2032
- Table 64: South Africa Phytosterols Industry Volume (K Tons) Forecast, by Application 2019 & 2032
- Table 65: Rest of Middle East Phytosterols Industry Revenue (Million) Forecast, by Application 2019 & 2032
- Table 66: Rest of Middle East Phytosterols Industry Volume (K Tons) Forecast, by Application 2019 & 2032
- Table 67: Global Phytosterols Industry Revenue Million Forecast, by Product Type 2019 & 2032
- Table 68: Global Phytosterols Industry Volume K Tons Forecast, by Product Type 2019 & 2032
- Table 69: Global Phytosterols Industry Revenue Million Forecast, by Application 2019 & 2032
- Table 70: Global Phytosterols Industry Volume K Tons Forecast, by Application 2019 & 2032
- Table 71: Global Phytosterols Industry Revenue Million Forecast, by Country 2019 & 2032
- Table 72: Global Phytosterols Industry Volume K Tons Forecast, by Country 2019 & 2032
- Table 73: United States Phytosterols Industry Revenue (Million) Forecast, by Application 2019 & 2032
- Table 74: United States Phytosterols Industry Volume (K Tons) Forecast, by Application 2019 & 2032
- Table 75: Canada Phytosterols Industry Revenue (Million) Forecast, by Application 2019 & 2032
- Table 76: Canada Phytosterols Industry Volume (K Tons) Forecast, by Application 2019 & 2032
- Table 77: Mexico Phytosterols Industry Revenue (Million) Forecast, by Application 2019 & 2032
- Table 78: Mexico Phytosterols Industry Volume (K Tons) Forecast, by Application 2019 & 2032
- Table 79: Rest of North America Phytosterols Industry Revenue (Million) Forecast, by Application 2019 & 2032
- Table 80: Rest of North America Phytosterols Industry Volume (K Tons) Forecast, by Application 2019 & 2032
- Table 81: Global Phytosterols Industry Revenue Million Forecast, by Product Type 2019 & 2032
- Table 82: Global Phytosterols Industry Volume K Tons Forecast, by Product Type 2019 & 2032
- Table 83: Global Phytosterols Industry Revenue Million Forecast, by Application 2019 & 2032
- Table 84: Global Phytosterols Industry Volume K Tons Forecast, by Application 2019 & 2032
- Table 85: Global Phytosterols Industry Revenue Million Forecast, by Country 2019 & 2032
- Table 86: Global Phytosterols Industry Volume K Tons Forecast, by Country 2019 & 2032
- Table 87: Germany Phytosterols Industry Revenue (Million) Forecast, by Application 2019 & 2032
- Table 88: Germany Phytosterols Industry Volume (K Tons) Forecast, by Application 2019 & 2032
- Table 89: United Kingdom Phytosterols Industry Revenue (Million) Forecast, by Application 2019 & 2032
- Table 90: United Kingdom Phytosterols Industry Volume (K Tons) Forecast, by Application 2019 & 2032
- Table 91: France Phytosterols Industry Revenue (Million) Forecast, by Application 2019 & 2032
- Table 92: France Phytosterols Industry Volume (K Tons) Forecast, by Application 2019 & 2032
- Table 93: Russia Phytosterols Industry Revenue (Million) Forecast, by Application 2019 & 2032
- Table 94: Russia Phytosterols Industry Volume (K Tons) Forecast, by Application 2019 & 2032
- Table 95: Spain Phytosterols Industry Revenue (Million) Forecast, by Application 2019 & 2032
- Table 96: Spain Phytosterols Industry Volume (K Tons) Forecast, by Application 2019 & 2032
- Table 97: Italy Phytosterols Industry Revenue (Million) Forecast, by Application 2019 & 2032
- Table 98: Italy Phytosterols Industry Volume (K Tons) Forecast, by Application 2019 & 2032
- Table 99: Rest of Europe Phytosterols Industry Revenue (Million) Forecast, by Application 2019 & 2032
- Table 100: Rest of Europe Phytosterols Industry Volume (K Tons) Forecast, by Application 2019 & 2032
- Table 101: Global Phytosterols Industry Revenue Million Forecast, by Product Type 2019 & 2032
- Table 102: Global Phytosterols Industry Volume K Tons Forecast, by Product Type 2019 & 2032
- Table 103: Global Phytosterols Industry Revenue Million Forecast, by Application 2019 & 2032
- Table 104: Global Phytosterols Industry Volume K Tons Forecast, by Application 2019 & 2032
- Table 105: Global Phytosterols Industry Revenue Million Forecast, by Country 2019 & 2032
- Table 106: Global Phytosterols Industry Volume K Tons Forecast, by Country 2019 & 2032
- Table 107: India Phytosterols Industry Revenue (Million) Forecast, by Application 2019 & 2032
- Table 108: India Phytosterols Industry Volume (K Tons) Forecast, by Application 2019 & 2032
- Table 109: China Phytosterols Industry Revenue (Million) Forecast, by Application 2019 & 2032
- Table 110: China Phytosterols Industry Volume (K Tons) Forecast, by Application 2019 & 2032
- Table 111: Japan Phytosterols Industry Revenue (Million) Forecast, by Application 2019 & 2032
- Table 112: Japan Phytosterols Industry Volume (K Tons) Forecast, by Application 2019 & 2032
- Table 113: Australia Phytosterols Industry Revenue (Million) Forecast, by Application 2019 & 2032
- Table 114: Australia Phytosterols Industry Volume (K Tons) Forecast, by Application 2019 & 2032
- Table 115: Rest of Asia Pacific Phytosterols Industry Revenue (Million) Forecast, by Application 2019 & 2032
- Table 116: Rest of Asia Pacific Phytosterols Industry Volume (K Tons) Forecast, by Application 2019 & 2032
- Table 117: Global Phytosterols Industry Revenue Million Forecast, by Product Type 2019 & 2032
- Table 118: Global Phytosterols Industry Volume K Tons Forecast, by Product Type 2019 & 2032
- Table 119: Global Phytosterols Industry Revenue Million Forecast, by Application 2019 & 2032
- Table 120: Global Phytosterols Industry Volume K Tons Forecast, by Application 2019 & 2032
- Table 121: Global Phytosterols Industry Revenue Million Forecast, by Country 2019 & 2032
- Table 122: Global Phytosterols Industry Volume K Tons Forecast, by Country 2019 & 2032
- Table 123: Brazil Phytosterols Industry Revenue (Million) Forecast, by Application 2019 & 2032
- Table 124: Brazil Phytosterols Industry Volume (K Tons) Forecast, by Application 2019 & 2032
- Table 125: Argentina Phytosterols Industry Revenue (Million) Forecast, by Application 2019 & 2032
- Table 126: Argentina Phytosterols Industry Volume (K Tons) Forecast, by Application 2019 & 2032
- Table 127: Rest of South America Phytosterols Industry Revenue (Million) Forecast, by Application 2019 & 2032
- Table 128: Rest of South America Phytosterols Industry Volume (K Tons) Forecast, by Application 2019 & 2032
- Table 129: Global Phytosterols Industry Revenue Million Forecast, by Product Type 2019 & 2032
- Table 130: Global Phytosterols Industry Volume K Tons Forecast, by Product Type 2019 & 2032
- Table 131: Global Phytosterols Industry Revenue Million Forecast, by Application 2019 & 2032
- Table 132: Global Phytosterols Industry Volume K Tons Forecast, by Application 2019 & 2032
- Table 133: Global Phytosterols Industry Revenue Million Forecast, by Country 2019 & 2032
- Table 134: Global Phytosterols Industry Volume K Tons Forecast, by Country 2019 & 2032
- Table 135: Global Phytosterols Industry Revenue Million Forecast, by Product Type 2019 & 2032
- Table 136: Global Phytosterols Industry Volume K Tons Forecast, by Product Type 2019 & 2032
- Table 137: Global Phytosterols Industry Revenue Million Forecast, by Application 2019 & 2032
- Table 138: Global Phytosterols Industry Volume K Tons Forecast, by Application 2019 & 2032
- Table 139: Global Phytosterols Industry Revenue Million Forecast, by Country 2019 & 2032
- Table 140: Global Phytosterols Industry Volume K Tons Forecast, by Country 2019 & 2032
- Table 141: South Africa Phytosterols Industry Revenue (Million) Forecast, by Application 2019 & 2032
- Table 142: South Africa Phytosterols Industry Volume (K Tons) Forecast, by Application 2019 & 2032
- Table 143: Rest of Middle East Phytosterols Industry Revenue (Million) Forecast, by Application 2019 & 2032
- Table 144: Rest of Middle East Phytosterols Industry Volume (K Tons) Forecast, by Application 2019 & 2032
Frequently Asked Questions
1. What is the projected Compound Annual Growth Rate (CAGR) of the Phytosterols Industry?
The projected CAGR is approximately 8.60%.
2. Which companies are prominent players in the Phytosterols Industry?
Key companies in the market include Arboris LLC, Cargill Incorporated, Ashland Global Holdings Inc, Gustav Parmentier GmbH*List Not Exhaustive, Lubrizol Life Science Health, DuPont de Nemours Inc, Archer Daniels Midland Company, BASF SE, Berkshire Hathaway Inc, Merck Group.
3. What are the main segments of the Phytosterols Industry?
The market segments include Product Type, Application.
4. Can you provide details about the market size?
The market size is estimated to be USD 890.2 Million as of 2022.
5. What are some drivers contributing to market growth?
Increasing awareness towards fitness among consumers; Demand for convenient fortified foods.
6. What are the notable trends driving market growth?
Increasing Prevalence of Cardiovascular Disease.
7. Are there any restraints impacting market growth?
Prevalence of allergen intolerance among the consumers.
8. Can you provide examples of recent developments in the market?
June 2022: Kensing LLC, a manufacturer of plant sterols, natural vitamin E, and high-purity surfactants, announced the acquisition of Vitae Naturals, a manufacturer of plant sterol esters and non-GMO vitamin E derivatives which have their applications in skincare, food, and nutrition end-use industry.
9. What pricing options are available for accessing the report?
Pricing options include single-user, multi-user, and enterprise licenses priced at USD 4750, USD 5250, and USD 8750 respectively.
10. Is the market size provided in terms of value or volume?
The market size is provided in terms of value, measured in Million and volume, measured in K Tons.
11. Are there any specific market keywords associated with the report?
Yes, the market keyword associated with the report is "Phytosterols Industry," which aids in identifying and referencing the specific market segment covered.
12. How do I determine which pricing option suits my needs best?
The pricing options vary based on user requirements and access needs. Individual users may opt for single-user licenses, while businesses requiring broader access may choose multi-user or enterprise licenses for cost-effective access to the report.
13. Are there any additional resources or data provided in the Phytosterols Industry report?
While the report offers comprehensive insights, it's advisable to review the specific contents or supplementary materials provided to ascertain if additional resources or data are available.
14. How can I stay updated on further developments or reports in the Phytosterols Industry?
To stay informed about further developments, trends, and reports in the Phytosterols Industry, consider subscribing to industry newsletters, following relevant companies and organizations, or regularly checking reputable industry news sources and publications.
Methodology
Step 1 - Identification of Relevant Samples Size from Population Database


Step 2 - Approaches for Defining Global Market Size (Value, Volume* & Price*)

Note*: In applicable scenarios
Step 3 - Data Sources
Primary Research
- Web Analytics
- Survey Reports
- Research Institute
- Latest Research Reports
- Opinion Leaders
Secondary Research
- Annual Reports
- White Paper
- Latest Press Release
- Industry Association
- Paid Database
- Investor Presentations

Step 4 - Data Triangulation
Involves using different sources of information in order to increase the validity of a study
These sources are likely to be stakeholders in a program - participants, other researchers, program staff, other community members, and so on.
Then we put all data in single framework & apply various statistical tools to find out the dynamic on the market.
During the analysis stage, feedback from the stakeholder groups would be compared to determine areas of agreement as well as areas of divergence


