
Key Insights
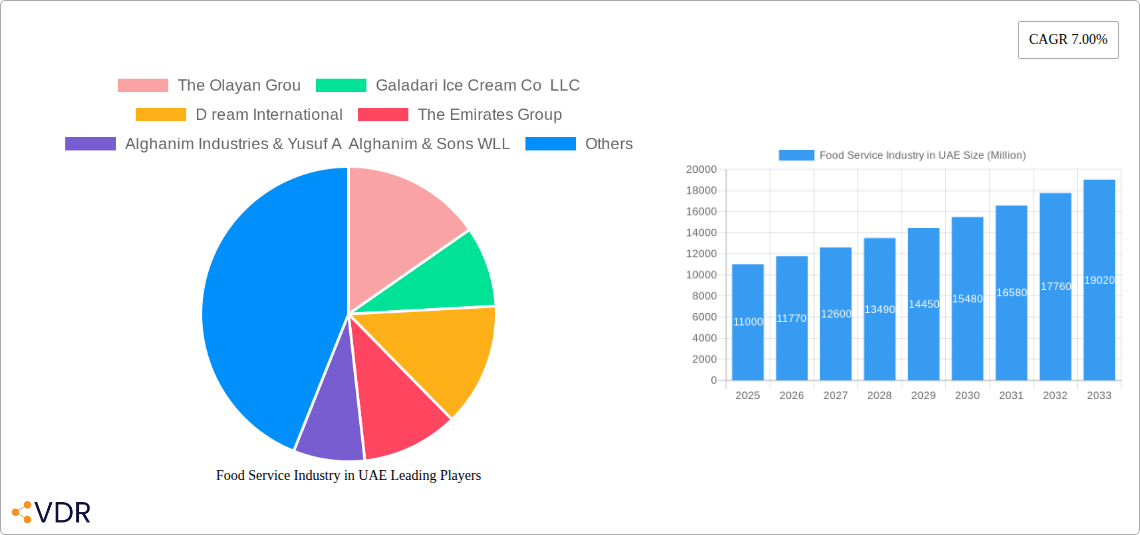
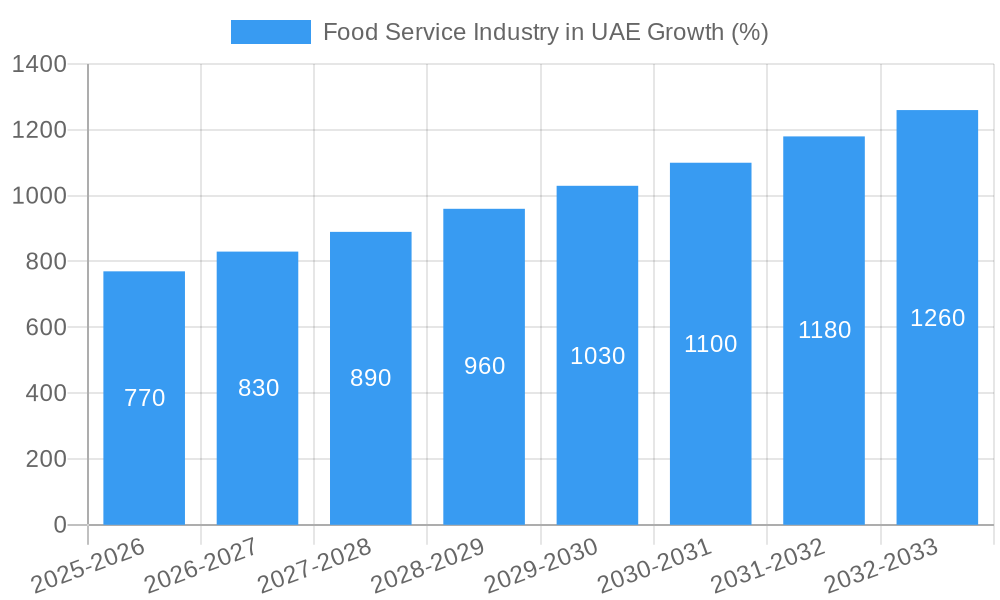
The UAE's food service industry, a dynamic and rapidly expanding sector, is projected to experience robust growth throughout the forecast period (2025-2033). Driven by a burgeoning population, increasing tourism, rising disposable incomes, and a diverse culinary landscape, the market is witnessing significant expansion across various segments. The chained outlet segment currently dominates, leveraging economies of scale and brand recognition to cater to a broad customer base. However, independent outlets are also experiencing growth, fueled by the increasing demand for unique and personalized dining experiences. Location-wise, leisure and tourism hubs, along with retail spaces, represent key areas of growth, while the foodservice type segment demonstrates a strong preference for cafes and bars, and QSR cuisines, reflecting the fast-paced lifestyle of the UAE population. Major players like Americana Restaurants International PLC, M H Alshaya Co WLL, and LuLu Group International are strategically positioning themselves to capture market share through aggressive expansion, innovative offerings, and brand diversification. Factors such as increasing health consciousness and a preference for healthier food options are also influencing consumer choices. The current market size (2025) is estimated to be in the range of $10-12 billion (USD), a projection based on the provided 7% CAGR and considering the current market dynamics in the region. This estimate considers the significant investments in infrastructure, hospitality and tourism ongoing in the UAE.
The projected 7% CAGR suggests substantial opportunities for investors and businesses. However, challenges remain, including the increasing competition, labor costs, and fluctuating food prices. Successful players will need to adapt to evolving consumer preferences, leverage technology for efficiency gains (e.g., online ordering, delivery services), and focus on providing high-quality, consistent service. Specific strategies could include targeted marketing campaigns, loyalty programs, and menu innovation tailored to local tastes and preferences. Growth within the sector is expected to be influenced by government initiatives that support the food and beverage industry, as well as by the success of major events and tourism in the region. The diversity of cuisines offered presents a compelling reason for consistent growth and the ongoing investments in improving the customer experience will be critical in securing ongoing success in this competitive marketplace.
Food Service Industry in UAE: A Comprehensive Market Report (2019-2033)
This comprehensive report provides an in-depth analysis of the Food Service Industry in the UAE, covering market dynamics, growth trends, dominant segments, key players, and future outlook. The study period spans from 2019 to 2033, with 2025 as the base and estimated year. This report is essential for industry professionals, investors, and strategists seeking to understand and capitalize on the UAE's thriving food service sector. The report analyzes the parent market (Food Service) and its various child markets (Cafes & Bars, QSR Cuisines, etc.) to offer a holistic perspective. Market values are presented in millions of units.
Food Service Industry in UAE Market Dynamics & Structure
The UAE's food service industry is characterized by a dynamic interplay of factors influencing its structure and growth. Market concentration is moderate, with a mix of large multinational chains and smaller independent players. Technological innovation, particularly in areas like automation (e.g., robotic solutions like Flippy 2) and digital ordering, is a key driver, though adoption rates vary across segments. The regulatory framework, while generally supportive of business growth, also includes stipulations relating to food safety and hygiene. Competitive substitutes include home-cooked meals and meal delivery services, posing a continuous challenge. End-user demographics show a significant influence of diverse nationalities and evolving consumer preferences, demanding greater variety and customization. M&A activity has been moderate in recent years, with xx deals recorded between 2019 and 2024, indicating consolidation and expansion strategies among key players.
- Market Concentration: Moderate, with both large chains and independent businesses.
- Technological Innovation: Strong driver, particularly in automation and digital ordering.
- Regulatory Framework: Supportive but includes food safety and hygiene regulations.
- Competitive Substitutes: Home-cooked meals and meal delivery services.
- End-User Demographics: Diverse nationalities and evolving consumer preferences.
- M&A Activity: xx deals (2019-2024), indicating ongoing consolidation.
Food Service Industry in UAE Growth Trends & Insights
The UAE's food service market exhibits robust growth, driven by a burgeoning population, rising disposable incomes, and a strong tourism sector. From 2019 to 2024, the market experienced a Compound Annual Growth Rate (CAGR) of xx%, reaching a market size of xx million in 2024. This growth is anticipated to continue, with a projected CAGR of xx% from 2025 to 2033, reaching xx million by 2033. Market penetration for various food service types varies considerably, with QSR chains having high penetration, while specialized cuisines show scope for further expansion. Technological disruptions, such as online ordering platforms and delivery services, have significantly impacted consumer behavior, accelerating convenience and driving demand. Consumer preferences increasingly lean towards healthier options, personalized experiences, and unique culinary offerings.
Dominant Regions, Countries, or Segments in Food Service Industry in UAE
The UAE's food service market shows robust growth across various segments and locations. However, chained outlets hold a significant market share compared to independent outlets, driven by brand recognition, standardized quality, and extensive marketing capabilities. The retail location segment dominates, particularly in urban centers with high foot traffic. In terms of food service type, Other QSR Cuisines show strong growth potential, reflecting consumer demand for diverse culinary experiences.
- Chained Outlets: High market share, driven by brand recognition and scale.
- Retail Locations: Dominant segment due to high foot traffic and accessibility.
- Other QSR Cuisines: Strong growth potential fueled by diverse consumer preferences.
- Key Growth Drivers: Tourism, rising disposable incomes, and population growth.
Food Service Industry in UAE Product Landscape
Product innovation in the UAE's food service sector focuses on enhancing convenience, customization, and health consciousness. This is evident in the rise of personalized meal options, healthier menu choices, and the integration of technology for streamlining ordering and delivery. Furthermore, unique selling propositions often revolve around distinct culinary concepts, brand identities, and loyalty programs. Technological advancements are constantly being integrated to enhance efficiency, reduce costs, and improve the customer experience. Examples include automation technologies used in food preparation and robotic solutions in restaurants.
Key Drivers, Barriers & Challenges in Food Service Industry in UAE
Key Drivers:
- Rising Disposable Incomes: Increased spending on dining experiences.
- Tourism: Significant contribution to food service revenue.
- Technological Advancements: Automation, online ordering, and delivery services.
Challenges & Restraints:
- High Operating Costs: Rent, labor, and food costs impacting profitability.
- Competition: Intense rivalry among various food service providers.
- Regulatory Compliance: Stringent food safety regulations.
- Supply Chain Disruptions: Volatility in food prices and availability.
Emerging Opportunities in Food Service Industry in UAE
Emerging opportunities include the growth of specialized and niche cuisines, the expansion of healthy and sustainable food options, and the integration of technology to enhance customer experience. Untapped markets exist in specific demographic segments and geographical areas. The increasing demand for personalized meal options and experiences presents a significant opportunity for innovation and customization.
Growth Accelerators in the Food Service Industry in UAE Industry
Long-term growth will be fueled by strategic partnerships, investments in technology, and expansion into new markets. Technological breakthroughs in automation and digitalization will further enhance efficiency and reduce operating costs. Strategic alliances with suppliers, technology providers, and marketing firms will strengthen market presence and brand visibility. Expansion into new geographical areas and demographic segments will broaden market reach and customer base.
Key Players Shaping the Food Service Industry in UAE Market
- The Olayan Group
- Galadari Ice Cream Co LLC
- Dream International
- The Emirates Group
- Alghanim Industries & Yusuf A Alghanim & Sons WLL
- Emirates Fast Food Company
- CKE Restaurants Holdings Inc
- Ring International Holding AG
- Deli and Meal LLC
- BinHendi Enterprises
- Americana Restaurants International PLC
- M H Alshaya Co WLL
- LuLu Group International
- Kamal Osman Jamjoom Group LLC
- Apparel Group
- Alamar Foods Company
- JF Street Food
- Al Khaja Group Of Companies
Notable Milestones in Food Service Industry in UAE Sector
- June 2022: Americana Restaurants partnered with Miso Robotics for restaurant automation.
- August 2022: Americana Restaurants secured a franchise agreement with Peet's Coffee for the GCC market.
- December 2022: Americana Restaurants relaunched Wimpy, aiming to become the Middle East's first tech burger brand using Flippy 2 robotics.
In-Depth Food Service Industry in UAE Market Outlook
The UAE's food service industry is poised for continued strong growth, driven by factors such as population growth, increasing disposable incomes, and evolving consumer preferences. Strategic opportunities lie in leveraging technology for efficiency gains, focusing on health and sustainability, and expanding into underserved markets. The sector's future success hinges on adapting to evolving consumer demands, embracing technological advancements, and maintaining a competitive edge through innovation and strategic partnerships.
Food Service Industry in UAE Segmentation
-
1. Foodservice Type
-
1.1. Cafes & Bars
-
1.1.1. By Cuisine
- 1.1.1.1. Bars & Pubs
- 1.1.1.2. Juice/Smoothie/Desserts Bars
- 1.1.1.3. Specialist Coffee & Tea Shops
-
1.1.1. By Cuisine
- 1.2. Cloud Kitchen
-
1.3. Full Service Restaurants
- 1.3.1. Asian
- 1.3.2. European
- 1.3.3. Latin American
- 1.3.4. Middle Eastern
- 1.3.5. North American
- 1.3.6. Other FSR Cuisines
-
1.4. Quick Service Restaurants
- 1.4.1. Bakeries
- 1.4.2. Burger
- 1.4.3. Ice Cream
- 1.4.4. Meat-based Cuisines
- 1.4.5. Pizza
- 1.4.6. Other QSR Cuisines
-
1.1. Cafes & Bars
-
2. Outlet
- 2.1. Chained Outlets
- 2.2. Independent Outlets
-
3. Location
- 3.1. Leisure
- 3.2. Lodging
- 3.3. Retail
- 3.4. Standalone
- 3.5. Travel
Food Service Industry in UAE Segmentation By Geography
-
1. North America
- 1.1. United States
- 1.2. Canada
- 1.3. Mexico
-
2. South America
- 2.1. Brazil
- 2.2. Argentina
- 2.3. Rest of South America
-
3. Europe
- 3.1. United Kingdom
- 3.2. Germany
- 3.3. France
- 3.4. Italy
- 3.5. Spain
- 3.6. Russia
- 3.7. Benelux
- 3.8. Nordics
- 3.9. Rest of Europe
-
4. Middle East & Africa
- 4.1. Turkey
- 4.2. Israel
- 4.3. GCC
- 4.4. North Africa
- 4.5. South Africa
- 4.6. Rest of Middle East & Africa
-
5. Asia Pacific
- 5.1. China
- 5.2. India
- 5.3. Japan
- 5.4. South Korea
- 5.5. ASEAN
- 5.6. Oceania
- 5.7. Rest of Asia Pacific
Food Service Industry in UAE REPORT HIGHLIGHTS
| Aspects | Details |
|---|---|
| Study Period | 2019-2033 |
| Base Year | 2024 |
| Estimated Year | 2025 |
| Forecast Period | 2025-2033 |
| Historical Period | 2019-2024 |
| Growth Rate | CAGR of 7.00% from 2019-2033 |
| Segmentation |
|
Table of Contents
- 1. Introduction
- 1.1. Research Scope
- 1.2. Market Segmentation
- 1.3. Research Methodology
- 1.4. Definitions and Assumptions
- 2. Executive Summary
- 2.1. Introduction
- 3. Market Dynamics
- 3.1. Introduction
- 3.2. Market Drivers
- 3.2.1. Consumer inclination toward functional food and beverages; Increasing Number of Applications and Growing Industrial Use
- 3.3. Market Restrains
- 3.3.1. Increasing Shift Toward Plant-Based Protein
- 3.4. Market Trends
- 3.4.1. The high ex-pat population in the country and the rise in online food delivery are fuelling the market growth
- 4. Market Factor Analysis
- 4.1. Porters Five Forces
- 4.2. Supply/Value Chain
- 4.3. PESTEL analysis
- 4.4. Market Entropy
- 4.5. Patent/Trademark Analysis
- 5. Global Food Service Industry in UAE Analysis, Insights and Forecast, 2019-2031
- 5.1. Market Analysis, Insights and Forecast - by Foodservice Type
- 5.1.1. Cafes & Bars
- 5.1.1.1. By Cuisine
- 5.1.1.1.1. Bars & Pubs
- 5.1.1.1.2. Juice/Smoothie/Desserts Bars
- 5.1.1.1.3. Specialist Coffee & Tea Shops
- 5.1.1.1. By Cuisine
- 5.1.2. Cloud Kitchen
- 5.1.3. Full Service Restaurants
- 5.1.3.1. Asian
- 5.1.3.2. European
- 5.1.3.3. Latin American
- 5.1.3.4. Middle Eastern
- 5.1.3.5. North American
- 5.1.3.6. Other FSR Cuisines
- 5.1.4. Quick Service Restaurants
- 5.1.4.1. Bakeries
- 5.1.4.2. Burger
- 5.1.4.3. Ice Cream
- 5.1.4.4. Meat-based Cuisines
- 5.1.4.5. Pizza
- 5.1.4.6. Other QSR Cuisines
- 5.1.1. Cafes & Bars
- 5.2. Market Analysis, Insights and Forecast - by Outlet
- 5.2.1. Chained Outlets
- 5.2.2. Independent Outlets
- 5.3. Market Analysis, Insights and Forecast - by Location
- 5.3.1. Leisure
- 5.3.2. Lodging
- 5.3.3. Retail
- 5.3.4. Standalone
- 5.3.5. Travel
- 5.4. Market Analysis, Insights and Forecast - by Region
- 5.4.1. North America
- 5.4.2. South America
- 5.4.3. Europe
- 5.4.4. Middle East & Africa
- 5.4.5. Asia Pacific
- 5.1. Market Analysis, Insights and Forecast - by Foodservice Type
- 6. North America Food Service Industry in UAE Analysis, Insights and Forecast, 2019-2031
- 6.1. Market Analysis, Insights and Forecast - by Foodservice Type
- 6.1.1. Cafes & Bars
- 6.1.1.1. By Cuisine
- 6.1.1.1.1. Bars & Pubs
- 6.1.1.1.2. Juice/Smoothie/Desserts Bars
- 6.1.1.1.3. Specialist Coffee & Tea Shops
- 6.1.1.1. By Cuisine
- 6.1.2. Cloud Kitchen
- 6.1.3. Full Service Restaurants
- 6.1.3.1. Asian
- 6.1.3.2. European
- 6.1.3.3. Latin American
- 6.1.3.4. Middle Eastern
- 6.1.3.5. North American
- 6.1.3.6. Other FSR Cuisines
- 6.1.4. Quick Service Restaurants
- 6.1.4.1. Bakeries
- 6.1.4.2. Burger
- 6.1.4.3. Ice Cream
- 6.1.4.4. Meat-based Cuisines
- 6.1.4.5. Pizza
- 6.1.4.6. Other QSR Cuisines
- 6.1.1. Cafes & Bars
- 6.2. Market Analysis, Insights and Forecast - by Outlet
- 6.2.1. Chained Outlets
- 6.2.2. Independent Outlets
- 6.3. Market Analysis, Insights and Forecast - by Location
- 6.3.1. Leisure
- 6.3.2. Lodging
- 6.3.3. Retail
- 6.3.4. Standalone
- 6.3.5. Travel
- 6.1. Market Analysis, Insights and Forecast - by Foodservice Type
- 7. South America Food Service Industry in UAE Analysis, Insights and Forecast, 2019-2031
- 7.1. Market Analysis, Insights and Forecast - by Foodservice Type
- 7.1.1. Cafes & Bars
- 7.1.1.1. By Cuisine
- 7.1.1.1.1. Bars & Pubs
- 7.1.1.1.2. Juice/Smoothie/Desserts Bars
- 7.1.1.1.3. Specialist Coffee & Tea Shops
- 7.1.1.1. By Cuisine
- 7.1.2. Cloud Kitchen
- 7.1.3. Full Service Restaurants
- 7.1.3.1. Asian
- 7.1.3.2. European
- 7.1.3.3. Latin American
- 7.1.3.4. Middle Eastern
- 7.1.3.5. North American
- 7.1.3.6. Other FSR Cuisines
- 7.1.4. Quick Service Restaurants
- 7.1.4.1. Bakeries
- 7.1.4.2. Burger
- 7.1.4.3. Ice Cream
- 7.1.4.4. Meat-based Cuisines
- 7.1.4.5. Pizza
- 7.1.4.6. Other QSR Cuisines
- 7.1.1. Cafes & Bars
- 7.2. Market Analysis, Insights and Forecast - by Outlet
- 7.2.1. Chained Outlets
- 7.2.2. Independent Outlets
- 7.3. Market Analysis, Insights and Forecast - by Location
- 7.3.1. Leisure
- 7.3.2. Lodging
- 7.3.3. Retail
- 7.3.4. Standalone
- 7.3.5. Travel
- 7.1. Market Analysis, Insights and Forecast - by Foodservice Type
- 8. Europe Food Service Industry in UAE Analysis, Insights and Forecast, 2019-2031
- 8.1. Market Analysis, Insights and Forecast - by Foodservice Type
- 8.1.1. Cafes & Bars
- 8.1.1.1. By Cuisine
- 8.1.1.1.1. Bars & Pubs
- 8.1.1.1.2. Juice/Smoothie/Desserts Bars
- 8.1.1.1.3. Specialist Coffee & Tea Shops
- 8.1.1.1. By Cuisine
- 8.1.2. Cloud Kitchen
- 8.1.3. Full Service Restaurants
- 8.1.3.1. Asian
- 8.1.3.2. European
- 8.1.3.3. Latin American
- 8.1.3.4. Middle Eastern
- 8.1.3.5. North American
- 8.1.3.6. Other FSR Cuisines
- 8.1.4. Quick Service Restaurants
- 8.1.4.1. Bakeries
- 8.1.4.2. Burger
- 8.1.4.3. Ice Cream
- 8.1.4.4. Meat-based Cuisines
- 8.1.4.5. Pizza
- 8.1.4.6. Other QSR Cuisines
- 8.1.1. Cafes & Bars
- 8.2. Market Analysis, Insights and Forecast - by Outlet
- 8.2.1. Chained Outlets
- 8.2.2. Independent Outlets
- 8.3. Market Analysis, Insights and Forecast - by Location
- 8.3.1. Leisure
- 8.3.2. Lodging
- 8.3.3. Retail
- 8.3.4. Standalone
- 8.3.5. Travel
- 8.1. Market Analysis, Insights and Forecast - by Foodservice Type
- 9. Middle East & Africa Food Service Industry in UAE Analysis, Insights and Forecast, 2019-2031
- 9.1. Market Analysis, Insights and Forecast - by Foodservice Type
- 9.1.1. Cafes & Bars
- 9.1.1.1. By Cuisine
- 9.1.1.1.1. Bars & Pubs
- 9.1.1.1.2. Juice/Smoothie/Desserts Bars
- 9.1.1.1.3. Specialist Coffee & Tea Shops
- 9.1.1.1. By Cuisine
- 9.1.2. Cloud Kitchen
- 9.1.3. Full Service Restaurants
- 9.1.3.1. Asian
- 9.1.3.2. European
- 9.1.3.3. Latin American
- 9.1.3.4. Middle Eastern
- 9.1.3.5. North American
- 9.1.3.6. Other FSR Cuisines
- 9.1.4. Quick Service Restaurants
- 9.1.4.1. Bakeries
- 9.1.4.2. Burger
- 9.1.4.3. Ice Cream
- 9.1.4.4. Meat-based Cuisines
- 9.1.4.5. Pizza
- 9.1.4.6. Other QSR Cuisines
- 9.1.1. Cafes & Bars
- 9.2. Market Analysis, Insights and Forecast - by Outlet
- 9.2.1. Chained Outlets
- 9.2.2. Independent Outlets
- 9.3. Market Analysis, Insights and Forecast - by Location
- 9.3.1. Leisure
- 9.3.2. Lodging
- 9.3.3. Retail
- 9.3.4. Standalone
- 9.3.5. Travel
- 9.1. Market Analysis, Insights and Forecast - by Foodservice Type
- 10. Asia Pacific Food Service Industry in UAE Analysis, Insights and Forecast, 2019-2031
- 10.1. Market Analysis, Insights and Forecast - by Foodservice Type
- 10.1.1. Cafes & Bars
- 10.1.1.1. By Cuisine
- 10.1.1.1.1. Bars & Pubs
- 10.1.1.1.2. Juice/Smoothie/Desserts Bars
- 10.1.1.1.3. Specialist Coffee & Tea Shops
- 10.1.1.1. By Cuisine
- 10.1.2. Cloud Kitchen
- 10.1.3. Full Service Restaurants
- 10.1.3.1. Asian
- 10.1.3.2. European
- 10.1.3.3. Latin American
- 10.1.3.4. Middle Eastern
- 10.1.3.5. North American
- 10.1.3.6. Other FSR Cuisines
- 10.1.4. Quick Service Restaurants
- 10.1.4.1. Bakeries
- 10.1.4.2. Burger
- 10.1.4.3. Ice Cream
- 10.1.4.4. Meat-based Cuisines
- 10.1.4.5. Pizza
- 10.1.4.6. Other QSR Cuisines
- 10.1.1. Cafes & Bars
- 10.2. Market Analysis, Insights and Forecast - by Outlet
- 10.2.1. Chained Outlets
- 10.2.2. Independent Outlets
- 10.3. Market Analysis, Insights and Forecast - by Location
- 10.3.1. Leisure
- 10.3.2. Lodging
- 10.3.3. Retail
- 10.3.4. Standalone
- 10.3.5. Travel
- 10.1. Market Analysis, Insights and Forecast - by Foodservice Type
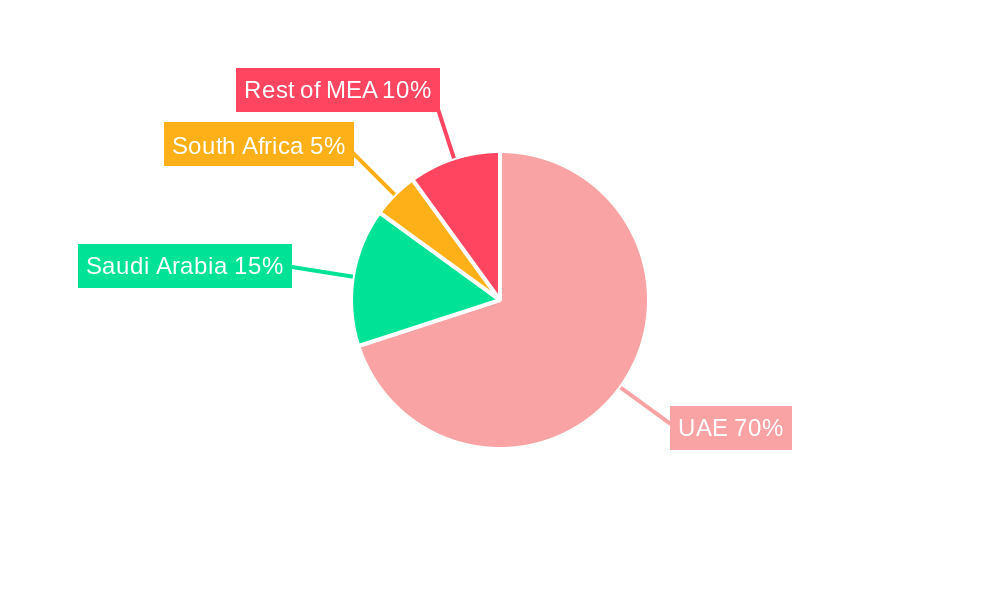
- 11. UAE Food Service Industry in UAE Analysis, Insights and Forecast, 2019-2031
- 12. South Africa Food Service Industry in UAE Analysis, Insights and Forecast, 2019-2031
- 13. Saudi Arabia Food Service Industry in UAE Analysis, Insights and Forecast, 2019-2031
- 14. Rest of MEA Food Service Industry in UAE Analysis, Insights and Forecast, 2019-2031
- 15. Competitive Analysis
- 15.1. Global Market Share Analysis 2024
- 15.2. Company Profiles
- 15.2.1 The Olayan Grou
- 15.2.1.1. Overview
- 15.2.1.2. Products
- 15.2.1.3. SWOT Analysis
- 15.2.1.4. Recent Developments
- 15.2.1.5. Financials (Based on Availability)
- 15.2.2 Galadari Ice Cream Co LLC
- 15.2.2.1. Overview
- 15.2.2.2. Products
- 15.2.2.3. SWOT Analysis
- 15.2.2.4. Recent Developments
- 15.2.2.5. Financials (Based on Availability)
- 15.2.3 D ream International
- 15.2.3.1. Overview
- 15.2.3.2. Products
- 15.2.3.3. SWOT Analysis
- 15.2.3.4. Recent Developments
- 15.2.3.5. Financials (Based on Availability)
- 15.2.4 The Emirates Group
- 15.2.4.1. Overview
- 15.2.4.2. Products
- 15.2.4.3. SWOT Analysis
- 15.2.4.4. Recent Developments
- 15.2.4.5. Financials (Based on Availability)
- 15.2.5 Alghanim Industries & Yusuf A Alghanim & Sons WLL
- 15.2.5.1. Overview
- 15.2.5.2. Products
- 15.2.5.3. SWOT Analysis
- 15.2.5.4. Recent Developments
- 15.2.5.5. Financials (Based on Availability)
- 15.2.6 Emirates Fast Food Company
- 15.2.6.1. Overview
- 15.2.6.2. Products
- 15.2.6.3. SWOT Analysis
- 15.2.6.4. Recent Developments
- 15.2.6.5. Financials (Based on Availability)
- 15.2.7 CKE Restaurants Holdings Inc
- 15.2.7.1. Overview
- 15.2.7.2. Products
- 15.2.7.3. SWOT Analysis
- 15.2.7.4. Recent Developments
- 15.2.7.5. Financials (Based on Availability)
- 15.2.8 Ring International Holding AG
- 15.2.8.1. Overview
- 15.2.8.2. Products
- 15.2.8.3. SWOT Analysis
- 15.2.8.4. Recent Developments
- 15.2.8.5. Financials (Based on Availability)
- 15.2.9 Deli and Meal LLC
- 15.2.9.1. Overview
- 15.2.9.2. Products
- 15.2.9.3. SWOT Analysis
- 15.2.9.4. Recent Developments
- 15.2.9.5. Financials (Based on Availability)
- 15.2.10 BinHendi Enterprises
- 15.2.10.1. Overview
- 15.2.10.2. Products
- 15.2.10.3. SWOT Analysis
- 15.2.10.4. Recent Developments
- 15.2.10.5. Financials (Based on Availability)
- 15.2.11 Americana Restaurants International PLC
- 15.2.11.1. Overview
- 15.2.11.2. Products
- 15.2.11.3. SWOT Analysis
- 15.2.11.4. Recent Developments
- 15.2.11.5. Financials (Based on Availability)
- 15.2.12 M H Alshaya Co WLL
- 15.2.12.1. Overview
- 15.2.12.2. Products
- 15.2.12.3. SWOT Analysis
- 15.2.12.4. Recent Developments
- 15.2.12.5. Financials (Based on Availability)
- 15.2.13 LuLu Group International
- 15.2.13.1. Overview
- 15.2.13.2. Products
- 15.2.13.3. SWOT Analysis
- 15.2.13.4. Recent Developments
- 15.2.13.5. Financials (Based on Availability)
- 15.2.14 Kamal Osman Jamjoom Group LLC
- 15.2.14.1. Overview
- 15.2.14.2. Products
- 15.2.14.3. SWOT Analysis
- 15.2.14.4. Recent Developments
- 15.2.14.5. Financials (Based on Availability)
- 15.2.15 Apparel Group
- 15.2.15.1. Overview
- 15.2.15.2. Products
- 15.2.15.3. SWOT Analysis
- 15.2.15.4. Recent Developments
- 15.2.15.5. Financials (Based on Availability)
- 15.2.16 Alamar Foods Company
- 15.2.16.1. Overview
- 15.2.16.2. Products
- 15.2.16.3. SWOT Analysis
- 15.2.16.4. Recent Developments
- 15.2.16.5. Financials (Based on Availability)
- 15.2.17 JF Street Food
- 15.2.17.1. Overview
- 15.2.17.2. Products
- 15.2.17.3. SWOT Analysis
- 15.2.17.4. Recent Developments
- 15.2.17.5. Financials (Based on Availability)
- 15.2.18 Al Khaja Group Of Companies
- 15.2.18.1. Overview
- 15.2.18.2. Products
- 15.2.18.3. SWOT Analysis
- 15.2.18.4. Recent Developments
- 15.2.18.5. Financials (Based on Availability)
- 15.2.1 The Olayan Grou
List of Figures
- Figure 1: Global Food Service Industry in UAE Revenue Breakdown (Million, %) by Region 2024 & 2032
- Figure 2: Global Food Service Industry in UAE Volume Breakdown (Thousand Tons, %) by Region 2024 & 2032
- Figure 3: Middle East & Africa Food Service Industry in UAE Revenue (Million), by Country 2024 & 2032
- Figure 4: Middle East & Africa Food Service Industry in UAE Volume (Thousand Tons), by Country 2024 & 2032
- Figure 5: Middle East & Africa Food Service Industry in UAE Revenue Share (%), by Country 2024 & 2032
- Figure 6: Middle East & Africa Food Service Industry in UAE Volume Share (%), by Country 2024 & 2032
- Figure 7: North America Food Service Industry in UAE Revenue (Million), by Foodservice Type 2024 & 2032
- Figure 8: North America Food Service Industry in UAE Volume (Thousand Tons), by Foodservice Type 2024 & 2032
- Figure 9: North America Food Service Industry in UAE Revenue Share (%), by Foodservice Type 2024 & 2032
- Figure 10: North America Food Service Industry in UAE Volume Share (%), by Foodservice Type 2024 & 2032
- Figure 11: North America Food Service Industry in UAE Revenue (Million), by Outlet 2024 & 2032
- Figure 12: North America Food Service Industry in UAE Volume (Thousand Tons), by Outlet 2024 & 2032
- Figure 13: North America Food Service Industry in UAE Revenue Share (%), by Outlet 2024 & 2032
- Figure 14: North America Food Service Industry in UAE Volume Share (%), by Outlet 2024 & 2032
- Figure 15: North America Food Service Industry in UAE Revenue (Million), by Location 2024 & 2032
- Figure 16: North America Food Service Industry in UAE Volume (Thousand Tons), by Location 2024 & 2032
- Figure 17: North America Food Service Industry in UAE Revenue Share (%), by Location 2024 & 2032
- Figure 18: North America Food Service Industry in UAE Volume Share (%), by Location 2024 & 2032
- Figure 19: North America Food Service Industry in UAE Revenue (Million), by Country 2024 & 2032
- Figure 20: North America Food Service Industry in UAE Volume (Thousand Tons), by Country 2024 & 2032
- Figure 21: North America Food Service Industry in UAE Revenue Share (%), by Country 2024 & 2032
- Figure 22: North America Food Service Industry in UAE Volume Share (%), by Country 2024 & 2032
- Figure 23: South America Food Service Industry in UAE Revenue (Million), by Foodservice Type 2024 & 2032
- Figure 24: South America Food Service Industry in UAE Volume (Thousand Tons), by Foodservice Type 2024 & 2032
- Figure 25: South America Food Service Industry in UAE Revenue Share (%), by Foodservice Type 2024 & 2032
- Figure 26: South America Food Service Industry in UAE Volume Share (%), by Foodservice Type 2024 & 2032
- Figure 27: South America Food Service Industry in UAE Revenue (Million), by Outlet 2024 & 2032
- Figure 28: South America Food Service Industry in UAE Volume (Thousand Tons), by Outlet 2024 & 2032
- Figure 29: South America Food Service Industry in UAE Revenue Share (%), by Outlet 2024 & 2032
- Figure 30: South America Food Service Industry in UAE Volume Share (%), by Outlet 2024 & 2032
- Figure 31: South America Food Service Industry in UAE Revenue (Million), by Location 2024 & 2032
- Figure 32: South America Food Service Industry in UAE Volume (Thousand Tons), by Location 2024 & 2032
- Figure 33: South America Food Service Industry in UAE Revenue Share (%), by Location 2024 & 2032
- Figure 34: South America Food Service Industry in UAE Volume Share (%), by Location 2024 & 2032
- Figure 35: South America Food Service Industry in UAE Revenue (Million), by Country 2024 & 2032
- Figure 36: South America Food Service Industry in UAE Volume (Thousand Tons), by Country 2024 & 2032
- Figure 37: South America Food Service Industry in UAE Revenue Share (%), by Country 2024 & 2032
- Figure 38: South America Food Service Industry in UAE Volume Share (%), by Country 2024 & 2032
- Figure 39: Europe Food Service Industry in UAE Revenue (Million), by Foodservice Type 2024 & 2032
- Figure 40: Europe Food Service Industry in UAE Volume (Thousand Tons), by Foodservice Type 2024 & 2032
- Figure 41: Europe Food Service Industry in UAE Revenue Share (%), by Foodservice Type 2024 & 2032
- Figure 42: Europe Food Service Industry in UAE Volume Share (%), by Foodservice Type 2024 & 2032
- Figure 43: Europe Food Service Industry in UAE Revenue (Million), by Outlet 2024 & 2032
- Figure 44: Europe Food Service Industry in UAE Volume (Thousand Tons), by Outlet 2024 & 2032
- Figure 45: Europe Food Service Industry in UAE Revenue Share (%), by Outlet 2024 & 2032
- Figure 46: Europe Food Service Industry in UAE Volume Share (%), by Outlet 2024 & 2032
- Figure 47: Europe Food Service Industry in UAE Revenue (Million), by Location 2024 & 2032
- Figure 48: Europe Food Service Industry in UAE Volume (Thousand Tons), by Location 2024 & 2032
- Figure 49: Europe Food Service Industry in UAE Revenue Share (%), by Location 2024 & 2032
- Figure 50: Europe Food Service Industry in UAE Volume Share (%), by Location 2024 & 2032
- Figure 51: Europe Food Service Industry in UAE Revenue (Million), by Country 2024 & 2032
- Figure 52: Europe Food Service Industry in UAE Volume (Thousand Tons), by Country 2024 & 2032
- Figure 53: Europe Food Service Industry in UAE Revenue Share (%), by Country 2024 & 2032
- Figure 54: Europe Food Service Industry in UAE Volume Share (%), by Country 2024 & 2032
- Figure 55: Middle East & Africa Food Service Industry in UAE Revenue (Million), by Foodservice Type 2024 & 2032
- Figure 56: Middle East & Africa Food Service Industry in UAE Volume (Thousand Tons), by Foodservice Type 2024 & 2032
- Figure 57: Middle East & Africa Food Service Industry in UAE Revenue Share (%), by Foodservice Type 2024 & 2032
- Figure 58: Middle East & Africa Food Service Industry in UAE Volume Share (%), by Foodservice Type 2024 & 2032
- Figure 59: Middle East & Africa Food Service Industry in UAE Revenue (Million), by Outlet 2024 & 2032
- Figure 60: Middle East & Africa Food Service Industry in UAE Volume (Thousand Tons), by Outlet 2024 & 2032
- Figure 61: Middle East & Africa Food Service Industry in UAE Revenue Share (%), by Outlet 2024 & 2032
- Figure 62: Middle East & Africa Food Service Industry in UAE Volume Share (%), by Outlet 2024 & 2032
- Figure 63: Middle East & Africa Food Service Industry in UAE Revenue (Million), by Location 2024 & 2032
- Figure 64: Middle East & Africa Food Service Industry in UAE Volume (Thousand Tons), by Location 2024 & 2032
- Figure 65: Middle East & Africa Food Service Industry in UAE Revenue Share (%), by Location 2024 & 2032
- Figure 66: Middle East & Africa Food Service Industry in UAE Volume Share (%), by Location 2024 & 2032
- Figure 67: Middle East & Africa Food Service Industry in UAE Revenue (Million), by Country 2024 & 2032
- Figure 68: Middle East & Africa Food Service Industry in UAE Volume (Thousand Tons), by Country 2024 & 2032
- Figure 69: Middle East & Africa Food Service Industry in UAE Revenue Share (%), by Country 2024 & 2032
- Figure 70: Middle East & Africa Food Service Industry in UAE Volume Share (%), by Country 2024 & 2032
- Figure 71: Asia Pacific Food Service Industry in UAE Revenue (Million), by Foodservice Type 2024 & 2032
- Figure 72: Asia Pacific Food Service Industry in UAE Volume (Thousand Tons), by Foodservice Type 2024 & 2032
- Figure 73: Asia Pacific Food Service Industry in UAE Revenue Share (%), by Foodservice Type 2024 & 2032
- Figure 74: Asia Pacific Food Service Industry in UAE Volume Share (%), by Foodservice Type 2024 & 2032
- Figure 75: Asia Pacific Food Service Industry in UAE Revenue (Million), by Outlet 2024 & 2032
- Figure 76: Asia Pacific Food Service Industry in UAE Volume (Thousand Tons), by Outlet 2024 & 2032
- Figure 77: Asia Pacific Food Service Industry in UAE Revenue Share (%), by Outlet 2024 & 2032
- Figure 78: Asia Pacific Food Service Industry in UAE Volume Share (%), by Outlet 2024 & 2032
- Figure 79: Asia Pacific Food Service Industry in UAE Revenue (Million), by Location 2024 & 2032
- Figure 80: Asia Pacific Food Service Industry in UAE Volume (Thousand Tons), by Location 2024 & 2032
- Figure 81: Asia Pacific Food Service Industry in UAE Revenue Share (%), by Location 2024 & 2032
- Figure 82: Asia Pacific Food Service Industry in UAE Volume Share (%), by Location 2024 & 2032
- Figure 83: Asia Pacific Food Service Industry in UAE Revenue (Million), by Country 2024 & 2032
- Figure 84: Asia Pacific Food Service Industry in UAE Volume (Thousand Tons), by Country 2024 & 2032
- Figure 85: Asia Pacific Food Service Industry in UAE Revenue Share (%), by Country 2024 & 2032
- Figure 86: Asia Pacific Food Service Industry in UAE Volume Share (%), by Country 2024 & 2032
List of Tables
- Table 1: Global Food Service Industry in UAE Revenue Million Forecast, by Region 2019 & 2032
- Table 2: Global Food Service Industry in UAE Volume Thousand Tons Forecast, by Region 2019 & 2032
- Table 3: Global Food Service Industry in UAE Revenue Million Forecast, by Foodservice Type 2019 & 2032
- Table 4: Global Food Service Industry in UAE Volume Thousand Tons Forecast, by Foodservice Type 2019 & 2032
- Table 5: Global Food Service Industry in UAE Revenue Million Forecast, by Outlet 2019 & 2032
- Table 6: Global Food Service Industry in UAE Volume Thousand Tons Forecast, by Outlet 2019 & 2032
- Table 7: Global Food Service Industry in UAE Revenue Million Forecast, by Location 2019 & 2032
- Table 8: Global Food Service Industry in UAE Volume Thousand Tons Forecast, by Location 2019 & 2032
- Table 9: Global Food Service Industry in UAE Revenue Million Forecast, by Region 2019 & 2032
- Table 10: Global Food Service Industry in UAE Volume Thousand Tons Forecast, by Region 2019 & 2032
- Table 11: Global Food Service Industry in UAE Revenue Million Forecast, by Country 2019 & 2032
- Table 12: Global Food Service Industry in UAE Volume Thousand Tons Forecast, by Country 2019 & 2032
- Table 13: UAE Food Service Industry in UAE Revenue (Million) Forecast, by Application 2019 & 2032
- Table 14: UAE Food Service Industry in UAE Volume (Thousand Tons) Forecast, by Application 2019 & 2032
- Table 15: South Africa Food Service Industry in UAE Revenue (Million) Forecast, by Application 2019 & 2032
- Table 16: South Africa Food Service Industry in UAE Volume (Thousand Tons) Forecast, by Application 2019 & 2032
- Table 17: Saudi Arabia Food Service Industry in UAE Revenue (Million) Forecast, by Application 2019 & 2032
- Table 18: Saudi Arabia Food Service Industry in UAE Volume (Thousand Tons) Forecast, by Application 2019 & 2032
- Table 19: Rest of MEA Food Service Industry in UAE Revenue (Million) Forecast, by Application 2019 & 2032
- Table 20: Rest of MEA Food Service Industry in UAE Volume (Thousand Tons) Forecast, by Application 2019 & 2032
- Table 21: Global Food Service Industry in UAE Revenue Million Forecast, by Foodservice Type 2019 & 2032
- Table 22: Global Food Service Industry in UAE Volume Thousand Tons Forecast, by Foodservice Type 2019 & 2032
- Table 23: Global Food Service Industry in UAE Revenue Million Forecast, by Outlet 2019 & 2032
- Table 24: Global Food Service Industry in UAE Volume Thousand Tons Forecast, by Outlet 2019 & 2032
- Table 25: Global Food Service Industry in UAE Revenue Million Forecast, by Location 2019 & 2032
- Table 26: Global Food Service Industry in UAE Volume Thousand Tons Forecast, by Location 2019 & 2032
- Table 27: Global Food Service Industry in UAE Revenue Million Forecast, by Country 2019 & 2032
- Table 28: Global Food Service Industry in UAE Volume Thousand Tons Forecast, by Country 2019 & 2032
- Table 29: United States Food Service Industry in UAE Revenue (Million) Forecast, by Application 2019 & 2032
- Table 30: United States Food Service Industry in UAE Volume (Thousand Tons) Forecast, by Application 2019 & 2032
- Table 31: Canada Food Service Industry in UAE Revenue (Million) Forecast, by Application 2019 & 2032
- Table 32: Canada Food Service Industry in UAE Volume (Thousand Tons) Forecast, by Application 2019 & 2032
- Table 33: Mexico Food Service Industry in UAE Revenue (Million) Forecast, by Application 2019 & 2032
- Table 34: Mexico Food Service Industry in UAE Volume (Thousand Tons) Forecast, by Application 2019 & 2032
- Table 35: Global Food Service Industry in UAE Revenue Million Forecast, by Foodservice Type 2019 & 2032
- Table 36: Global Food Service Industry in UAE Volume Thousand Tons Forecast, by Foodservice Type 2019 & 2032
- Table 37: Global Food Service Industry in UAE Revenue Million Forecast, by Outlet 2019 & 2032
- Table 38: Global Food Service Industry in UAE Volume Thousand Tons Forecast, by Outlet 2019 & 2032
- Table 39: Global Food Service Industry in UAE Revenue Million Forecast, by Location 2019 & 2032
- Table 40: Global Food Service Industry in UAE Volume Thousand Tons Forecast, by Location 2019 & 2032
- Table 41: Global Food Service Industry in UAE Revenue Million Forecast, by Country 2019 & 2032
- Table 42: Global Food Service Industry in UAE Volume Thousand Tons Forecast, by Country 2019 & 2032
- Table 43: Brazil Food Service Industry in UAE Revenue (Million) Forecast, by Application 2019 & 2032
- Table 44: Brazil Food Service Industry in UAE Volume (Thousand Tons) Forecast, by Application 2019 & 2032
- Table 45: Argentina Food Service Industry in UAE Revenue (Million) Forecast, by Application 2019 & 2032
- Table 46: Argentina Food Service Industry in UAE Volume (Thousand Tons) Forecast, by Application 2019 & 2032
- Table 47: Rest of South America Food Service Industry in UAE Revenue (Million) Forecast, by Application 2019 & 2032
- Table 48: Rest of South America Food Service Industry in UAE Volume (Thousand Tons) Forecast, by Application 2019 & 2032
- Table 49: Global Food Service Industry in UAE Revenue Million Forecast, by Foodservice Type 2019 & 2032
- Table 50: Global Food Service Industry in UAE Volume Thousand Tons Forecast, by Foodservice Type 2019 & 2032
- Table 51: Global Food Service Industry in UAE Revenue Million Forecast, by Outlet 2019 & 2032
- Table 52: Global Food Service Industry in UAE Volume Thousand Tons Forecast, by Outlet 2019 & 2032
- Table 53: Global Food Service Industry in UAE Revenue Million Forecast, by Location 2019 & 2032
- Table 54: Global Food Service Industry in UAE Volume Thousand Tons Forecast, by Location 2019 & 2032
- Table 55: Global Food Service Industry in UAE Revenue Million Forecast, by Country 2019 & 2032
- Table 56: Global Food Service Industry in UAE Volume Thousand Tons Forecast, by Country 2019 & 2032
- Table 57: United Kingdom Food Service Industry in UAE Revenue (Million) Forecast, by Application 2019 & 2032
- Table 58: United Kingdom Food Service Industry in UAE Volume (Thousand Tons) Forecast, by Application 2019 & 2032
- Table 59: Germany Food Service Industry in UAE Revenue (Million) Forecast, by Application 2019 & 2032
- Table 60: Germany Food Service Industry in UAE Volume (Thousand Tons) Forecast, by Application 2019 & 2032
- Table 61: France Food Service Industry in UAE Revenue (Million) Forecast, by Application 2019 & 2032
- Table 62: France Food Service Industry in UAE Volume (Thousand Tons) Forecast, by Application 2019 & 2032
- Table 63: Italy Food Service Industry in UAE Revenue (Million) Forecast, by Application 2019 & 2032
- Table 64: Italy Food Service Industry in UAE Volume (Thousand Tons) Forecast, by Application 2019 & 2032
- Table 65: Spain Food Service Industry in UAE Revenue (Million) Forecast, by Application 2019 & 2032
- Table 66: Spain Food Service Industry in UAE Volume (Thousand Tons) Forecast, by Application 2019 & 2032
- Table 67: Russia Food Service Industry in UAE Revenue (Million) Forecast, by Application 2019 & 2032
- Table 68: Russia Food Service Industry in UAE Volume (Thousand Tons) Forecast, by Application 2019 & 2032
- Table 69: Benelux Food Service Industry in UAE Revenue (Million) Forecast, by Application 2019 & 2032
- Table 70: Benelux Food Service Industry in UAE Volume (Thousand Tons) Forecast, by Application 2019 & 2032
- Table 71: Nordics Food Service Industry in UAE Revenue (Million) Forecast, by Application 2019 & 2032
- Table 72: Nordics Food Service Industry in UAE Volume (Thousand Tons) Forecast, by Application 2019 & 2032
- Table 73: Rest of Europe Food Service Industry in UAE Revenue (Million) Forecast, by Application 2019 & 2032
- Table 74: Rest of Europe Food Service Industry in UAE Volume (Thousand Tons) Forecast, by Application 2019 & 2032
- Table 75: Global Food Service Industry in UAE Revenue Million Forecast, by Foodservice Type 2019 & 2032
- Table 76: Global Food Service Industry in UAE Volume Thousand Tons Forecast, by Foodservice Type 2019 & 2032
- Table 77: Global Food Service Industry in UAE Revenue Million Forecast, by Outlet 2019 & 2032
- Table 78: Global Food Service Industry in UAE Volume Thousand Tons Forecast, by Outlet 2019 & 2032
- Table 79: Global Food Service Industry in UAE Revenue Million Forecast, by Location 2019 & 2032
- Table 80: Global Food Service Industry in UAE Volume Thousand Tons Forecast, by Location 2019 & 2032
- Table 81: Global Food Service Industry in UAE Revenue Million Forecast, by Country 2019 & 2032
- Table 82: Global Food Service Industry in UAE Volume Thousand Tons Forecast, by Country 2019 & 2032
- Table 83: Turkey Food Service Industry in UAE Revenue (Million) Forecast, by Application 2019 & 2032
- Table 84: Turkey Food Service Industry in UAE Volume (Thousand Tons) Forecast, by Application 2019 & 2032
- Table 85: Israel Food Service Industry in UAE Revenue (Million) Forecast, by Application 2019 & 2032
- Table 86: Israel Food Service Industry in UAE Volume (Thousand Tons) Forecast, by Application 2019 & 2032
- Table 87: GCC Food Service Industry in UAE Revenue (Million) Forecast, by Application 2019 & 2032
- Table 88: GCC Food Service Industry in UAE Volume (Thousand Tons) Forecast, by Application 2019 & 2032
- Table 89: North Africa Food Service Industry in UAE Revenue (Million) Forecast, by Application 2019 & 2032
- Table 90: North Africa Food Service Industry in UAE Volume (Thousand Tons) Forecast, by Application 2019 & 2032
- Table 91: South Africa Food Service Industry in UAE Revenue (Million) Forecast, by Application 2019 & 2032
- Table 92: South Africa Food Service Industry in UAE Volume (Thousand Tons) Forecast, by Application 2019 & 2032
- Table 93: Rest of Middle East & Africa Food Service Industry in UAE Revenue (Million) Forecast, by Application 2019 & 2032
- Table 94: Rest of Middle East & Africa Food Service Industry in UAE Volume (Thousand Tons) Forecast, by Application 2019 & 2032
- Table 95: Global Food Service Industry in UAE Revenue Million Forecast, by Foodservice Type 2019 & 2032
- Table 96: Global Food Service Industry in UAE Volume Thousand Tons Forecast, by Foodservice Type 2019 & 2032
- Table 97: Global Food Service Industry in UAE Revenue Million Forecast, by Outlet 2019 & 2032
- Table 98: Global Food Service Industry in UAE Volume Thousand Tons Forecast, by Outlet 2019 & 2032
- Table 99: Global Food Service Industry in UAE Revenue Million Forecast, by Location 2019 & 2032
- Table 100: Global Food Service Industry in UAE Volume Thousand Tons Forecast, by Location 2019 & 2032
- Table 101: Global Food Service Industry in UAE Revenue Million Forecast, by Country 2019 & 2032
- Table 102: Global Food Service Industry in UAE Volume Thousand Tons Forecast, by Country 2019 & 2032
- Table 103: China Food Service Industry in UAE Revenue (Million) Forecast, by Application 2019 & 2032
- Table 104: China Food Service Industry in UAE Volume (Thousand Tons) Forecast, by Application 2019 & 2032
- Table 105: India Food Service Industry in UAE Revenue (Million) Forecast, by Application 2019 & 2032
- Table 106: India Food Service Industry in UAE Volume (Thousand Tons) Forecast, by Application 2019 & 2032
- Table 107: Japan Food Service Industry in UAE Revenue (Million) Forecast, by Application 2019 & 2032
- Table 108: Japan Food Service Industry in UAE Volume (Thousand Tons) Forecast, by Application 2019 & 2032
- Table 109: South Korea Food Service Industry in UAE Revenue (Million) Forecast, by Application 2019 & 2032
- Table 110: South Korea Food Service Industry in UAE Volume (Thousand Tons) Forecast, by Application 2019 & 2032
- Table 111: ASEAN Food Service Industry in UAE Revenue (Million) Forecast, by Application 2019 & 2032
- Table 112: ASEAN Food Service Industry in UAE Volume (Thousand Tons) Forecast, by Application 2019 & 2032
- Table 113: Oceania Food Service Industry in UAE Revenue (Million) Forecast, by Application 2019 & 2032
- Table 114: Oceania Food Service Industry in UAE Volume (Thousand Tons) Forecast, by Application 2019 & 2032
- Table 115: Rest of Asia Pacific Food Service Industry in UAE Revenue (Million) Forecast, by Application 2019 & 2032
- Table 116: Rest of Asia Pacific Food Service Industry in UAE Volume (Thousand Tons) Forecast, by Application 2019 & 2032
Frequently Asked Questions
1. What is the projected Compound Annual Growth Rate (CAGR) of the Food Service Industry in UAE?
The projected CAGR is approximately 7.00%.
2. Which companies are prominent players in the Food Service Industry in UAE?
Key companies in the market include The Olayan Grou, Galadari Ice Cream Co LLC, D ream International, The Emirates Group, Alghanim Industries & Yusuf A Alghanim & Sons WLL, Emirates Fast Food Company, CKE Restaurants Holdings Inc, Ring International Holding AG, Deli and Meal LLC, BinHendi Enterprises, Americana Restaurants International PLC, M H Alshaya Co WLL, LuLu Group International, Kamal Osman Jamjoom Group LLC, Apparel Group, Alamar Foods Company, JF Street Food, Al Khaja Group Of Companies.
3. What are the main segments of the Food Service Industry in UAE?
The market segments include Foodservice Type, Outlet, Location.
4. Can you provide details about the market size?
The market size is estimated to be USD XX Million as of 2022.
5. What are some drivers contributing to market growth?
Consumer inclination toward functional food and beverages; Increasing Number of Applications and Growing Industrial Use.
6. What are the notable trends driving market growth?
The high ex-pat population in the country and the rise in online food delivery are fuelling the market growth.
7. Are there any restraints impacting market growth?
Increasing Shift Toward Plant-Based Protein.
8. Can you provide examples of recent developments in the market?
December 2022: Americana Restaurants re-launched Wimpy, a burger brand, in the UAE market. Wimpy's new location is expected to use the innovative robotic solution as part of the restaurant's vision to become the Middle East's first tech burger brand. Flippy 2 is a robotics solution that can automate a variety of restaurant cooking tasks while assisting with consistency and accuracy at the fry station.August 2022: Americana Restaurants International PLC declared that it made a franchise agreement with a United States-based craft coffee company, Peet's Coffee, to enter the GCC market.June 2022: Americana Restaurants, the master franchisee in the MENA region for KFC, Pizza Hut, Hardee's, Krispy Kreme and more, announced that it had entered a partnership with Miso Robotics, a US-based company that has been transforming the restaurant industry through robotics and intelligent automation.
9. What pricing options are available for accessing the report?
Pricing options include single-user, multi-user, and enterprise licenses priced at USD 3800, USD 4500, and USD 5800 respectively.
10. Is the market size provided in terms of value or volume?
The market size is provided in terms of value, measured in Million and volume, measured in Thousand Tons.
11. Are there any specific market keywords associated with the report?
Yes, the market keyword associated with the report is "Food Service Industry in UAE," which aids in identifying and referencing the specific market segment covered.
12. How do I determine which pricing option suits my needs best?
The pricing options vary based on user requirements and access needs. Individual users may opt for single-user licenses, while businesses requiring broader access may choose multi-user or enterprise licenses for cost-effective access to the report.
13. Are there any additional resources or data provided in the Food Service Industry in UAE report?
While the report offers comprehensive insights, it's advisable to review the specific contents or supplementary materials provided to ascertain if additional resources or data are available.
14. How can I stay updated on further developments or reports in the Food Service Industry in UAE?
To stay informed about further developments, trends, and reports in the Food Service Industry in UAE, consider subscribing to industry newsletters, following relevant companies and organizations, or regularly checking reputable industry news sources and publications.
Methodology
Step 1 - Identification of Relevant Samples Size from Population Database


Step 2 - Approaches for Defining Global Market Size (Value, Volume* & Price*)

Note*: In applicable scenarios
Step 3 - Data Sources
Primary Research
- Web Analytics
- Survey Reports
- Research Institute
- Latest Research Reports
- Opinion Leaders
Secondary Research
- Annual Reports
- White Paper
- Latest Press Release
- Industry Association
- Paid Database
- Investor Presentations

Step 4 - Data Triangulation
Involves using different sources of information in order to increase the validity of a study
These sources are likely to be stakeholders in a program - participants, other researchers, program staff, other community members, and so on.
Then we put all data in single framework & apply various statistical tools to find out the dynamic on the market.
During the analysis stage, feedback from the stakeholder groups would be compared to determine areas of agreement as well as areas of divergence


