
Key Insights
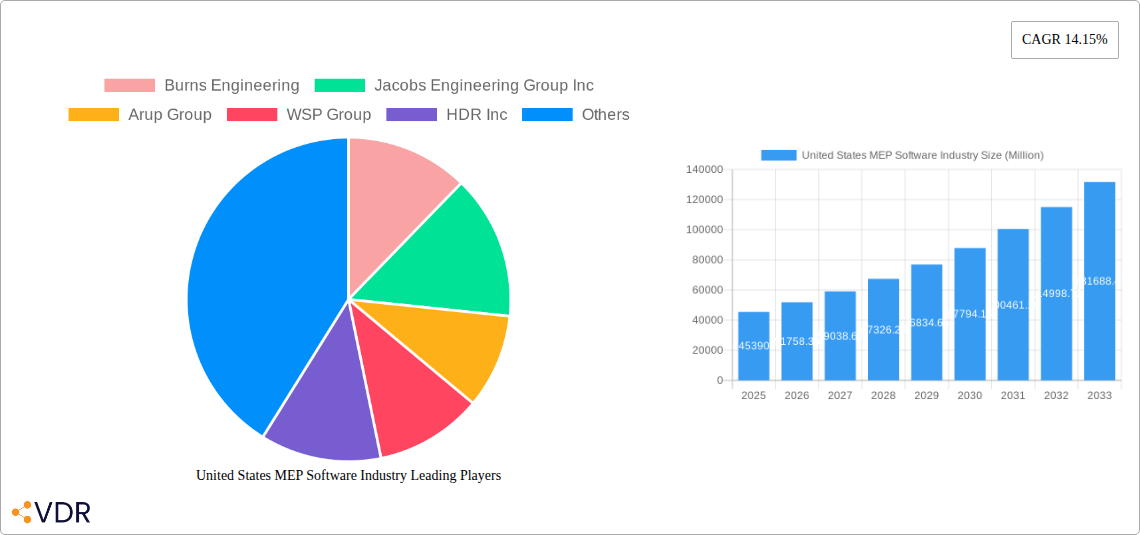
The United States MEP (Mechanical, Electrical, and Plumbing) software market is experiencing robust growth, driven by the increasing adoption of Building Information Modeling (BIM) and the demand for improved efficiency and collaboration in building design and construction. With a market size of $45.39 billion in 2025 and a Compound Annual Growth Rate (CAGR) of 14.15%, the market is projected to reach significant heights by 2033. Key drivers include the rising complexity of building systems, stringent building codes demanding energy efficiency, and the growing need for data-driven decision-making throughout the project lifecycle. The integration of cloud-based technologies, artificial intelligence (AI), and Internet of Things (IoT) capabilities within MEP software is further fueling market expansion. The market is segmented by type (new construction, retrofit & renovation, commissioning activity, other) and end-user vertical (healthcare, commercial offices, educational institutions, public spaces, industrial establishments, data centers, etc.), reflecting the diverse applications of MEP software across various sectors. The competitive landscape is characterized by both established players like Autodesk, Bentley Systems, and Siemens, and specialized niche providers. The robust growth is expected to continue, fueled by ongoing technological advancements and the increasing adoption of digital transformation strategies across the construction industry.
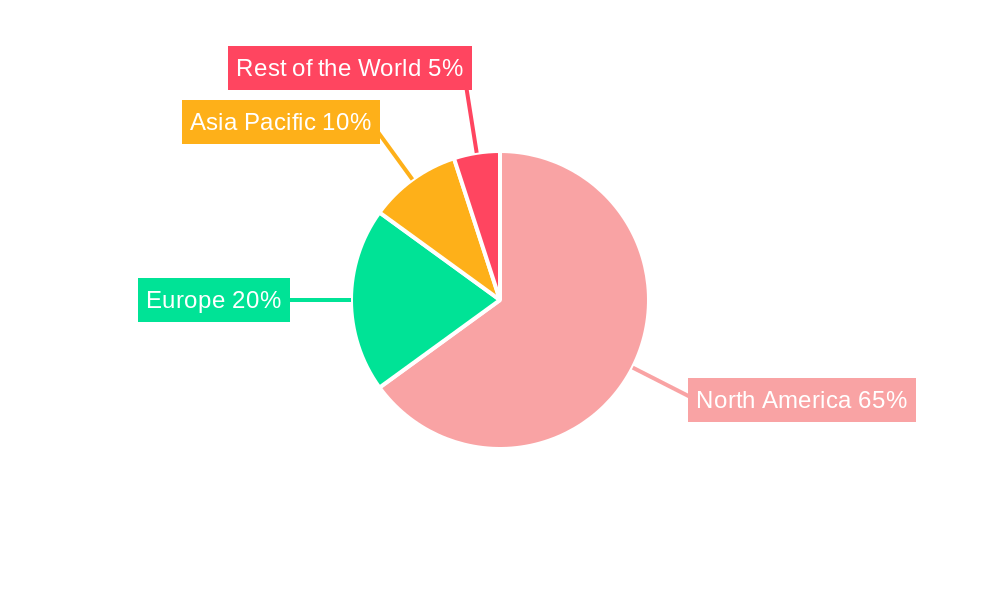
The North American region, particularly the United States, holds a substantial share of the global MEP software market, benefiting from advanced infrastructure development, a large construction sector, and early adoption of innovative technologies. Growth in the US is likely to be driven by the substantial investment in infrastructure projects, the ongoing trend of building modernization and energy efficiency upgrades, and the increasing emphasis on sustainable building practices. While the retrofit and renovation segments currently hold significant market share, new construction projects are also expected to contribute substantially to market growth, driven by factors like urbanization and population growth. The strong presence of major engineering firms and technology companies in the US further strengthens the market's growth trajectory. This signifies considerable opportunities for both software developers and engineering firms specializing in MEP design and consulting.
United States MEP Software Industry Market Report: 2019-2033
This comprehensive report provides a detailed analysis of the United States MEP (Mechanical, Electrical, and Plumbing) software industry, offering invaluable insights for industry professionals, investors, and strategic planners. The report covers market dynamics, growth trends, key players, and future opportunities, with a focus on the period 2019-2033 (Study Period), using 2025 as the Base Year and Estimated Year. The Forecast Period spans 2025-2033, encompassing the Historical Period of 2019-2024. This report uses Million units for all values.
United States MEP Software Industry Market Dynamics & Structure
The US MEP software market is characterized by a moderately concentrated landscape, with several large players and numerous smaller niche providers. Technological innovation, driven by Building Information Modeling (BIM) advancements and cloud-based solutions, is a key driver. Stringent regulatory frameworks, particularly regarding energy efficiency and building codes, influence software adoption. Competition from alternative solutions, including manual drafting and legacy systems, remains a factor, although diminishing. End-user demographics show a growing preference for integrated, data-rich software across diverse sectors. Mergers and acquisitions (M&A) activity is moderate, reflecting consolidation and expansion strategies among key players.
- Market Concentration: xx% held by top 5 players (estimated).
- Innovation Drivers: BIM integration, cloud computing, AI-powered design tools.
- Regulatory Influence: Building codes, energy efficiency standards.
- M&A Activity: xx deals recorded between 2019-2024 (estimated). Average deal value: xx Million.
- Innovation Barriers: High initial investment costs, integration challenges with existing systems, lack of skilled workforce.
United States MEP Software Industry Growth Trends & Insights
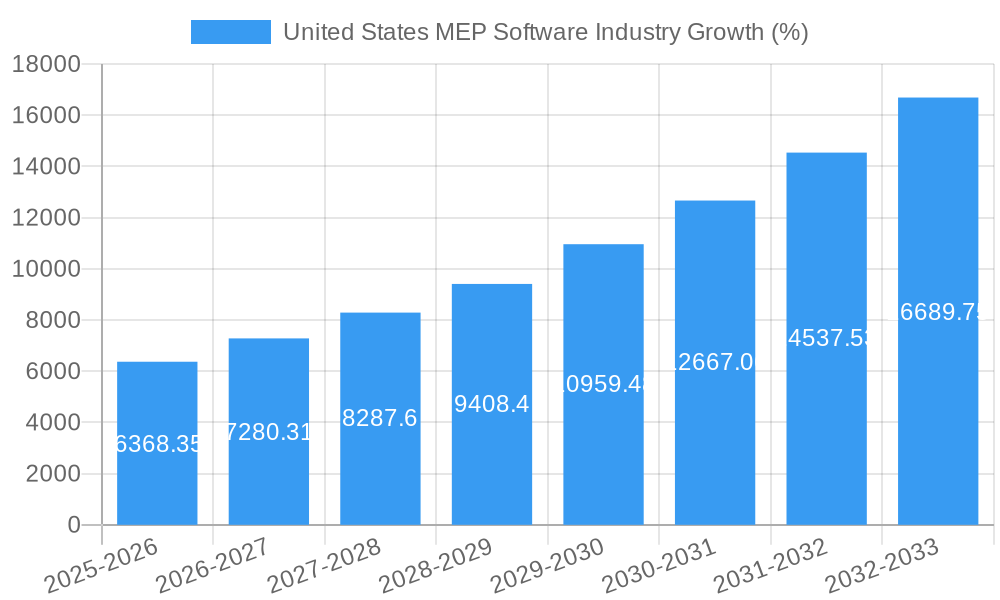
The US MEP software market exhibits robust growth, driven by increasing adoption across diverse sectors, particularly in new construction and retrofit projects. Technological disruptions, including the widespread adoption of BIM and cloud-based solutions, are reshaping the industry. Consumer behavior is shifting towards software offering improved collaboration, data management, and efficiency gains. The market is expected to experience significant growth during the forecast period, driven by several key factors.
The market size experienced a CAGR of xx% during the historical period (2019-2024) and is projected to maintain a CAGR of xx% from 2025 to 2033, reaching a market size of xx Million by 2033. Market penetration in the key sectors is expected to reach xx% by 2033. This growth is attributed to factors such as increasing investment in infrastructure projects, rising adoption of BIM, and the growing demand for sustainable building practices.
Dominant Regions, Countries, or Segments in United States MEP Software Industry
The Northeast and West Coast regions dominate the US MEP software market, driven by high concentrations of commercial construction activity, technological innovation hubs, and substantial investments in infrastructure development. Within market segments, New Construction and Retrofit & Renovation projects represent the largest share, driven by robust construction activity in commercial and residential buildings. The Healthcare and Commercial Office end-user verticals show the highest adoption rates due to stringent regulatory requirements and the need for efficient facility management.
- Key Drivers: High construction activity in major metropolitan areas, government initiatives promoting sustainable buildings, strong economic growth in certain regions.
- Dominant Segments: New Construction (xx% market share), Retrofit & Renovation (xx% market share), Healthcare (xx% market share), Commercial Offices (xx% market share).
- Growth Potential: Industrial establishments & warehouses (high growth potential due to e-commerce expansion) and Data Centers (high growth due to digital transformation).
United States MEP Software Industry Product Landscape
The US MEP software market features a diverse range of products, ranging from standalone applications to integrated suites offering comprehensive design, analysis, and collaboration capabilities. Recent innovations focus on BIM integration, cloud-based accessibility, AI-powered design optimization, and improved data visualization tools. Key features include enhanced modeling capabilities, improved energy simulation tools, and streamlined workflows to improve project delivery efficiency. The unique selling propositions of these products often include ease of use, integration with other software platforms, and cost-effectiveness.
Key Drivers, Barriers & Challenges in United States MEP Software Industry
Key Drivers: Increasing adoption of BIM, growing demand for sustainable buildings, government regulations promoting energy efficiency, and the need for enhanced project collaboration are some of the major drivers.
Challenges & Restraints: High implementation costs, resistance to change among traditional firms, data security concerns related to cloud-based solutions, and the lack of skilled professionals capable of effectively using advanced software present significant challenges. These challenges result in decreased market penetration and slower adoption rates, particularly among smaller firms.
Emerging Opportunities in United States MEP Software Industry
The rise of Internet of Things (IoT) integration in building management systems presents a significant opportunity for MEP software providers. The demand for sustainable building design and operational efficiency is driving the development of specialized software solutions. Furthermore, expansion into underserved markets, such as smaller engineering firms and residential construction, offers considerable growth potential.
Growth Accelerators in the United States MEP Software Industry Industry
Strategic partnerships between MEP software providers and construction companies are facilitating broader adoption. Technological advancements such as AI and machine learning are enhancing software capabilities and streamlining workflows. Market expansion into emerging sectors like data centers and renewable energy infrastructure is driving further growth.
Key Players Shaping the United States MEP Software Industry Market
- Burns Engineering
- Jacobs Engineering Group Inc
- Arup Group
- WSP Group
- HDR Inc
- Stantec Inc
- MEP Engineering
- Wiley Wilson
- Affiliated Engineers Inc
- AHA Consulting
- AECOM
- Macro Services
Notable Milestones in United States MEP Software Industry Sector
- February 2021: Bowman Consulting Group, Ltd. acquired KTA Group, Inc., expanding its MEP engineering and service offerings.
- May 2021: AECOM secured a program management contract for the USD 3.5 billion Dallas Independent School District bond program, highlighting the increasing demand for comprehensive project management services in the sector.
In-Depth United States MEP Software Industry Market Outlook
The US MEP software market is poised for sustained growth, driven by ongoing technological advancements, increasing demand for sustainable building practices, and expanding adoption across diverse sectors. Strategic partnerships, product innovation, and market expansion initiatives will play a crucial role in shaping the future of this dynamic industry. The potential for integration with other technologies, such as IoT and AI, offers significant opportunities for further market expansion and growth.
United States MEP Software Industry Segmentation
-
1. Type
- 1.1. New Construction
- 1.2. Retrofit & Renovation
- 1.3. Commissioning Activity
- 1.4. Other Types
-
2. End-user Vertical
- 2.1. Healthcare
- 2.2. Commercial Offices
- 2.3. Educational Institutions
- 2.4. Public Spaces and Institutions
- 2.5. Industrial establishments & Warehouses
- 2.6. Other Co
United States MEP Software Industry Segmentation By Geography
- 1. United States
United States MEP Software Industry REPORT HIGHLIGHTS
| Aspects | Details |
|---|---|
| Study Period | 2019-2033 |
| Base Year | 2024 |
| Estimated Year | 2025 |
| Forecast Period | 2025-2033 |
| Historical Period | 2019-2024 |
| Growth Rate | CAGR of 14.15% from 2019-2033 |
| Segmentation |
|
Table of Contents
- 1. Introduction
- 1.1. Research Scope
- 1.2. Market Segmentation
- 1.3. Research Methodology
- 1.4. Definitions and Assumptions
- 2. Executive Summary
- 2.1. Introduction
- 3. Market Dynamics
- 3.1. Introduction
- 3.2. Market Drivers
- 3.2.1. Growing Emphasis on Outsourcing of MEP Services to Focus on Core Offering; Steady Demand from Commercial and Healthcare Institutions; Evolving Business Models and Nature of Collaboration between Firms and Service Vendors
- 3.3. Market Restrains
- 3.3.1. Operational Challenges in High Market Concentration and Growing Demand for End-to-end Offering Affect Smaller Firms
- 3.4. Market Trends
- 3.4.1. New Construction to Drive the Market Growth
- 4. Market Factor Analysis
- 4.1. Porters Five Forces
- 4.2. Supply/Value Chain
- 4.3. PESTEL analysis
- 4.4. Market Entropy
- 4.5. Patent/Trademark Analysis
- 5. United States MEP Software Industry Analysis, Insights and Forecast, 2019-2031
- 5.1. Market Analysis, Insights and Forecast - by Type
- 5.1.1. New Construction
- 5.1.2. Retrofit & Renovation
- 5.1.3. Commissioning Activity
- 5.1.4. Other Types
- 5.2. Market Analysis, Insights and Forecast - by End-user Vertical
- 5.2.1. Healthcare
- 5.2.2. Commercial Offices
- 5.2.3. Educational Institutions
- 5.2.4. Public Spaces and Institutions
- 5.2.5. Industrial establishments & Warehouses
- 5.2.6. Other Co
- 5.3. Market Analysis, Insights and Forecast - by Region
- 5.3.1. United States
- 5.1. Market Analysis, Insights and Forecast - by Type
- 6. North America United States MEP Software Industry Analysis, Insights and Forecast, 2019-2031
- 6.1. Market Analysis, Insights and Forecast - By Country/Sub-region
- 6.1.1 United States
- 6.1.2 Canada
- 7. Europe United States MEP Software Industry Analysis, Insights and Forecast, 2019-2031
- 7.1. Market Analysis, Insights and Forecast - By Country/Sub-region
- 7.1.1 United Kingdom
- 7.1.2 Italy
- 7.1.3 Germany
- 7.1.4 France
- 7.1.5 Rest of Europe
- 8. Asia Pacific United States MEP Software Industry Analysis, Insights and Forecast, 2019-2031
- 8.1. Market Analysis, Insights and Forecast - By Country/Sub-region
- 8.1.1 China
- 8.1.2 Japan
- 8.1.3 South Korea
- 8.1.4 India
- 8.1.5 Rest of Asia Pacific
- 9. Rest of the World United States MEP Software Industry Analysis, Insights and Forecast, 2019-2031
- 9.1. Market Analysis, Insights and Forecast - By Country/Sub-region
- 9.1.1.
- 10. Competitive Analysis
- 10.1. Market Share Analysis 2024
- 10.2. Company Profiles
- 10.2.1 Burns Engineering
- 10.2.1.1. Overview
- 10.2.1.2. Products
- 10.2.1.3. SWOT Analysis
- 10.2.1.4. Recent Developments
- 10.2.1.5. Financials (Based on Availability)
- 10.2.2 Jacobs Engineering Group Inc
- 10.2.2.1. Overview
- 10.2.2.2. Products
- 10.2.2.3. SWOT Analysis
- 10.2.2.4. Recent Developments
- 10.2.2.5. Financials (Based on Availability)
- 10.2.3 Arup Group
- 10.2.3.1. Overview
- 10.2.3.2. Products
- 10.2.3.3. SWOT Analysis
- 10.2.3.4. Recent Developments
- 10.2.3.5. Financials (Based on Availability)
- 10.2.4 WSP Group
- 10.2.4.1. Overview
- 10.2.4.2. Products
- 10.2.4.3. SWOT Analysis
- 10.2.4.4. Recent Developments
- 10.2.4.5. Financials (Based on Availability)
- 10.2.5 HDR Inc
- 10.2.5.1. Overview
- 10.2.5.2. Products
- 10.2.5.3. SWOT Analysis
- 10.2.5.4. Recent Developments
- 10.2.5.5. Financials (Based on Availability)
- 10.2.6 Stantec Inc
- 10.2.6.1. Overview
- 10.2.6.2. Products
- 10.2.6.3. SWOT Analysis
- 10.2.6.4. Recent Developments
- 10.2.6.5. Financials (Based on Availability)
- 10.2.7 MEP Engineering
- 10.2.7.1. Overview
- 10.2.7.2. Products
- 10.2.7.3. SWOT Analysis
- 10.2.7.4. Recent Developments
- 10.2.7.5. Financials (Based on Availability)
- 10.2.8 Wiley Wilson*List Not Exhaustive
- 10.2.8.1. Overview
- 10.2.8.2. Products
- 10.2.8.3. SWOT Analysis
- 10.2.8.4. Recent Developments
- 10.2.8.5. Financials (Based on Availability)
- 10.2.9 Affiliated Engineers Inc
- 10.2.9.1. Overview
- 10.2.9.2. Products
- 10.2.9.3. SWOT Analysis
- 10.2.9.4. Recent Developments
- 10.2.9.5. Financials (Based on Availability)
- 10.2.10 AHA Consulting
- 10.2.10.1. Overview
- 10.2.10.2. Products
- 10.2.10.3. SWOT Analysis
- 10.2.10.4. Recent Developments
- 10.2.10.5. Financials (Based on Availability)
- 10.2.11 AECOM
- 10.2.11.1. Overview
- 10.2.11.2. Products
- 10.2.11.3. SWOT Analysis
- 10.2.11.4. Recent Developments
- 10.2.11.5. Financials (Based on Availability)
- 10.2.12 Macro Services
- 10.2.12.1. Overview
- 10.2.12.2. Products
- 10.2.12.3. SWOT Analysis
- 10.2.12.4. Recent Developments
- 10.2.12.5. Financials (Based on Availability)
- 10.2.1 Burns Engineering
List of Figures
- Figure 1: United States MEP Software Industry Revenue Breakdown (Million, %) by Product 2024 & 2032
- Figure 2: United States MEP Software Industry Share (%) by Company 2024
List of Tables
- Table 1: United States MEP Software Industry Revenue Million Forecast, by Region 2019 & 2032
- Table 2: United States MEP Software Industry Revenue Million Forecast, by Type 2019 & 2032
- Table 3: United States MEP Software Industry Revenue Million Forecast, by End-user Vertical 2019 & 2032
- Table 4: United States MEP Software Industry Revenue Million Forecast, by Region 2019 & 2032
- Table 5: United States MEP Software Industry Revenue Million Forecast, by Country 2019 & 2032
- Table 6: United States United States MEP Software Industry Revenue (Million) Forecast, by Application 2019 & 2032
- Table 7: Canada United States MEP Software Industry Revenue (Million) Forecast, by Application 2019 & 2032
- Table 8: United States MEP Software Industry Revenue Million Forecast, by Country 2019 & 2032
- Table 9: United Kingdom United States MEP Software Industry Revenue (Million) Forecast, by Application 2019 & 2032
- Table 10: Italy United States MEP Software Industry Revenue (Million) Forecast, by Application 2019 & 2032
- Table 11: Germany United States MEP Software Industry Revenue (Million) Forecast, by Application 2019 & 2032
- Table 12: France United States MEP Software Industry Revenue (Million) Forecast, by Application 2019 & 2032
- Table 13: Rest of Europe United States MEP Software Industry Revenue (Million) Forecast, by Application 2019 & 2032
- Table 14: United States MEP Software Industry Revenue Million Forecast, by Country 2019 & 2032
- Table 15: China United States MEP Software Industry Revenue (Million) Forecast, by Application 2019 & 2032
- Table 16: Japan United States MEP Software Industry Revenue (Million) Forecast, by Application 2019 & 2032
- Table 17: South Korea United States MEP Software Industry Revenue (Million) Forecast, by Application 2019 & 2032
- Table 18: India United States MEP Software Industry Revenue (Million) Forecast, by Application 2019 & 2032
- Table 19: Rest of Asia Pacific United States MEP Software Industry Revenue (Million) Forecast, by Application 2019 & 2032
- Table 20: United States MEP Software Industry Revenue Million Forecast, by Country 2019 & 2032
- Table 21: United States MEP Software Industry Revenue (Million) Forecast, by Application 2019 & 2032
- Table 22: United States MEP Software Industry Revenue Million Forecast, by Type 2019 & 2032
- Table 23: United States MEP Software Industry Revenue Million Forecast, by End-user Vertical 2019 & 2032
- Table 24: United States MEP Software Industry Revenue Million Forecast, by Country 2019 & 2032
Frequently Asked Questions
1. What is the projected Compound Annual Growth Rate (CAGR) of the United States MEP Software Industry?
The projected CAGR is approximately 14.15%.
2. Which companies are prominent players in the United States MEP Software Industry?
Key companies in the market include Burns Engineering, Jacobs Engineering Group Inc, Arup Group, WSP Group, HDR Inc, Stantec Inc, MEP Engineering, Wiley Wilson*List Not Exhaustive, Affiliated Engineers Inc, AHA Consulting, AECOM, Macro Services.
3. What are the main segments of the United States MEP Software Industry?
The market segments include Type, End-user Vertical.
4. Can you provide details about the market size?
The market size is estimated to be USD 45.39 Million as of 2022.
5. What are some drivers contributing to market growth?
Growing Emphasis on Outsourcing of MEP Services to Focus on Core Offering; Steady Demand from Commercial and Healthcare Institutions; Evolving Business Models and Nature of Collaboration between Firms and Service Vendors.
6. What are the notable trends driving market growth?
New Construction to Drive the Market Growth.
7. Are there any restraints impacting market growth?
Operational Challenges in High Market Concentration and Growing Demand for End-to-end Offering Affect Smaller Firms.
8. Can you provide examples of recent developments in the market?
February 2021 - Bowman Consulting Group, Ltd., acquired KTA Group, Inc. KTA is a forty-person engineering firm with core expertise in mechanical, electrical, and plumbing engineering, commissioning third-party plan review, and lighting design. The move supports Bowman's continued growth and substantially broadens its scope of service offerings.
9. What pricing options are available for accessing the report?
Pricing options include single-user, multi-user, and enterprise licenses priced at USD 3800, USD 4500, and USD 5800 respectively.
10. Is the market size provided in terms of value or volume?
The market size is provided in terms of value, measured in Million.
11. Are there any specific market keywords associated with the report?
Yes, the market keyword associated with the report is "United States MEP Software Industry," which aids in identifying and referencing the specific market segment covered.
12. How do I determine which pricing option suits my needs best?
The pricing options vary based on user requirements and access needs. Individual users may opt for single-user licenses, while businesses requiring broader access may choose multi-user or enterprise licenses for cost-effective access to the report.
13. Are there any additional resources or data provided in the United States MEP Software Industry report?
While the report offers comprehensive insights, it's advisable to review the specific contents or supplementary materials provided to ascertain if additional resources or data are available.
14. How can I stay updated on further developments or reports in the United States MEP Software Industry?
To stay informed about further developments, trends, and reports in the United States MEP Software Industry, consider subscribing to industry newsletters, following relevant companies and organizations, or regularly checking reputable industry news sources and publications.
Methodology
Step 1 - Identification of Relevant Samples Size from Population Database


Step 2 - Approaches for Defining Global Market Size (Value, Volume* & Price*)

Note*: In applicable scenarios
Step 3 - Data Sources
Primary Research
- Web Analytics
- Survey Reports
- Research Institute
- Latest Research Reports
- Opinion Leaders
Secondary Research
- Annual Reports
- White Paper
- Latest Press Release
- Industry Association
- Paid Database
- Investor Presentations

Step 4 - Data Triangulation
Involves using different sources of information in order to increase the validity of a study
These sources are likely to be stakeholders in a program - participants, other researchers, program staff, other community members, and so on.
Then we put all data in single framework & apply various statistical tools to find out the dynamic on the market.
During the analysis stage, feedback from the stakeholder groups would be compared to determine areas of agreement as well as areas of divergence


