
Key Insights
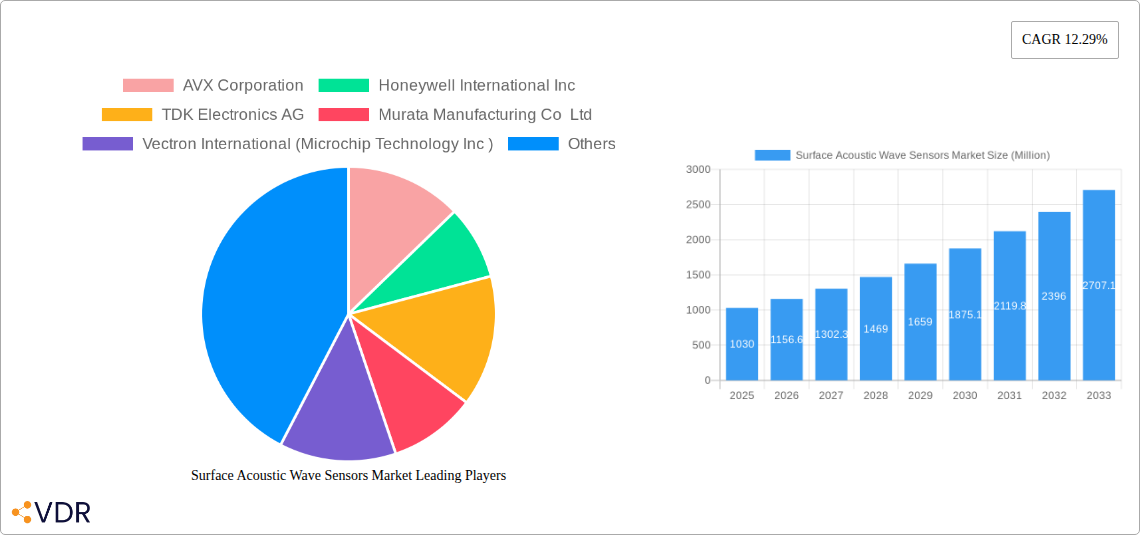
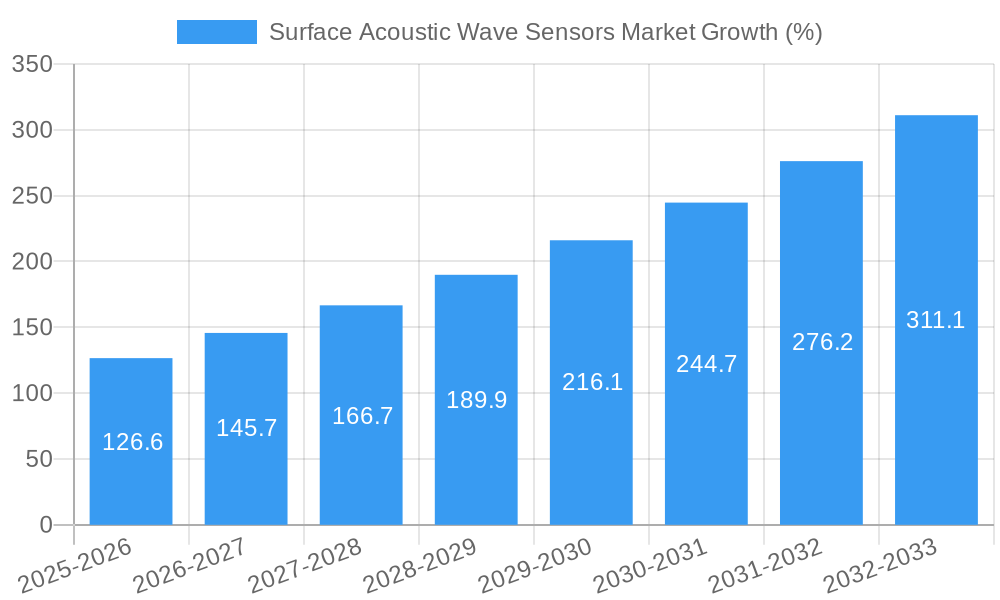
The Surface Acoustic Wave (SAW) Sensors market is experiencing robust growth, projected to reach \$1.03 billion in 2025 and exhibiting a Compound Annual Growth Rate (CAGR) of 12.29% from 2025 to 2033. This expansion is driven by several key factors. Firstly, the increasing demand for miniaturized and highly sensitive sensors across diverse sectors such as automotive, healthcare, and consumer electronics fuels market growth. Advancements in SAW sensor technology, leading to improved performance, reliability, and cost-effectiveness, further propel market expansion. The automotive industry, in particular, is a major driver, with SAW sensors playing a critical role in applications like tire pressure monitoring systems and airbag deployment. The growing adoption of sophisticated electronics in consumer devices, along with the rising need for precise and real-time health monitoring solutions, also contribute significantly to market growth. Furthermore, the development of SAW sensors for chemical sensing and environmental monitoring opens new avenues for market expansion. While the market faces certain restraints such as the high initial investment costs associated with sensor manufacturing and potential limitations in operating temperatures and frequencies, these are being mitigated by continuous technological improvements and cost reduction strategies. The market's segmentation, encompassing various sensing types (pressure, torque, temperature, humidity, chemical) and end-user industries, highlights its diverse application potential and assures continued growth across varied sectors.
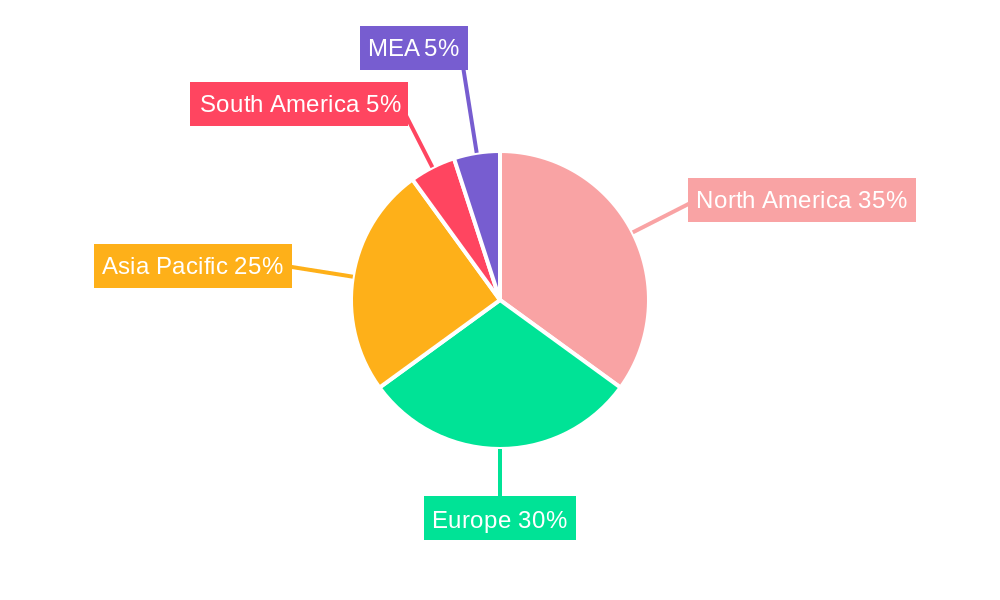
The geographical distribution of the SAW sensor market reflects strong regional variations. North America and Europe currently hold significant market shares, driven by established technological advancements and high adoption rates in key industries. However, the Asia-Pacific region is expected to witness the fastest growth during the forecast period, fueled by increasing industrialization, expanding consumer electronics markets, and supportive government initiatives promoting technological advancements. This growth trajectory across various regions signifies substantial opportunities for both established players and new entrants in the global SAW sensor market. Market competition is intense, with key players such as AVX Corporation, Honeywell International Inc., and Murata Manufacturing Co. Ltd. continually striving to enhance their product offerings, expand their market reach, and solidify their positions through strategic partnerships and acquisitions.
Surface Acoustic Wave (SAW) Sensors Market Report: 2019-2033
This comprehensive report provides an in-depth analysis of the Surface Acoustic Wave (SAW) Sensors market, encompassing market dynamics, growth trends, regional analysis, product landscape, key players, and future outlook. The report covers the period from 2019 to 2033, with 2025 as the base year and forecasts extending to 2033. The parent market is the Sensors Market and the child market is the Surface Acoustic Wave Sensors Market. Market values are presented in millions of units.
Surface Acoustic Wave Sensors Market Market Dynamics & Structure
The Surface Acoustic Wave (SAW) Sensors market is experiencing significant growth driven by technological advancements, increasing demand across diverse end-user industries, and ongoing mergers and acquisitions (M&A) activity. Market concentration is moderate, with several key players dominating specific segments. Technological innovations, particularly in miniaturization and improved sensitivity, are key drivers. Stringent regulatory frameworks, particularly in sectors like healthcare and automotive, are shaping market development. Competitive pressures arise from alternative sensing technologies, such as MEMS sensors. The end-user demographics are diversifying, with strong growth seen in automotive, consumer electronics, and healthcare.
- Market Concentration: Moderate, with top 5 players holding approximately xx% market share in 2024.
- Technological Innovation Drivers: Miniaturization, enhanced sensitivity, improved power efficiency.
- Regulatory Frameworks: Stringent safety and performance standards in automotive and healthcare are driving adoption of high-quality SAW sensors.
- Competitive Product Substitutes: MEMS sensors, optical sensors.
- End-User Demographics: Growing demand from automotive, consumer electronics, and healthcare sectors.
- M&A Trends: xx M&A deals involving SAW sensor companies recorded between 2019 and 2024.
Surface Acoustic Wave Sensors Market Growth Trends & Insights
The Surface Acoustic Wave Sensors market is exhibiting robust growth, with a projected Compound Annual Growth Rate (CAGR) of xx% during the forecast period (2025-2033). Market size is estimated at xx million units in 2025 and is expected to reach xx million units by 2033. This growth is fueled by increasing demand for precise and reliable sensing solutions across various applications. Technological disruptions, such as the development of thin-film SAW (TF-SAW) technology, are further accelerating market expansion. Consumer behavior shifts toward smart and connected devices are also boosting demand for SAW sensors in consumer electronics. Market penetration is increasing across various end-user industries, particularly in automotive and industrial applications.
Dominant Regions, Countries, or Segments in Surface Acoustic Wave Sensors Market
The North American region currently holds the largest market share, driven by strong demand from the automotive and healthcare sectors. However, the Asia-Pacific region is expected to witness the fastest growth rate due to rapid industrialization and increasing consumer electronics adoption. Within sensing types, pressure sensors and chemical sensors are the dominant segments, while in the end-user industries, the automotive sector is leading.
- Key Drivers (North America): Robust automotive industry, high adoption in healthcare, and strong R&D investments.
- Key Drivers (Asia-Pacific): Rapid industrialization, booming consumer electronics market, and cost-effective manufacturing.
- Dominant Sensing Type: Pressure Sensors (xx% market share in 2024), Chemical Sensors (xx% market share in 2024).
- Dominant End-User Industry: Automotive (xx% market share in 2024), followed by Healthcare (xx% market share in 2024).
Surface Acoustic Wave Sensors Market Product Landscape
SAW sensors are characterized by their miniaturization potential, high sensitivity, and suitability for a wide range of applications. Recent innovations include improved temperature stability, enhanced linearity, and wireless integration. These advancements are driving adoption in areas demanding high precision and reliability, such as automotive safety systems and medical diagnostics. The unique selling propositions include compact size, high frequency response, and cost-effectiveness compared to other sensing technologies.
Key Drivers, Barriers & Challenges in Surface Acoustic Wave Sensors Market
Key Drivers: The increasing demand for miniaturized sensors, the growing adoption of IoT devices, and the development of advanced materials are key drivers for market expansion. Government regulations promoting safety and environmental monitoring are also creating opportunities.
Challenges: High manufacturing costs for certain types of SAW sensors, and potential supply chain disruptions related to raw materials, pose significant challenges. Competition from alternative sensing technologies is also a factor.
Emerging Opportunities in Surface Acoustic Wave Sensors Market
Emerging opportunities lie in the integration of SAW sensors into wearable technology, smart homes, and environmental monitoring systems. Further advancements in materials science and fabrication techniques are expected to unlock new applications, such as bio-sensing and industrial process control. The exploration of novel SAW sensor designs will further enhance sensitivity and selectivity.
Growth Accelerators in the Surface Acoustic Wave Sensors Market Industry
Technological advancements, particularly in thin-film SAW technology and advanced materials, are accelerating market growth. Strategic partnerships between sensor manufacturers and end-users are facilitating faster adoption. Expansion into emerging markets, including developing economies in Asia and Africa, presents significant growth potential.
Key Players Shaping the Surface Acoustic Wave Sensors Market Market
- AVX Corporation
- Honeywell International Inc. (Honeywell)
- TDK Electronics AG (TDK)
- Murata Manufacturing Co Ltd (Murata)
- Vectron International (Microchip Technology Inc.) (Microchip Technology)
- Teledyne Microwave Solutions (Teledyne Microwave)
- API Technologies Corp (API Technologies)
- Boston Piezo-Optics Inc
- CTS Corporation (CTS Corporation)
- Ceramtec
Notable Milestones in Surface Acoustic Wave Sensors Sector
- May 2021: Sensor Technology launches a new range of wireless torque sensors.
- April 2021: Okmetic releases UF-RFSi silicon substrate for TF-SAW hybrid structures.
In-Depth Surface Acoustic Wave Sensors Market Market Outlook
The Surface Acoustic Wave Sensors market is poised for continued strong growth driven by technological innovation and increasing demand across various sectors. Strategic partnerships, expansion into new applications, and advancements in materials science will further shape the market landscape. The potential for miniaturization and integration into existing systems presents significant opportunities for market expansion.
Surface Acoustic Wave Sensors Market Segmentation
-
1. Sensing Type
- 1.1. Pressure Sensors
- 1.2. Torque Sensors
- 1.3. Temperature Sensors
- 1.4. Humidity Sensors
- 1.5. Chemical Sensors
- 1.6. Other Sensors
-
2. End-User Industry
- 2.1. Automotive
- 2.2. Aerospace and Defense
- 2.3. Consumer Electronics
- 2.4. Healthcare
- 2.5. Industrial
- 2.6. Other End-User Industries
Surface Acoustic Wave Sensors Market Segmentation By Geography
- 1. North America
- 2. Europe
- 3. Asia Pacific
- 4. Rest of the World
Surface Acoustic Wave Sensors Market REPORT HIGHLIGHTS
| Aspects | Details |
|---|---|
| Study Period | 2019-2033 |
| Base Year | 2024 |
| Estimated Year | 2025 |
| Forecast Period | 2025-2033 |
| Historical Period | 2019-2024 |
| Growth Rate | CAGR of 12.29% from 2019-2033 |
| Segmentation |
|
Table of Contents
- 1. Introduction
- 1.1. Research Scope
- 1.2. Market Segmentation
- 1.3. Research Methodology
- 1.4. Definitions and Assumptions
- 2. Executive Summary
- 2.1. Introduction
- 3. Market Dynamics
- 3.1. Introduction
- 3.2. Market Drivers
- 3.2.1. Wireless and Passive Nature of Sensors; Low Manufacturing Cost
- 3.3. Market Restrains
- 3.3.1. Compatibility and Installation Issues; Limitations in Liquid Sensing
- 3.4. Market Trends
- 3.4.1. Healthcare Segment is Expected to Grow at a Significant Rate
- 4. Market Factor Analysis
- 4.1. Porters Five Forces
- 4.2. Supply/Value Chain
- 4.3. PESTEL analysis
- 4.4. Market Entropy
- 4.5. Patent/Trademark Analysis
- 5. Global Surface Acoustic Wave Sensors Market Analysis, Insights and Forecast, 2019-2031
- 5.1. Market Analysis, Insights and Forecast - by Sensing Type
- 5.1.1. Pressure Sensors
- 5.1.2. Torque Sensors
- 5.1.3. Temperature Sensors
- 5.1.4. Humidity Sensors
- 5.1.5. Chemical Sensors
- 5.1.6. Other Sensors
- 5.2. Market Analysis, Insights and Forecast - by End-User Industry
- 5.2.1. Automotive
- 5.2.2. Aerospace and Defense
- 5.2.3. Consumer Electronics
- 5.2.4. Healthcare
- 5.2.5. Industrial
- 5.2.6. Other End-User Industries
- 5.3. Market Analysis, Insights and Forecast - by Region
- 5.3.1. North America
- 5.3.2. Europe
- 5.3.3. Asia Pacific
- 5.3.4. Rest of the World
- 5.1. Market Analysis, Insights and Forecast - by Sensing Type
- 6. North America Surface Acoustic Wave Sensors Market Analysis, Insights and Forecast, 2019-2031
- 6.1. Market Analysis, Insights and Forecast - by Sensing Type
- 6.1.1. Pressure Sensors
- 6.1.2. Torque Sensors
- 6.1.3. Temperature Sensors
- 6.1.4. Humidity Sensors
- 6.1.5. Chemical Sensors
- 6.1.6. Other Sensors
- 6.2. Market Analysis, Insights and Forecast - by End-User Industry
- 6.2.1. Automotive
- 6.2.2. Aerospace and Defense
- 6.2.3. Consumer Electronics
- 6.2.4. Healthcare
- 6.2.5. Industrial
- 6.2.6. Other End-User Industries
- 6.1. Market Analysis, Insights and Forecast - by Sensing Type
- 7. Europe Surface Acoustic Wave Sensors Market Analysis, Insights and Forecast, 2019-2031
- 7.1. Market Analysis, Insights and Forecast - by Sensing Type
- 7.1.1. Pressure Sensors
- 7.1.2. Torque Sensors
- 7.1.3. Temperature Sensors
- 7.1.4. Humidity Sensors
- 7.1.5. Chemical Sensors
- 7.1.6. Other Sensors
- 7.2. Market Analysis, Insights and Forecast - by End-User Industry
- 7.2.1. Automotive
- 7.2.2. Aerospace and Defense
- 7.2.3. Consumer Electronics
- 7.2.4. Healthcare
- 7.2.5. Industrial
- 7.2.6. Other End-User Industries
- 7.1. Market Analysis, Insights and Forecast - by Sensing Type
- 8. Asia Pacific Surface Acoustic Wave Sensors Market Analysis, Insights and Forecast, 2019-2031
- 8.1. Market Analysis, Insights and Forecast - by Sensing Type
- 8.1.1. Pressure Sensors
- 8.1.2. Torque Sensors
- 8.1.3. Temperature Sensors
- 8.1.4. Humidity Sensors
- 8.1.5. Chemical Sensors
- 8.1.6. Other Sensors
- 8.2. Market Analysis, Insights and Forecast - by End-User Industry
- 8.2.1. Automotive
- 8.2.2. Aerospace and Defense
- 8.2.3. Consumer Electronics
- 8.2.4. Healthcare
- 8.2.5. Industrial
- 8.2.6. Other End-User Industries
- 8.1. Market Analysis, Insights and Forecast - by Sensing Type
- 9. Rest of the World Surface Acoustic Wave Sensors Market Analysis, Insights and Forecast, 2019-2031
- 9.1. Market Analysis, Insights and Forecast - by Sensing Type
- 9.1.1. Pressure Sensors
- 9.1.2. Torque Sensors
- 9.1.3. Temperature Sensors
- 9.1.4. Humidity Sensors
- 9.1.5. Chemical Sensors
- 9.1.6. Other Sensors
- 9.2. Market Analysis, Insights and Forecast - by End-User Industry
- 9.2.1. Automotive
- 9.2.2. Aerospace and Defense
- 9.2.3. Consumer Electronics
- 9.2.4. Healthcare
- 9.2.5. Industrial
- 9.2.6. Other End-User Industries
- 9.1. Market Analysis, Insights and Forecast - by Sensing Type
- 10. North America Surface Acoustic Wave Sensors Market Analysis, Insights and Forecast, 2019-2031
- 10.1. Market Analysis, Insights and Forecast - By Country/Sub-region
- 10.1.1 United States
- 10.1.2 Canada
- 10.1.3 Mexico
- 11. Europe Surface Acoustic Wave Sensors Market Analysis, Insights and Forecast, 2019-2031
- 11.1. Market Analysis, Insights and Forecast - By Country/Sub-region
- 11.1.1 Germany
- 11.1.2 United Kingdom
- 11.1.3 France
- 11.1.4 Spain
- 11.1.5 Italy
- 11.1.6 Spain
- 11.1.7 Belgium
- 11.1.8 Netherland
- 11.1.9 Nordics
- 11.1.10 Rest of Europe
- 12. Asia Pacific Surface Acoustic Wave Sensors Market Analysis, Insights and Forecast, 2019-2031
- 12.1. Market Analysis, Insights and Forecast - By Country/Sub-region
- 12.1.1 China
- 12.1.2 Japan
- 12.1.3 India
- 12.1.4 South Korea
- 12.1.5 Southeast Asia
- 12.1.6 Australia
- 12.1.7 Indonesia
- 12.1.8 Phillipes
- 12.1.9 Singapore
- 12.1.10 Thailandc
- 12.1.11 Rest of Asia Pacific
- 13. South America Surface Acoustic Wave Sensors Market Analysis, Insights and Forecast, 2019-2031
- 13.1. Market Analysis, Insights and Forecast - By Country/Sub-region
- 13.1.1 Brazil
- 13.1.2 Argentina
- 13.1.3 Peru
- 13.1.4 Chile
- 13.1.5 Colombia
- 13.1.6 Ecuador
- 13.1.7 Venezuela
- 13.1.8 Rest of South America
- 14. North America Surface Acoustic Wave Sensors Market Analysis, Insights and Forecast, 2019-2031
- 14.1. Market Analysis, Insights and Forecast - By Country/Sub-region
- 14.1.1 United States
- 14.1.2 Canada
- 14.1.3 Mexico
- 15. MEA Surface Acoustic Wave Sensors Market Analysis, Insights and Forecast, 2019-2031
- 15.1. Market Analysis, Insights and Forecast - By Country/Sub-region
- 15.1.1 United Arab Emirates
- 15.1.2 Saudi Arabia
- 15.1.3 South Africa
- 15.1.4 Rest of Middle East and Africa
- 16. Competitive Analysis
- 16.1. Global Market Share Analysis 2024
- 16.2. Company Profiles
- 16.2.1 AVX Corporation
- 16.2.1.1. Overview
- 16.2.1.2. Products
- 16.2.1.3. SWOT Analysis
- 16.2.1.4. Recent Developments
- 16.2.1.5. Financials (Based on Availability)
- 16.2.2 Honeywell International Inc
- 16.2.2.1. Overview
- 16.2.2.2. Products
- 16.2.2.3. SWOT Analysis
- 16.2.2.4. Recent Developments
- 16.2.2.5. Financials (Based on Availability)
- 16.2.3 TDK Electronics AG
- 16.2.3.1. Overview
- 16.2.3.2. Products
- 16.2.3.3. SWOT Analysis
- 16.2.3.4. Recent Developments
- 16.2.3.5. Financials (Based on Availability)
- 16.2.4 Murata Manufacturing Co Ltd
- 16.2.4.1. Overview
- 16.2.4.2. Products
- 16.2.4.3. SWOT Analysis
- 16.2.4.4. Recent Developments
- 16.2.4.5. Financials (Based on Availability)
- 16.2.5 Vectron International (Microchip Technology Inc )
- 16.2.5.1. Overview
- 16.2.5.2. Products
- 16.2.5.3. SWOT Analysis
- 16.2.5.4. Recent Developments
- 16.2.5.5. Financials (Based on Availability)
- 16.2.6 Teledyne Microwave Solutions
- 16.2.6.1. Overview
- 16.2.6.2. Products
- 16.2.6.3. SWOT Analysis
- 16.2.6.4. Recent Developments
- 16.2.6.5. Financials (Based on Availability)
- 16.2.7 API Technologies Corp
- 16.2.7.1. Overview
- 16.2.7.2. Products
- 16.2.7.3. SWOT Analysis
- 16.2.7.4. Recent Developments
- 16.2.7.5. Financials (Based on Availability)
- 16.2.8 Boston Piezo-Optics Inc
- 16.2.8.1. Overview
- 16.2.8.2. Products
- 16.2.8.3. SWOT Analysis
- 16.2.8.4. Recent Developments
- 16.2.8.5. Financials (Based on Availability)
- 16.2.9 CTS Corporation
- 16.2.9.1. Overview
- 16.2.9.2. Products
- 16.2.9.3. SWOT Analysis
- 16.2.9.4. Recent Developments
- 16.2.9.5. Financials (Based on Availability)
- 16.2.10 Ceramtec
- 16.2.10.1. Overview
- 16.2.10.2. Products
- 16.2.10.3. SWOT Analysis
- 16.2.10.4. Recent Developments
- 16.2.10.5. Financials (Based on Availability)
- 16.2.1 AVX Corporation
List of Figures
- Figure 1: Global Surface Acoustic Wave Sensors Market Revenue Breakdown (Million, %) by Region 2024 & 2032
- Figure 2: Global Surface Acoustic Wave Sensors Market Volume Breakdown (K Unit, %) by Region 2024 & 2032
- Figure 3: North America Surface Acoustic Wave Sensors Market Revenue (Million), by Country 2024 & 2032
- Figure 4: North America Surface Acoustic Wave Sensors Market Volume (K Unit), by Country 2024 & 2032
- Figure 5: North America Surface Acoustic Wave Sensors Market Revenue Share (%), by Country 2024 & 2032
- Figure 6: North America Surface Acoustic Wave Sensors Market Volume Share (%), by Country 2024 & 2032
- Figure 7: Europe Surface Acoustic Wave Sensors Market Revenue (Million), by Country 2024 & 2032
- Figure 8: Europe Surface Acoustic Wave Sensors Market Volume (K Unit), by Country 2024 & 2032
- Figure 9: Europe Surface Acoustic Wave Sensors Market Revenue Share (%), by Country 2024 & 2032
- Figure 10: Europe Surface Acoustic Wave Sensors Market Volume Share (%), by Country 2024 & 2032
- Figure 11: Asia Pacific Surface Acoustic Wave Sensors Market Revenue (Million), by Country 2024 & 2032
- Figure 12: Asia Pacific Surface Acoustic Wave Sensors Market Volume (K Unit), by Country 2024 & 2032
- Figure 13: Asia Pacific Surface Acoustic Wave Sensors Market Revenue Share (%), by Country 2024 & 2032
- Figure 14: Asia Pacific Surface Acoustic Wave Sensors Market Volume Share (%), by Country 2024 & 2032
- Figure 15: South America Surface Acoustic Wave Sensors Market Revenue (Million), by Country 2024 & 2032
- Figure 16: South America Surface Acoustic Wave Sensors Market Volume (K Unit), by Country 2024 & 2032
- Figure 17: South America Surface Acoustic Wave Sensors Market Revenue Share (%), by Country 2024 & 2032
- Figure 18: South America Surface Acoustic Wave Sensors Market Volume Share (%), by Country 2024 & 2032
- Figure 19: North America Surface Acoustic Wave Sensors Market Revenue (Million), by Country 2024 & 2032
- Figure 20: North America Surface Acoustic Wave Sensors Market Volume (K Unit), by Country 2024 & 2032
- Figure 21: North America Surface Acoustic Wave Sensors Market Revenue Share (%), by Country 2024 & 2032
- Figure 22: North America Surface Acoustic Wave Sensors Market Volume Share (%), by Country 2024 & 2032
- Figure 23: MEA Surface Acoustic Wave Sensors Market Revenue (Million), by Country 2024 & 2032
- Figure 24: MEA Surface Acoustic Wave Sensors Market Volume (K Unit), by Country 2024 & 2032
- Figure 25: MEA Surface Acoustic Wave Sensors Market Revenue Share (%), by Country 2024 & 2032
- Figure 26: MEA Surface Acoustic Wave Sensors Market Volume Share (%), by Country 2024 & 2032
- Figure 27: North America Surface Acoustic Wave Sensors Market Revenue (Million), by Sensing Type 2024 & 2032
- Figure 28: North America Surface Acoustic Wave Sensors Market Volume (K Unit), by Sensing Type 2024 & 2032
- Figure 29: North America Surface Acoustic Wave Sensors Market Revenue Share (%), by Sensing Type 2024 & 2032
- Figure 30: North America Surface Acoustic Wave Sensors Market Volume Share (%), by Sensing Type 2024 & 2032
- Figure 31: North America Surface Acoustic Wave Sensors Market Revenue (Million), by End-User Industry 2024 & 2032
- Figure 32: North America Surface Acoustic Wave Sensors Market Volume (K Unit), by End-User Industry 2024 & 2032
- Figure 33: North America Surface Acoustic Wave Sensors Market Revenue Share (%), by End-User Industry 2024 & 2032
- Figure 34: North America Surface Acoustic Wave Sensors Market Volume Share (%), by End-User Industry 2024 & 2032
- Figure 35: North America Surface Acoustic Wave Sensors Market Revenue (Million), by Country 2024 & 2032
- Figure 36: North America Surface Acoustic Wave Sensors Market Volume (K Unit), by Country 2024 & 2032
- Figure 37: North America Surface Acoustic Wave Sensors Market Revenue Share (%), by Country 2024 & 2032
- Figure 38: North America Surface Acoustic Wave Sensors Market Volume Share (%), by Country 2024 & 2032
- Figure 39: Europe Surface Acoustic Wave Sensors Market Revenue (Million), by Sensing Type 2024 & 2032
- Figure 40: Europe Surface Acoustic Wave Sensors Market Volume (K Unit), by Sensing Type 2024 & 2032
- Figure 41: Europe Surface Acoustic Wave Sensors Market Revenue Share (%), by Sensing Type 2024 & 2032
- Figure 42: Europe Surface Acoustic Wave Sensors Market Volume Share (%), by Sensing Type 2024 & 2032
- Figure 43: Europe Surface Acoustic Wave Sensors Market Revenue (Million), by End-User Industry 2024 & 2032
- Figure 44: Europe Surface Acoustic Wave Sensors Market Volume (K Unit), by End-User Industry 2024 & 2032
- Figure 45: Europe Surface Acoustic Wave Sensors Market Revenue Share (%), by End-User Industry 2024 & 2032
- Figure 46: Europe Surface Acoustic Wave Sensors Market Volume Share (%), by End-User Industry 2024 & 2032
- Figure 47: Europe Surface Acoustic Wave Sensors Market Revenue (Million), by Country 2024 & 2032
- Figure 48: Europe Surface Acoustic Wave Sensors Market Volume (K Unit), by Country 2024 & 2032
- Figure 49: Europe Surface Acoustic Wave Sensors Market Revenue Share (%), by Country 2024 & 2032
- Figure 50: Europe Surface Acoustic Wave Sensors Market Volume Share (%), by Country 2024 & 2032
- Figure 51: Asia Pacific Surface Acoustic Wave Sensors Market Revenue (Million), by Sensing Type 2024 & 2032
- Figure 52: Asia Pacific Surface Acoustic Wave Sensors Market Volume (K Unit), by Sensing Type 2024 & 2032
- Figure 53: Asia Pacific Surface Acoustic Wave Sensors Market Revenue Share (%), by Sensing Type 2024 & 2032
- Figure 54: Asia Pacific Surface Acoustic Wave Sensors Market Volume Share (%), by Sensing Type 2024 & 2032
- Figure 55: Asia Pacific Surface Acoustic Wave Sensors Market Revenue (Million), by End-User Industry 2024 & 2032
- Figure 56: Asia Pacific Surface Acoustic Wave Sensors Market Volume (K Unit), by End-User Industry 2024 & 2032
- Figure 57: Asia Pacific Surface Acoustic Wave Sensors Market Revenue Share (%), by End-User Industry 2024 & 2032
- Figure 58: Asia Pacific Surface Acoustic Wave Sensors Market Volume Share (%), by End-User Industry 2024 & 2032
- Figure 59: Asia Pacific Surface Acoustic Wave Sensors Market Revenue (Million), by Country 2024 & 2032
- Figure 60: Asia Pacific Surface Acoustic Wave Sensors Market Volume (K Unit), by Country 2024 & 2032
- Figure 61: Asia Pacific Surface Acoustic Wave Sensors Market Revenue Share (%), by Country 2024 & 2032
- Figure 62: Asia Pacific Surface Acoustic Wave Sensors Market Volume Share (%), by Country 2024 & 2032
- Figure 63: Rest of the World Surface Acoustic Wave Sensors Market Revenue (Million), by Sensing Type 2024 & 2032
- Figure 64: Rest of the World Surface Acoustic Wave Sensors Market Volume (K Unit), by Sensing Type 2024 & 2032
- Figure 65: Rest of the World Surface Acoustic Wave Sensors Market Revenue Share (%), by Sensing Type 2024 & 2032
- Figure 66: Rest of the World Surface Acoustic Wave Sensors Market Volume Share (%), by Sensing Type 2024 & 2032
- Figure 67: Rest of the World Surface Acoustic Wave Sensors Market Revenue (Million), by End-User Industry 2024 & 2032
- Figure 68: Rest of the World Surface Acoustic Wave Sensors Market Volume (K Unit), by End-User Industry 2024 & 2032
- Figure 69: Rest of the World Surface Acoustic Wave Sensors Market Revenue Share (%), by End-User Industry 2024 & 2032
- Figure 70: Rest of the World Surface Acoustic Wave Sensors Market Volume Share (%), by End-User Industry 2024 & 2032
- Figure 71: Rest of the World Surface Acoustic Wave Sensors Market Revenue (Million), by Country 2024 & 2032
- Figure 72: Rest of the World Surface Acoustic Wave Sensors Market Volume (K Unit), by Country 2024 & 2032
- Figure 73: Rest of the World Surface Acoustic Wave Sensors Market Revenue Share (%), by Country 2024 & 2032
- Figure 74: Rest of the World Surface Acoustic Wave Sensors Market Volume Share (%), by Country 2024 & 2032
List of Tables
- Table 1: Global Surface Acoustic Wave Sensors Market Revenue Million Forecast, by Region 2019 & 2032
- Table 2: Global Surface Acoustic Wave Sensors Market Volume K Unit Forecast, by Region 2019 & 2032
- Table 3: Global Surface Acoustic Wave Sensors Market Revenue Million Forecast, by Sensing Type 2019 & 2032
- Table 4: Global Surface Acoustic Wave Sensors Market Volume K Unit Forecast, by Sensing Type 2019 & 2032
- Table 5: Global Surface Acoustic Wave Sensors Market Revenue Million Forecast, by End-User Industry 2019 & 2032
- Table 6: Global Surface Acoustic Wave Sensors Market Volume K Unit Forecast, by End-User Industry 2019 & 2032
- Table 7: Global Surface Acoustic Wave Sensors Market Revenue Million Forecast, by Region 2019 & 2032
- Table 8: Global Surface Acoustic Wave Sensors Market Volume K Unit Forecast, by Region 2019 & 2032
- Table 9: Global Surface Acoustic Wave Sensors Market Revenue Million Forecast, by Country 2019 & 2032
- Table 10: Global Surface Acoustic Wave Sensors Market Volume K Unit Forecast, by Country 2019 & 2032
- Table 11: United States Surface Acoustic Wave Sensors Market Revenue (Million) Forecast, by Application 2019 & 2032
- Table 12: United States Surface Acoustic Wave Sensors Market Volume (K Unit) Forecast, by Application 2019 & 2032
- Table 13: Canada Surface Acoustic Wave Sensors Market Revenue (Million) Forecast, by Application 2019 & 2032
- Table 14: Canada Surface Acoustic Wave Sensors Market Volume (K Unit) Forecast, by Application 2019 & 2032
- Table 15: Mexico Surface Acoustic Wave Sensors Market Revenue (Million) Forecast, by Application 2019 & 2032
- Table 16: Mexico Surface Acoustic Wave Sensors Market Volume (K Unit) Forecast, by Application 2019 & 2032
- Table 17: Global Surface Acoustic Wave Sensors Market Revenue Million Forecast, by Country 2019 & 2032
- Table 18: Global Surface Acoustic Wave Sensors Market Volume K Unit Forecast, by Country 2019 & 2032
- Table 19: Germany Surface Acoustic Wave Sensors Market Revenue (Million) Forecast, by Application 2019 & 2032
- Table 20: Germany Surface Acoustic Wave Sensors Market Volume (K Unit) Forecast, by Application 2019 & 2032
- Table 21: United Kingdom Surface Acoustic Wave Sensors Market Revenue (Million) Forecast, by Application 2019 & 2032
- Table 22: United Kingdom Surface Acoustic Wave Sensors Market Volume (K Unit) Forecast, by Application 2019 & 2032
- Table 23: France Surface Acoustic Wave Sensors Market Revenue (Million) Forecast, by Application 2019 & 2032
- Table 24: France Surface Acoustic Wave Sensors Market Volume (K Unit) Forecast, by Application 2019 & 2032
- Table 25: Spain Surface Acoustic Wave Sensors Market Revenue (Million) Forecast, by Application 2019 & 2032
- Table 26: Spain Surface Acoustic Wave Sensors Market Volume (K Unit) Forecast, by Application 2019 & 2032
- Table 27: Italy Surface Acoustic Wave Sensors Market Revenue (Million) Forecast, by Application 2019 & 2032
- Table 28: Italy Surface Acoustic Wave Sensors Market Volume (K Unit) Forecast, by Application 2019 & 2032
- Table 29: Spain Surface Acoustic Wave Sensors Market Revenue (Million) Forecast, by Application 2019 & 2032
- Table 30: Spain Surface Acoustic Wave Sensors Market Volume (K Unit) Forecast, by Application 2019 & 2032
- Table 31: Belgium Surface Acoustic Wave Sensors Market Revenue (Million) Forecast, by Application 2019 & 2032
- Table 32: Belgium Surface Acoustic Wave Sensors Market Volume (K Unit) Forecast, by Application 2019 & 2032
- Table 33: Netherland Surface Acoustic Wave Sensors Market Revenue (Million) Forecast, by Application 2019 & 2032
- Table 34: Netherland Surface Acoustic Wave Sensors Market Volume (K Unit) Forecast, by Application 2019 & 2032
- Table 35: Nordics Surface Acoustic Wave Sensors Market Revenue (Million) Forecast, by Application 2019 & 2032
- Table 36: Nordics Surface Acoustic Wave Sensors Market Volume (K Unit) Forecast, by Application 2019 & 2032
- Table 37: Rest of Europe Surface Acoustic Wave Sensors Market Revenue (Million) Forecast, by Application 2019 & 2032
- Table 38: Rest of Europe Surface Acoustic Wave Sensors Market Volume (K Unit) Forecast, by Application 2019 & 2032
- Table 39: Global Surface Acoustic Wave Sensors Market Revenue Million Forecast, by Country 2019 & 2032
- Table 40: Global Surface Acoustic Wave Sensors Market Volume K Unit Forecast, by Country 2019 & 2032
- Table 41: China Surface Acoustic Wave Sensors Market Revenue (Million) Forecast, by Application 2019 & 2032
- Table 42: China Surface Acoustic Wave Sensors Market Volume (K Unit) Forecast, by Application 2019 & 2032
- Table 43: Japan Surface Acoustic Wave Sensors Market Revenue (Million) Forecast, by Application 2019 & 2032
- Table 44: Japan Surface Acoustic Wave Sensors Market Volume (K Unit) Forecast, by Application 2019 & 2032
- Table 45: India Surface Acoustic Wave Sensors Market Revenue (Million) Forecast, by Application 2019 & 2032
- Table 46: India Surface Acoustic Wave Sensors Market Volume (K Unit) Forecast, by Application 2019 & 2032
- Table 47: South Korea Surface Acoustic Wave Sensors Market Revenue (Million) Forecast, by Application 2019 & 2032
- Table 48: South Korea Surface Acoustic Wave Sensors Market Volume (K Unit) Forecast, by Application 2019 & 2032
- Table 49: Southeast Asia Surface Acoustic Wave Sensors Market Revenue (Million) Forecast, by Application 2019 & 2032
- Table 50: Southeast Asia Surface Acoustic Wave Sensors Market Volume (K Unit) Forecast, by Application 2019 & 2032
- Table 51: Australia Surface Acoustic Wave Sensors Market Revenue (Million) Forecast, by Application 2019 & 2032
- Table 52: Australia Surface Acoustic Wave Sensors Market Volume (K Unit) Forecast, by Application 2019 & 2032
- Table 53: Indonesia Surface Acoustic Wave Sensors Market Revenue (Million) Forecast, by Application 2019 & 2032
- Table 54: Indonesia Surface Acoustic Wave Sensors Market Volume (K Unit) Forecast, by Application 2019 & 2032
- Table 55: Phillipes Surface Acoustic Wave Sensors Market Revenue (Million) Forecast, by Application 2019 & 2032
- Table 56: Phillipes Surface Acoustic Wave Sensors Market Volume (K Unit) Forecast, by Application 2019 & 2032
- Table 57: Singapore Surface Acoustic Wave Sensors Market Revenue (Million) Forecast, by Application 2019 & 2032
- Table 58: Singapore Surface Acoustic Wave Sensors Market Volume (K Unit) Forecast, by Application 2019 & 2032
- Table 59: Thailandc Surface Acoustic Wave Sensors Market Revenue (Million) Forecast, by Application 2019 & 2032
- Table 60: Thailandc Surface Acoustic Wave Sensors Market Volume (K Unit) Forecast, by Application 2019 & 2032
- Table 61: Rest of Asia Pacific Surface Acoustic Wave Sensors Market Revenue (Million) Forecast, by Application 2019 & 2032
- Table 62: Rest of Asia Pacific Surface Acoustic Wave Sensors Market Volume (K Unit) Forecast, by Application 2019 & 2032
- Table 63: Global Surface Acoustic Wave Sensors Market Revenue Million Forecast, by Country 2019 & 2032
- Table 64: Global Surface Acoustic Wave Sensors Market Volume K Unit Forecast, by Country 2019 & 2032
- Table 65: Brazil Surface Acoustic Wave Sensors Market Revenue (Million) Forecast, by Application 2019 & 2032
- Table 66: Brazil Surface Acoustic Wave Sensors Market Volume (K Unit) Forecast, by Application 2019 & 2032
- Table 67: Argentina Surface Acoustic Wave Sensors Market Revenue (Million) Forecast, by Application 2019 & 2032
- Table 68: Argentina Surface Acoustic Wave Sensors Market Volume (K Unit) Forecast, by Application 2019 & 2032
- Table 69: Peru Surface Acoustic Wave Sensors Market Revenue (Million) Forecast, by Application 2019 & 2032
- Table 70: Peru Surface Acoustic Wave Sensors Market Volume (K Unit) Forecast, by Application 2019 & 2032
- Table 71: Chile Surface Acoustic Wave Sensors Market Revenue (Million) Forecast, by Application 2019 & 2032
- Table 72: Chile Surface Acoustic Wave Sensors Market Volume (K Unit) Forecast, by Application 2019 & 2032
- Table 73: Colombia Surface Acoustic Wave Sensors Market Revenue (Million) Forecast, by Application 2019 & 2032
- Table 74: Colombia Surface Acoustic Wave Sensors Market Volume (K Unit) Forecast, by Application 2019 & 2032
- Table 75: Ecuador Surface Acoustic Wave Sensors Market Revenue (Million) Forecast, by Application 2019 & 2032
- Table 76: Ecuador Surface Acoustic Wave Sensors Market Volume (K Unit) Forecast, by Application 2019 & 2032
- Table 77: Venezuela Surface Acoustic Wave Sensors Market Revenue (Million) Forecast, by Application 2019 & 2032
- Table 78: Venezuela Surface Acoustic Wave Sensors Market Volume (K Unit) Forecast, by Application 2019 & 2032
- Table 79: Rest of South America Surface Acoustic Wave Sensors Market Revenue (Million) Forecast, by Application 2019 & 2032
- Table 80: Rest of South America Surface Acoustic Wave Sensors Market Volume (K Unit) Forecast, by Application 2019 & 2032
- Table 81: Global Surface Acoustic Wave Sensors Market Revenue Million Forecast, by Country 2019 & 2032
- Table 82: Global Surface Acoustic Wave Sensors Market Volume K Unit Forecast, by Country 2019 & 2032
- Table 83: United States Surface Acoustic Wave Sensors Market Revenue (Million) Forecast, by Application 2019 & 2032
- Table 84: United States Surface Acoustic Wave Sensors Market Volume (K Unit) Forecast, by Application 2019 & 2032
- Table 85: Canada Surface Acoustic Wave Sensors Market Revenue (Million) Forecast, by Application 2019 & 2032
- Table 86: Canada Surface Acoustic Wave Sensors Market Volume (K Unit) Forecast, by Application 2019 & 2032
- Table 87: Mexico Surface Acoustic Wave Sensors Market Revenue (Million) Forecast, by Application 2019 & 2032
- Table 88: Mexico Surface Acoustic Wave Sensors Market Volume (K Unit) Forecast, by Application 2019 & 2032
- Table 89: Global Surface Acoustic Wave Sensors Market Revenue Million Forecast, by Country 2019 & 2032
- Table 90: Global Surface Acoustic Wave Sensors Market Volume K Unit Forecast, by Country 2019 & 2032
- Table 91: United Arab Emirates Surface Acoustic Wave Sensors Market Revenue (Million) Forecast, by Application 2019 & 2032
- Table 92: United Arab Emirates Surface Acoustic Wave Sensors Market Volume (K Unit) Forecast, by Application 2019 & 2032
- Table 93: Saudi Arabia Surface Acoustic Wave Sensors Market Revenue (Million) Forecast, by Application 2019 & 2032
- Table 94: Saudi Arabia Surface Acoustic Wave Sensors Market Volume (K Unit) Forecast, by Application 2019 & 2032
- Table 95: South Africa Surface Acoustic Wave Sensors Market Revenue (Million) Forecast, by Application 2019 & 2032
- Table 96: South Africa Surface Acoustic Wave Sensors Market Volume (K Unit) Forecast, by Application 2019 & 2032
- Table 97: Rest of Middle East and Africa Surface Acoustic Wave Sensors Market Revenue (Million) Forecast, by Application 2019 & 2032
- Table 98: Rest of Middle East and Africa Surface Acoustic Wave Sensors Market Volume (K Unit) Forecast, by Application 2019 & 2032
- Table 99: Global Surface Acoustic Wave Sensors Market Revenue Million Forecast, by Sensing Type 2019 & 2032
- Table 100: Global Surface Acoustic Wave Sensors Market Volume K Unit Forecast, by Sensing Type 2019 & 2032
- Table 101: Global Surface Acoustic Wave Sensors Market Revenue Million Forecast, by End-User Industry 2019 & 2032
- Table 102: Global Surface Acoustic Wave Sensors Market Volume K Unit Forecast, by End-User Industry 2019 & 2032
- Table 103: Global Surface Acoustic Wave Sensors Market Revenue Million Forecast, by Country 2019 & 2032
- Table 104: Global Surface Acoustic Wave Sensors Market Volume K Unit Forecast, by Country 2019 & 2032
- Table 105: Global Surface Acoustic Wave Sensors Market Revenue Million Forecast, by Sensing Type 2019 & 2032
- Table 106: Global Surface Acoustic Wave Sensors Market Volume K Unit Forecast, by Sensing Type 2019 & 2032
- Table 107: Global Surface Acoustic Wave Sensors Market Revenue Million Forecast, by End-User Industry 2019 & 2032
- Table 108: Global Surface Acoustic Wave Sensors Market Volume K Unit Forecast, by End-User Industry 2019 & 2032
- Table 109: Global Surface Acoustic Wave Sensors Market Revenue Million Forecast, by Country 2019 & 2032
- Table 110: Global Surface Acoustic Wave Sensors Market Volume K Unit Forecast, by Country 2019 & 2032
- Table 111: Global Surface Acoustic Wave Sensors Market Revenue Million Forecast, by Sensing Type 2019 & 2032
- Table 112: Global Surface Acoustic Wave Sensors Market Volume K Unit Forecast, by Sensing Type 2019 & 2032
- Table 113: Global Surface Acoustic Wave Sensors Market Revenue Million Forecast, by End-User Industry 2019 & 2032
- Table 114: Global Surface Acoustic Wave Sensors Market Volume K Unit Forecast, by End-User Industry 2019 & 2032
- Table 115: Global Surface Acoustic Wave Sensors Market Revenue Million Forecast, by Country 2019 & 2032
- Table 116: Global Surface Acoustic Wave Sensors Market Volume K Unit Forecast, by Country 2019 & 2032
- Table 117: Global Surface Acoustic Wave Sensors Market Revenue Million Forecast, by Sensing Type 2019 & 2032
- Table 118: Global Surface Acoustic Wave Sensors Market Volume K Unit Forecast, by Sensing Type 2019 & 2032
- Table 119: Global Surface Acoustic Wave Sensors Market Revenue Million Forecast, by End-User Industry 2019 & 2032
- Table 120: Global Surface Acoustic Wave Sensors Market Volume K Unit Forecast, by End-User Industry 2019 & 2032
- Table 121: Global Surface Acoustic Wave Sensors Market Revenue Million Forecast, by Country 2019 & 2032
- Table 122: Global Surface Acoustic Wave Sensors Market Volume K Unit Forecast, by Country 2019 & 2032
Frequently Asked Questions
1. What is the projected Compound Annual Growth Rate (CAGR) of the Surface Acoustic Wave Sensors Market?
The projected CAGR is approximately 12.29%.
2. Which companies are prominent players in the Surface Acoustic Wave Sensors Market?
Key companies in the market include AVX Corporation, Honeywell International Inc, TDK Electronics AG, Murata Manufacturing Co Ltd , Vectron International (Microchip Technology Inc ), Teledyne Microwave Solutions, API Technologies Corp, Boston Piezo-Optics Inc, CTS Corporation, Ceramtec.
3. What are the main segments of the Surface Acoustic Wave Sensors Market?
The market segments include Sensing Type, End-User Industry.
4. Can you provide details about the market size?
The market size is estimated to be USD 1.03 Million as of 2022.
5. What are some drivers contributing to market growth?
Wireless and Passive Nature of Sensors; Low Manufacturing Cost.
6. What are the notable trends driving market growth?
Healthcare Segment is Expected to Grow at a Significant Rate.
7. Are there any restraints impacting market growth?
Compatibility and Installation Issues; Limitations in Liquid Sensing.
8. Can you provide examples of recent developments in the market?
May 2021 - Sensor Technology has launched a new range of wireless torque sensors based on a full four-element strain gauge bridge design, complementing its existing non-contact sensors that use surface acoustic wave (SAW) detection. The SGR510/520 series design also compensates for any extraneous forces, such as bending moments that are inadvertently applied to the sensor, which improves sensitivity and has a wide temperature tolerance. The units have a 250% over-range reading capacity, allowing sudden spikes in torque to be measured and recorded accurately.
9. What pricing options are available for accessing the report?
Pricing options include single-user, multi-user, and enterprise licenses priced at USD 4750, USD 5250, and USD 8750 respectively.
10. Is the market size provided in terms of value or volume?
The market size is provided in terms of value, measured in Million and volume, measured in K Unit.
11. Are there any specific market keywords associated with the report?
Yes, the market keyword associated with the report is "Surface Acoustic Wave Sensors Market," which aids in identifying and referencing the specific market segment covered.
12. How do I determine which pricing option suits my needs best?
The pricing options vary based on user requirements and access needs. Individual users may opt for single-user licenses, while businesses requiring broader access may choose multi-user or enterprise licenses for cost-effective access to the report.
13. Are there any additional resources or data provided in the Surface Acoustic Wave Sensors Market report?
While the report offers comprehensive insights, it's advisable to review the specific contents or supplementary materials provided to ascertain if additional resources or data are available.
14. How can I stay updated on further developments or reports in the Surface Acoustic Wave Sensors Market?
To stay informed about further developments, trends, and reports in the Surface Acoustic Wave Sensors Market, consider subscribing to industry newsletters, following relevant companies and organizations, or regularly checking reputable industry news sources and publications.
Methodology
Step 1 - Identification of Relevant Samples Size from Population Database


Step 2 - Approaches for Defining Global Market Size (Value, Volume* & Price*)

Note*: In applicable scenarios
Step 3 - Data Sources
Primary Research
- Web Analytics
- Survey Reports
- Research Institute
- Latest Research Reports
- Opinion Leaders
Secondary Research
- Annual Reports
- White Paper
- Latest Press Release
- Industry Association
- Paid Database
- Investor Presentations

Step 4 - Data Triangulation
Involves using different sources of information in order to increase the validity of a study
These sources are likely to be stakeholders in a program - participants, other researchers, program staff, other community members, and so on.
Then we put all data in single framework & apply various statistical tools to find out the dynamic on the market.
During the analysis stage, feedback from the stakeholder groups would be compared to determine areas of agreement as well as areas of divergence


