

Key Insights
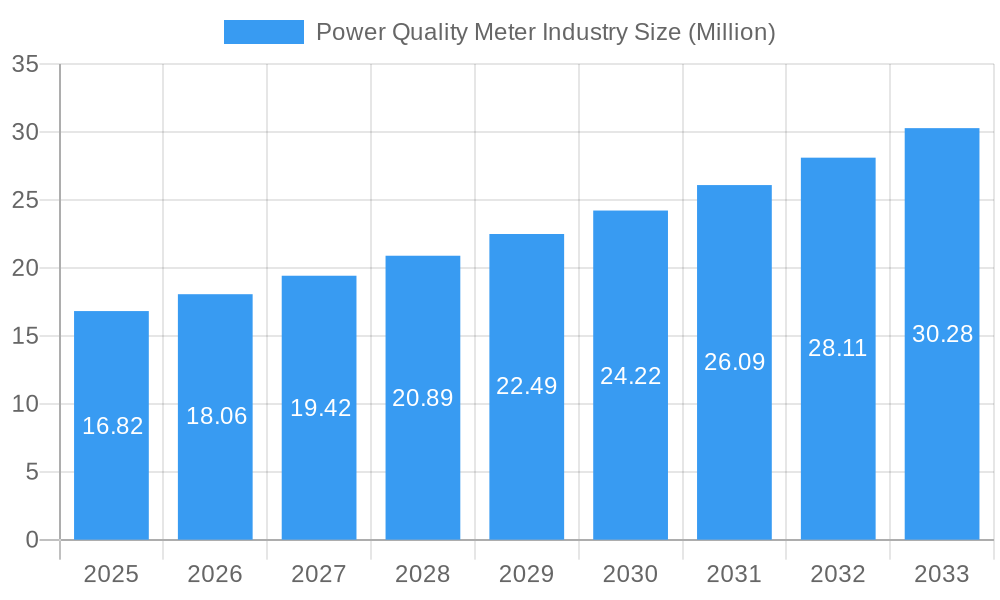
The global power quality meter market, valued at $16.82 million in 2025, is projected to experience robust growth, driven by increasing industrial automation, stringent grid regulations, and the growing adoption of renewable energy sources. The market's Compound Annual Growth Rate (CAGR) of 7.40% from 2025 to 2033 indicates a significant expansion opportunity. Key drivers include the rising demand for enhanced energy efficiency and reliability across various sectors, including industrial and manufacturing, commercial, and utilities. The increasing complexity of power grids, coupled with the intermittent nature of renewable energy sources, necessitates sophisticated power quality monitoring, fueling demand for advanced power quality meters. Furthermore, the growing awareness of power quality issues and their potential impact on operational efficiency and equipment lifespan is driving investments in these meters. Segmentation analysis reveals a strong preference for three-phase meters within the industrial and manufacturing sectors, while single-phase meters find higher demand in commercial applications. Major players like Eaton, Schneider Electric, and Siemens are strategically investing in R&D to develop advanced functionalities such as data analytics and predictive maintenance capabilities, further bolstering market growth. Geographically, North America and Europe currently dominate the market, but the Asia-Pacific region is anticipated to witness significant growth driven by rapid industrialization and urbanization.
Power Quality Meter Industry Market Size (In Million)
The competitive landscape is marked by the presence of established players offering a range of power quality meters catering to diverse applications and user needs. While established companies hold a significant market share, the emergence of innovative technologies and startups offering niche solutions presents both opportunities and challenges. Market restraints include the relatively high initial investment costs associated with deploying power quality monitoring systems, especially in smaller enterprises. However, the long-term benefits in terms of improved operational efficiency and cost savings are likely to overcome this barrier, particularly with the availability of financing options and government incentives in some regions. Future growth will likely be driven by the integration of smart grid technologies, the development of advanced analytical capabilities within the meters, and the increasing need for real-time monitoring and control of power quality.
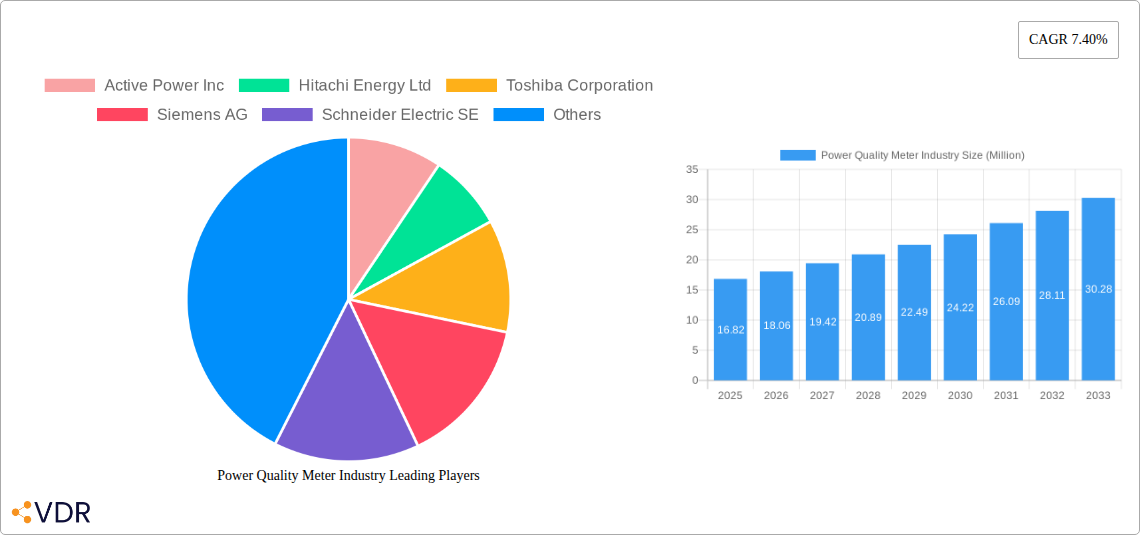
Power Quality Meter Industry Company Market Share
Power Quality Meter Industry Market Report: 2019-2033
This comprehensive report provides a detailed analysis of the Power Quality Meter industry, encompassing market dynamics, growth trends, regional dominance, product landscape, key players, and future outlook. The study period covers 2019-2033, with 2025 as the base year and forecast period spanning 2025-2033. The report leverages extensive market research to offer invaluable insights for industry professionals, investors, and strategists. The report explores the parent market of Power Quality Equipment and its child market of Power Quality Meters, providing a granular view of market segmentation by equipment type (UPS, Harmonic Filters, Static VAR Compensators, Power Quality Meters, Other Equipment), phase (Single Phase, Three Phase), and end-user (Industrial & Manufacturing, Commercial, Others).
Keywords: Power Quality Meter, Power Quality Equipment, UPS, Harmonic Filters, Static VAR Compensator, Smart Grids, Power Quality Monitoring, Energy Efficiency, Industrial Automation, Market Analysis, Market Forecast, Market Size, CAGR, Competitive Landscape, Siemens, Schneider Electric, Eaton, GE, Hitachi Energy, Toshiba.
Power Quality Meter Industry Market Dynamics & Structure
The power quality meter market is characterized by moderate concentration, with several established players holding significant market share. Technological innovation, driven by the increasing demand for efficient energy management and grid stability, is a key driver. Stringent regulatory frameworks, particularly concerning grid modernization and renewable energy integration, are shaping market growth. The rise of smart grids and the adoption of digital technologies are fostering competition among established players and creating opportunities for new entrants. Competitive substitutes include traditional monitoring methods and basic power measurement tools; however, the advanced features and data analytics capabilities of modern power quality meters are driving adoption. The end-user landscape comprises diverse sectors, with the industrial and manufacturing segments exhibiting the highest demand due to the criticality of power quality in their operations. M&A activity has been relatively moderate in recent years, with strategic acquisitions focused on enhancing technological capabilities and expanding market reach.
- Market Concentration: Moderately concentrated, with top 5 players holding approximately xx% market share in 2025.
- Technological Innovation: Driven by advancements in digital signal processing, communication protocols (e.g., IoT), and data analytics.
- Regulatory Frameworks: Stringent standards for grid stability and renewable energy integration are driving demand.
- Competitive Substitutes: Traditional monitoring methods, presenting limited data insights compared to advanced meters.
- End-User Demographics: Industrial and manufacturing sectors dominate, followed by commercial and other end-users.
- M&A Trends: Moderate activity focused on technology enhancement and market expansion; xx deals recorded between 2019-2024.
Power Quality Meter Industry Growth Trends & Insights
The power quality meter market is experiencing robust growth, driven by factors such as the increasing adoption of renewable energy sources, the rising need for energy efficiency, and the expansion of smart grid infrastructure. The global market size is estimated at xx Million units in 2025 and is projected to reach xx Million units by 2033, exhibiting a CAGR of xx% during the forecast period. Adoption rates are increasing across various sectors, particularly in industrial settings. Technological disruptions, including the integration of IoT and AI capabilities into power quality meters, are enhancing their functionality and market appeal. Consumer behavior is shifting towards demand for real-time monitoring, predictive maintenance, and comprehensive data analytics, fueling demand for advanced meter features.
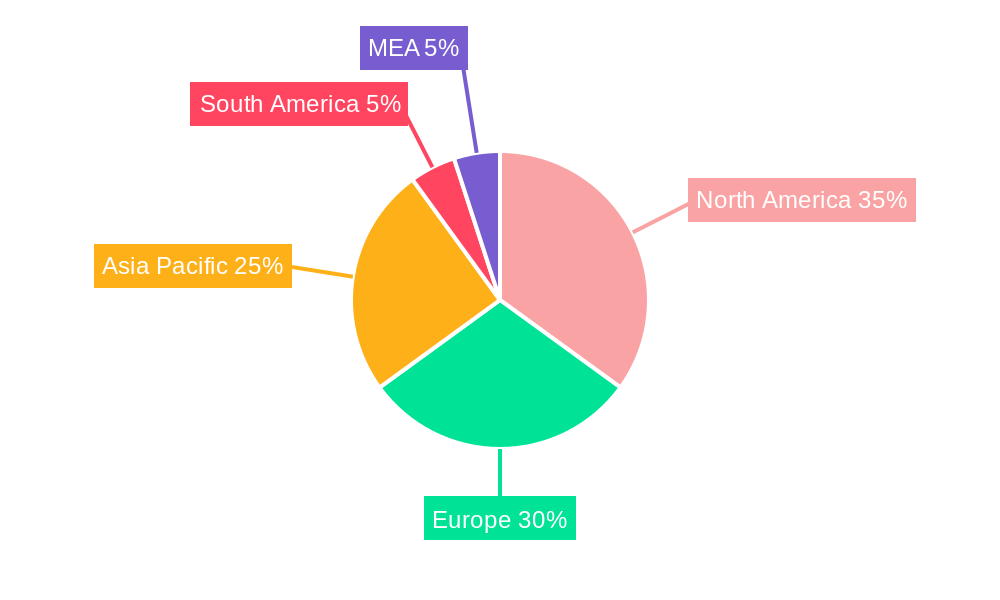
Dominant Regions, Countries, or Segments in Power Quality Meter Industry
North America and Europe currently dominate the power quality meter market, driven by advanced grid infrastructure, stringent regulatory policies, and high industrialization. Within these regions, Germany and the US hold leading positions, supported by substantial investments in grid modernization and renewable energy integration. The industrial and manufacturing segment exhibits the highest growth potential, followed by the commercial sector. The three-phase segment holds a larger market share compared to the single-phase segment due to the prevalence of three-phase power systems in industrial applications.
- Key Drivers: Government initiatives promoting grid modernization and renewable energy adoption, stringent regulations regarding power quality, and increasing industrial automation.
- Dominance Factors: Advanced grid infrastructure, high industrialization, and strong regulatory frameworks in North America and Europe.
- Growth Potential: Industrial and manufacturing sector presents the highest growth opportunities, followed by the commercial sector; three-phase meters demonstrate higher growth.
Power Quality Meter Industry Product Landscape
Power quality meters are evolving from basic measurement devices to sophisticated monitoring systems, integrating advanced functionalities such as data logging, communication interfaces, and data analytics. Modern meters offer real-time power quality monitoring, harmonic analysis, power factor correction, and event recording. These capabilities are crucial for energy efficiency improvements, preventative maintenance, and optimized power system operations. Unique selling propositions include enhanced accuracy, improved data visualization, and remote monitoring capabilities. Technological advancements focus on miniaturization, improved communication protocols (e.g., 5G, IoT), and AI-powered analytics for predictive maintenance.
Key Drivers, Barriers & Challenges in Power Quality Meter Industry
Key Drivers:
- The growing adoption of renewable energy sources necessitates advanced power quality monitoring.
- Stringent regulations and grid modernization initiatives are driving demand.
- Increasing industrial automation requires reliable and precise power quality monitoring.
Challenges and Restraints:
- High initial investment costs for advanced power quality meters can hinder adoption.
- Complex integration with existing infrastructure can present challenges.
- Competition from low-cost alternatives may limit market growth in certain segments. Supply chain disruptions can impact production and availability.
Emerging Opportunities in Power Quality Meter Industry
- Untapped markets in developing economies offer substantial growth potential.
- Integration of AI and machine learning for predictive maintenance and anomaly detection is creating new opportunities.
- Demand for advanced analytics and data visualization capabilities is driving innovation.
Growth Accelerators in the Power Quality Meter Industry
Technological breakthroughs in sensor technology, communication protocols, and data analytics are propelling market growth. Strategic partnerships between meter manufacturers and software providers are enhancing data analytics capabilities. Market expansion into developing economies and diversification into niche applications, such as smart homes and microgrids, are further contributing to long-term growth.
Key Players Shaping the Power Quality Meter Industry Market
Notable Milestones in Power Quality Meter Industry Sector
- June 2023: Germany's government announces plans to digitalize its grid, mandating a 20% smart meter rollout by 2025 and 50% by 2028. This significantly boosts the demand for advanced power quality meters capable of integration with smart grid infrastructure.
- March 2023: GE opens the 300-MW Biblis Grid Stability Power Plant, highlighting the increasing focus on grid stability and the need for robust power quality monitoring solutions.
In-Depth Power Quality Meter Industry Market Outlook
The power quality meter market is poised for sustained growth, driven by the ongoing expansion of smart grids, the increasing adoption of renewable energy, and the growing demand for advanced data analytics. Strategic partnerships, technological innovation, and market expansion into new sectors present significant opportunities for market participants. The focus on energy efficiency, predictive maintenance, and grid modernization will continue to shape market dynamics, offering substantial growth potential throughout the forecast period.
Power Quality Meter Industry Segmentation
-
1. Equipment
- 1.1. Uninterruptable Power Supply (UPS)
- 1.2. Harmonic Filters
- 1.3. Static VAR Compensator
- 1.4. Power Quality Meters
- 1.5. Other Equipment Types
-
2. Phase
- 2.1. Single Phase
- 2.2. Three Phase
-
3. End-Users
- 3.1. Industrial and Manufacturing
- 3.2. Commercial
- 3.3. Others End-Users
Power Quality Meter Industry Segmentation By Geography
-
1. North America
- 1.1. United States
- 1.2. Canada
- 1.3. Rest of North America
-
2. Europe
- 2.1. Germany
- 2.2. France
- 2.3. United Kingdom
- 2.4. Italy
- 2.5. Rest of Europe
-
3. Asia Pacific
- 3.1. China
- 3.2. India
- 3.3. Japan
- 3.4. Australia
- 3.5. Rest of Asia Pacific
-
4. South America
- 4.1. Brazil
- 4.2. Argentina
- 4.3. Chile
- 4.4. Rest of South America
-
5. Middle East and Africa
- 5.1. United Arab Emirates
- 5.2. Qatar
- 5.3. Saudi Arabia
- 5.4. South Africa
- 5.5. Egypt
- 5.6. Rest of Middle East and Africa
Power Quality Meter Industry Regional Market Share
Geographic Coverage of Power Quality Meter Industry
Power Quality Meter Industry REPORT HIGHLIGHTS
| Aspects | Details |
|---|---|
| Study Period | 2020-2034 |
| Base Year | 2025 |
| Estimated Year | 2026 |
| Forecast Period | 2026-2034 |
| Historical Period | 2020-2025 |
| Growth Rate | CAGR of 7.40% from 2020-2034 |
| Segmentation |
|
Table of Contents
- 1. Introduction
- 1.1. Research Scope
- 1.2. Market Segmentation
- 1.3. Research Objective
- 1.4. Definitions and Assumptions
- 2. Executive Summary
- 2.1. Market Snapshot
- 3. Market Dynamics
- 3.1. Market Drivers
- 3.2. Market Restrains
- 3.3. Market Trends
- 3.4. Market Opportunities
- 4. Market Factor Analysis
- 4.1. Porters Five Forces
- 4.1.1. Bargaining Power of Suppliers
- 4.1.2. Bargaining Power of Buyers
- 4.1.3. Threat of New Entrants
- 4.1.4. Threat of Substitutes
- 4.1.5. Competitive Rivalry
- 4.2. PESTEL analysis
- 4.3. BCG Analysis
- 4.3.1. Stars (High Growth, High Market Share)
- 4.3.2. Cash Cows (Low Growth, High Market Share)
- 4.3.3. Question Mark (High Growth, Low Market Share)
- 4.3.4. Dogs (Low Growth, Low Market Share)
- 4.4. Ansoff Matrix Analysis
- 4.5. Supply Chain Analysis
- 4.6. Regulatory Landscape
- 4.7. Current Market Potential and Opportunity Assessment (TAM–SAM–SOM Framework)
- 4.8. VDR Analyst Note
- 4.1. Porters Five Forces
- 5. Market Analysis, Insights and Forecast 2021-2033
- 5.1. Market Analysis, Insights and Forecast - by Equipment
- 5.1.1. Uninterruptable Power Supply (UPS)
- 5.1.2. Harmonic Filters
- 5.1.3. Static VAR Compensator
- 5.1.4. Power Quality Meters
- 5.1.5. Other Equipment Types
- 5.2. Market Analysis, Insights and Forecast - by Phase
- 5.2.1. Single Phase
- 5.2.2. Three Phase
- 5.3. Market Analysis, Insights and Forecast - by End-Users
- 5.3.1. Industrial and Manufacturing
- 5.3.2. Commercial
- 5.3.3. Others End-Users
- 5.4. Market Analysis, Insights and Forecast - by Region
- 5.4.1. North America
- 5.4.2. Europe
- 5.4.3. Asia Pacific
- 5.4.4. South America
- 5.4.5. Middle East and Africa
- 5.1. Market Analysis, Insights and Forecast - by Equipment
- 6. Global Power Quality Meter Industry Analysis, Insights and Forecast, 2021-2033
- 6.1. Market Analysis, Insights and Forecast - by Equipment
- 6.1.1. Uninterruptable Power Supply (UPS)
- 6.1.2. Harmonic Filters
- 6.1.3. Static VAR Compensator
- 6.1.4. Power Quality Meters
- 6.1.5. Other Equipment Types
- 6.2. Market Analysis, Insights and Forecast - by Phase
- 6.2.1. Single Phase
- 6.2.2. Three Phase
- 6.3. Market Analysis, Insights and Forecast - by End-Users
- 6.3.1. Industrial and Manufacturing
- 6.3.2. Commercial
- 6.3.3. Others End-Users
- 6.1. Market Analysis, Insights and Forecast - by Equipment
- 7. North America Power Quality Meter Industry Analysis, Insights and Forecast, 2021-2033
- 7.1. Market Analysis, Insights and Forecast - by Equipment
- 7.1.1. Uninterruptable Power Supply (UPS)
- 7.1.2. Harmonic Filters
- 7.1.3. Static VAR Compensator
- 7.1.4. Power Quality Meters
- 7.1.5. Other Equipment Types
- 7.2. Market Analysis, Insights and Forecast - by Phase
- 7.2.1. Single Phase
- 7.2.2. Three Phase
- 7.3. Market Analysis, Insights and Forecast - by End-Users
- 7.3.1. Industrial and Manufacturing
- 7.3.2. Commercial
- 7.3.3. Others End-Users
- 7.1. Market Analysis, Insights and Forecast - by Equipment
- 8. Europe Power Quality Meter Industry Analysis, Insights and Forecast, 2021-2033
- 8.1. Market Analysis, Insights and Forecast - by Equipment
- 8.1.1. Uninterruptable Power Supply (UPS)
- 8.1.2. Harmonic Filters
- 8.1.3. Static VAR Compensator
- 8.1.4. Power Quality Meters
- 8.1.5. Other Equipment Types
- 8.2. Market Analysis, Insights and Forecast - by Phase
- 8.2.1. Single Phase
- 8.2.2. Three Phase
- 8.3. Market Analysis, Insights and Forecast - by End-Users
- 8.3.1. Industrial and Manufacturing
- 8.3.2. Commercial
- 8.3.3. Others End-Users
- 8.1. Market Analysis, Insights and Forecast - by Equipment
- 9. Asia Pacific Power Quality Meter Industry Analysis, Insights and Forecast, 2021-2033
- 9.1. Market Analysis, Insights and Forecast - by Equipment
- 9.1.1. Uninterruptable Power Supply (UPS)
- 9.1.2. Harmonic Filters
- 9.1.3. Static VAR Compensator
- 9.1.4. Power Quality Meters
- 9.1.5. Other Equipment Types
- 9.2. Market Analysis, Insights and Forecast - by Phase
- 9.2.1. Single Phase
- 9.2.2. Three Phase
- 9.3. Market Analysis, Insights and Forecast - by End-Users
- 9.3.1. Industrial and Manufacturing
- 9.3.2. Commercial
- 9.3.3. Others End-Users
- 9.1. Market Analysis, Insights and Forecast - by Equipment
- 10. South America Power Quality Meter Industry Analysis, Insights and Forecast, 2021-2033
- 10.1. Market Analysis, Insights and Forecast - by Equipment
- 10.1.1. Uninterruptable Power Supply (UPS)
- 10.1.2. Harmonic Filters
- 10.1.3. Static VAR Compensator
- 10.1.4. Power Quality Meters
- 10.1.5. Other Equipment Types
- 10.2. Market Analysis, Insights and Forecast - by Phase
- 10.2.1. Single Phase
- 10.2.2. Three Phase
- 10.3. Market Analysis, Insights and Forecast - by End-Users
- 10.3.1. Industrial and Manufacturing
- 10.3.2. Commercial
- 10.3.3. Others End-Users
- 10.1. Market Analysis, Insights and Forecast - by Equipment
- 11. Middle East and Africa Power Quality Meter Industry Analysis, Insights and Forecast, 2021-2033
- 11.1. Market Analysis, Insights and Forecast - by Equipment
- 11.1.1. Uninterruptable Power Supply (UPS)
- 11.1.2. Harmonic Filters
- 11.1.3. Static VAR Compensator
- 11.1.4. Power Quality Meters
- 11.1.5. Other Equipment Types
- 11.2. Market Analysis, Insights and Forecast - by Phase
- 11.2.1. Single Phase
- 11.2.2. Three Phase
- 11.3. Market Analysis, Insights and Forecast - by End-Users
- 11.3.1. Industrial and Manufacturing
- 11.3.2. Commercial
- 11.3.3. Others End-Users
- 11.1. Market Analysis, Insights and Forecast - by Equipment
- 12. Competitive Analysis
- 12.1. Company Profiles
- 12.1.1 Active Power Inc
- 12.1.1.1. Company Overview
- 12.1.1.2. Products
- 12.1.1.3. Company Financials
- 12.1.1.4. SWOT Analysis
- 12.1.2 Hitachi Energy Ltd
- 12.1.2.1. Company Overview
- 12.1.2.2. Products
- 12.1.2.3. Company Financials
- 12.1.2.4. SWOT Analysis
- 12.1.3 Toshiba Corporation
- 12.1.3.1. Company Overview
- 12.1.3.2. Products
- 12.1.3.3. Company Financials
- 12.1.3.4. SWOT Analysis
- 12.1.4 Siemens AG
- 12.1.4.1. Company Overview
- 12.1.4.2. Products
- 12.1.4.3. Company Financials
- 12.1.4.4. SWOT Analysis
- 12.1.5 Schneider Electric SE
- 12.1.5.1. Company Overview
- 12.1.5.2. Products
- 12.1.5.3. Company Financials
- 12.1.5.4. SWOT Analysis
- 12.1.6 EATON Corporation Plc
- 12.1.6.1. Company Overview
- 12.1.6.2. Products
- 12.1.6.3. Company Financials
- 12.1.6.4. SWOT Analysis
- 12.1.7 MTE Corporation
- 12.1.7.1. Company Overview
- 12.1.7.2. Products
- 12.1.7.3. Company Financials
- 12.1.7.4. SWOT Analysis
- 12.1.8 General Electric Company
- 12.1.8.1. Company Overview
- 12.1.8.2. Products
- 12.1.8.3. Company Financials
- 12.1.8.4. SWOT Analysis
- 12.1.9 Schaffner
- 12.1.9.1. Company Overview
- 12.1.9.2. Products
- 12.1.9.3. Company Financials
- 12.1.9.4. SWOT Analysis
- 12.1.10 Emerson Electric Company
- 12.1.10.1. Company Overview
- 12.1.10.2. Products
- 12.1.10.3. Company Financials
- 12.1.10.4. SWOT Analysis
- 12.1.1 Active Power Inc
- 12.2. Market Entropy
- 12.2.1 Company's Key Areas Served
- 12.2.2 Recent Developments
- 12.3. Company Market Share Analysis 2025
- 12.3.1 Top 5 Companies Market Share Analysis
- 12.3.2 Top 3 Companies Market Share Analysis
- 12.4. List of Potential Customers
- 13. Research Methodology
List of Figures
- Figure 1: Global Power Quality Meter Industry Revenue Breakdown (Million, %) by Region 2025 & 2033
- Figure 2: Global Power Quality Meter Industry Volume Breakdown (K Unit, %) by Region 2025 & 2033
- Figure 3: North America Power Quality Meter Industry Revenue (Million), by Equipment 2025 & 2033
- Figure 4: North America Power Quality Meter Industry Volume (K Unit), by Equipment 2025 & 2033
- Figure 5: North America Power Quality Meter Industry Revenue Share (%), by Equipment 2025 & 2033
- Figure 6: North America Power Quality Meter Industry Volume Share (%), by Equipment 2025 & 2033
- Figure 7: North America Power Quality Meter Industry Revenue (Million), by Phase 2025 & 2033
- Figure 8: North America Power Quality Meter Industry Volume (K Unit), by Phase 2025 & 2033
- Figure 9: North America Power Quality Meter Industry Revenue Share (%), by Phase 2025 & 2033
- Figure 10: North America Power Quality Meter Industry Volume Share (%), by Phase 2025 & 2033
- Figure 11: North America Power Quality Meter Industry Revenue (Million), by End-Users 2025 & 2033
- Figure 12: North America Power Quality Meter Industry Volume (K Unit), by End-Users 2025 & 2033
- Figure 13: North America Power Quality Meter Industry Revenue Share (%), by End-Users 2025 & 2033
- Figure 14: North America Power Quality Meter Industry Volume Share (%), by End-Users 2025 & 2033
- Figure 15: North America Power Quality Meter Industry Revenue (Million), by Country 2025 & 2033
- Figure 16: North America Power Quality Meter Industry Volume (K Unit), by Country 2025 & 2033
- Figure 17: North America Power Quality Meter Industry Revenue Share (%), by Country 2025 & 2033
- Figure 18: North America Power Quality Meter Industry Volume Share (%), by Country 2025 & 2033
- Figure 19: Europe Power Quality Meter Industry Revenue (Million), by Equipment 2025 & 2033
- Figure 20: Europe Power Quality Meter Industry Volume (K Unit), by Equipment 2025 & 2033
- Figure 21: Europe Power Quality Meter Industry Revenue Share (%), by Equipment 2025 & 2033
- Figure 22: Europe Power Quality Meter Industry Volume Share (%), by Equipment 2025 & 2033
- Figure 23: Europe Power Quality Meter Industry Revenue (Million), by Phase 2025 & 2033
- Figure 24: Europe Power Quality Meter Industry Volume (K Unit), by Phase 2025 & 2033
- Figure 25: Europe Power Quality Meter Industry Revenue Share (%), by Phase 2025 & 2033
- Figure 26: Europe Power Quality Meter Industry Volume Share (%), by Phase 2025 & 2033
- Figure 27: Europe Power Quality Meter Industry Revenue (Million), by End-Users 2025 & 2033
- Figure 28: Europe Power Quality Meter Industry Volume (K Unit), by End-Users 2025 & 2033
- Figure 29: Europe Power Quality Meter Industry Revenue Share (%), by End-Users 2025 & 2033
- Figure 30: Europe Power Quality Meter Industry Volume Share (%), by End-Users 2025 & 2033
- Figure 31: Europe Power Quality Meter Industry Revenue (Million), by Country 2025 & 2033
- Figure 32: Europe Power Quality Meter Industry Volume (K Unit), by Country 2025 & 2033
- Figure 33: Europe Power Quality Meter Industry Revenue Share (%), by Country 2025 & 2033
- Figure 34: Europe Power Quality Meter Industry Volume Share (%), by Country 2025 & 2033
- Figure 35: Asia Pacific Power Quality Meter Industry Revenue (Million), by Equipment 2025 & 2033
- Figure 36: Asia Pacific Power Quality Meter Industry Volume (K Unit), by Equipment 2025 & 2033
- Figure 37: Asia Pacific Power Quality Meter Industry Revenue Share (%), by Equipment 2025 & 2033
- Figure 38: Asia Pacific Power Quality Meter Industry Volume Share (%), by Equipment 2025 & 2033
- Figure 39: Asia Pacific Power Quality Meter Industry Revenue (Million), by Phase 2025 & 2033
- Figure 40: Asia Pacific Power Quality Meter Industry Volume (K Unit), by Phase 2025 & 2033
- Figure 41: Asia Pacific Power Quality Meter Industry Revenue Share (%), by Phase 2025 & 2033
- Figure 42: Asia Pacific Power Quality Meter Industry Volume Share (%), by Phase 2025 & 2033
- Figure 43: Asia Pacific Power Quality Meter Industry Revenue (Million), by End-Users 2025 & 2033
- Figure 44: Asia Pacific Power Quality Meter Industry Volume (K Unit), by End-Users 2025 & 2033
- Figure 45: Asia Pacific Power Quality Meter Industry Revenue Share (%), by End-Users 2025 & 2033
- Figure 46: Asia Pacific Power Quality Meter Industry Volume Share (%), by End-Users 2025 & 2033
- Figure 47: Asia Pacific Power Quality Meter Industry Revenue (Million), by Country 2025 & 2033
- Figure 48: Asia Pacific Power Quality Meter Industry Volume (K Unit), by Country 2025 & 2033
- Figure 49: Asia Pacific Power Quality Meter Industry Revenue Share (%), by Country 2025 & 2033
- Figure 50: Asia Pacific Power Quality Meter Industry Volume Share (%), by Country 2025 & 2033
- Figure 51: South America Power Quality Meter Industry Revenue (Million), by Equipment 2025 & 2033
- Figure 52: South America Power Quality Meter Industry Volume (K Unit), by Equipment 2025 & 2033
- Figure 53: South America Power Quality Meter Industry Revenue Share (%), by Equipment 2025 & 2033
- Figure 54: South America Power Quality Meter Industry Volume Share (%), by Equipment 2025 & 2033
- Figure 55: South America Power Quality Meter Industry Revenue (Million), by Phase 2025 & 2033
- Figure 56: South America Power Quality Meter Industry Volume (K Unit), by Phase 2025 & 2033
- Figure 57: South America Power Quality Meter Industry Revenue Share (%), by Phase 2025 & 2033
- Figure 58: South America Power Quality Meter Industry Volume Share (%), by Phase 2025 & 2033
- Figure 59: South America Power Quality Meter Industry Revenue (Million), by End-Users 2025 & 2033
- Figure 60: South America Power Quality Meter Industry Volume (K Unit), by End-Users 2025 & 2033
- Figure 61: South America Power Quality Meter Industry Revenue Share (%), by End-Users 2025 & 2033
- Figure 62: South America Power Quality Meter Industry Volume Share (%), by End-Users 2025 & 2033
- Figure 63: South America Power Quality Meter Industry Revenue (Million), by Country 2025 & 2033
- Figure 64: South America Power Quality Meter Industry Volume (K Unit), by Country 2025 & 2033
- Figure 65: South America Power Quality Meter Industry Revenue Share (%), by Country 2025 & 2033
- Figure 66: South America Power Quality Meter Industry Volume Share (%), by Country 2025 & 2033
- Figure 67: Middle East and Africa Power Quality Meter Industry Revenue (Million), by Equipment 2025 & 2033
- Figure 68: Middle East and Africa Power Quality Meter Industry Volume (K Unit), by Equipment 2025 & 2033
- Figure 69: Middle East and Africa Power Quality Meter Industry Revenue Share (%), by Equipment 2025 & 2033
- Figure 70: Middle East and Africa Power Quality Meter Industry Volume Share (%), by Equipment 2025 & 2033
- Figure 71: Middle East and Africa Power Quality Meter Industry Revenue (Million), by Phase 2025 & 2033
- Figure 72: Middle East and Africa Power Quality Meter Industry Volume (K Unit), by Phase 2025 & 2033
- Figure 73: Middle East and Africa Power Quality Meter Industry Revenue Share (%), by Phase 2025 & 2033
- Figure 74: Middle East and Africa Power Quality Meter Industry Volume Share (%), by Phase 2025 & 2033
- Figure 75: Middle East and Africa Power Quality Meter Industry Revenue (Million), by End-Users 2025 & 2033
- Figure 76: Middle East and Africa Power Quality Meter Industry Volume (K Unit), by End-Users 2025 & 2033
- Figure 77: Middle East and Africa Power Quality Meter Industry Revenue Share (%), by End-Users 2025 & 2033
- Figure 78: Middle East and Africa Power Quality Meter Industry Volume Share (%), by End-Users 2025 & 2033
- Figure 79: Middle East and Africa Power Quality Meter Industry Revenue (Million), by Country 2025 & 2033
- Figure 80: Middle East and Africa Power Quality Meter Industry Volume (K Unit), by Country 2025 & 2033
- Figure 81: Middle East and Africa Power Quality Meter Industry Revenue Share (%), by Country 2025 & 2033
- Figure 82: Middle East and Africa Power Quality Meter Industry Volume Share (%), by Country 2025 & 2033
List of Tables
- Table 1: Global Power Quality Meter Industry Revenue Million Forecast, by Equipment 2020 & 2033
- Table 2: Global Power Quality Meter Industry Volume K Unit Forecast, by Equipment 2020 & 2033
- Table 3: Global Power Quality Meter Industry Revenue Million Forecast, by Phase 2020 & 2033
- Table 4: Global Power Quality Meter Industry Volume K Unit Forecast, by Phase 2020 & 2033
- Table 5: Global Power Quality Meter Industry Revenue Million Forecast, by End-Users 2020 & 2033
- Table 6: Global Power Quality Meter Industry Volume K Unit Forecast, by End-Users 2020 & 2033
- Table 7: Global Power Quality Meter Industry Revenue Million Forecast, by Region 2020 & 2033
- Table 8: Global Power Quality Meter Industry Volume K Unit Forecast, by Region 2020 & 2033
- Table 9: Global Power Quality Meter Industry Revenue Million Forecast, by Equipment 2020 & 2033
- Table 10: Global Power Quality Meter Industry Volume K Unit Forecast, by Equipment 2020 & 2033
- Table 11: Global Power Quality Meter Industry Revenue Million Forecast, by Phase 2020 & 2033
- Table 12: Global Power Quality Meter Industry Volume K Unit Forecast, by Phase 2020 & 2033
- Table 13: Global Power Quality Meter Industry Revenue Million Forecast, by End-Users 2020 & 2033
- Table 14: Global Power Quality Meter Industry Volume K Unit Forecast, by End-Users 2020 & 2033
- Table 15: Global Power Quality Meter Industry Revenue Million Forecast, by Country 2020 & 2033
- Table 16: Global Power Quality Meter Industry Volume K Unit Forecast, by Country 2020 & 2033
- Table 17: United States Power Quality Meter Industry Revenue (Million) Forecast, by Application 2020 & 2033
- Table 18: United States Power Quality Meter Industry Volume (K Unit) Forecast, by Application 2020 & 2033
- Table 19: Canada Power Quality Meter Industry Revenue (Million) Forecast, by Application 2020 & 2033
- Table 20: Canada Power Quality Meter Industry Volume (K Unit) Forecast, by Application 2020 & 2033
- Table 21: Rest of North America Power Quality Meter Industry Revenue (Million) Forecast, by Application 2020 & 2033
- Table 22: Rest of North America Power Quality Meter Industry Volume (K Unit) Forecast, by Application 2020 & 2033
- Table 23: Global Power Quality Meter Industry Revenue Million Forecast, by Equipment 2020 & 2033
- Table 24: Global Power Quality Meter Industry Volume K Unit Forecast, by Equipment 2020 & 2033
- Table 25: Global Power Quality Meter Industry Revenue Million Forecast, by Phase 2020 & 2033
- Table 26: Global Power Quality Meter Industry Volume K Unit Forecast, by Phase 2020 & 2033
- Table 27: Global Power Quality Meter Industry Revenue Million Forecast, by End-Users 2020 & 2033
- Table 28: Global Power Quality Meter Industry Volume K Unit Forecast, by End-Users 2020 & 2033
- Table 29: Global Power Quality Meter Industry Revenue Million Forecast, by Country 2020 & 2033
- Table 30: Global Power Quality Meter Industry Volume K Unit Forecast, by Country 2020 & 2033
- Table 31: Germany Power Quality Meter Industry Revenue (Million) Forecast, by Application 2020 & 2033
- Table 32: Germany Power Quality Meter Industry Volume (K Unit) Forecast, by Application 2020 & 2033
- Table 33: France Power Quality Meter Industry Revenue (Million) Forecast, by Application 2020 & 2033
- Table 34: France Power Quality Meter Industry Volume (K Unit) Forecast, by Application 2020 & 2033
- Table 35: United Kingdom Power Quality Meter Industry Revenue (Million) Forecast, by Application 2020 & 2033
- Table 36: United Kingdom Power Quality Meter Industry Volume (K Unit) Forecast, by Application 2020 & 2033
- Table 37: Italy Power Quality Meter Industry Revenue (Million) Forecast, by Application 2020 & 2033
- Table 38: Italy Power Quality Meter Industry Volume (K Unit) Forecast, by Application 2020 & 2033
- Table 39: Rest of Europe Power Quality Meter Industry Revenue (Million) Forecast, by Application 2020 & 2033
- Table 40: Rest of Europe Power Quality Meter Industry Volume (K Unit) Forecast, by Application 2020 & 2033
- Table 41: Global Power Quality Meter Industry Revenue Million Forecast, by Equipment 2020 & 2033
- Table 42: Global Power Quality Meter Industry Volume K Unit Forecast, by Equipment 2020 & 2033
- Table 43: Global Power Quality Meter Industry Revenue Million Forecast, by Phase 2020 & 2033
- Table 44: Global Power Quality Meter Industry Volume K Unit Forecast, by Phase 2020 & 2033
- Table 45: Global Power Quality Meter Industry Revenue Million Forecast, by End-Users 2020 & 2033
- Table 46: Global Power Quality Meter Industry Volume K Unit Forecast, by End-Users 2020 & 2033
- Table 47: Global Power Quality Meter Industry Revenue Million Forecast, by Country 2020 & 2033
- Table 48: Global Power Quality Meter Industry Volume K Unit Forecast, by Country 2020 & 2033
- Table 49: China Power Quality Meter Industry Revenue (Million) Forecast, by Application 2020 & 2033
- Table 50: China Power Quality Meter Industry Volume (K Unit) Forecast, by Application 2020 & 2033
- Table 51: India Power Quality Meter Industry Revenue (Million) Forecast, by Application 2020 & 2033
- Table 52: India Power Quality Meter Industry Volume (K Unit) Forecast, by Application 2020 & 2033
- Table 53: Japan Power Quality Meter Industry Revenue (Million) Forecast, by Application 2020 & 2033
- Table 54: Japan Power Quality Meter Industry Volume (K Unit) Forecast, by Application 2020 & 2033
- Table 55: Australia Power Quality Meter Industry Revenue (Million) Forecast, by Application 2020 & 2033
- Table 56: Australia Power Quality Meter Industry Volume (K Unit) Forecast, by Application 2020 & 2033
- Table 57: Rest of Asia Pacific Power Quality Meter Industry Revenue (Million) Forecast, by Application 2020 & 2033
- Table 58: Rest of Asia Pacific Power Quality Meter Industry Volume (K Unit) Forecast, by Application 2020 & 2033
- Table 59: Global Power Quality Meter Industry Revenue Million Forecast, by Equipment 2020 & 2033
- Table 60: Global Power Quality Meter Industry Volume K Unit Forecast, by Equipment 2020 & 2033
- Table 61: Global Power Quality Meter Industry Revenue Million Forecast, by Phase 2020 & 2033
- Table 62: Global Power Quality Meter Industry Volume K Unit Forecast, by Phase 2020 & 2033
- Table 63: Global Power Quality Meter Industry Revenue Million Forecast, by End-Users 2020 & 2033
- Table 64: Global Power Quality Meter Industry Volume K Unit Forecast, by End-Users 2020 & 2033
- Table 65: Global Power Quality Meter Industry Revenue Million Forecast, by Country 2020 & 2033
- Table 66: Global Power Quality Meter Industry Volume K Unit Forecast, by Country 2020 & 2033
- Table 67: Brazil Power Quality Meter Industry Revenue (Million) Forecast, by Application 2020 & 2033
- Table 68: Brazil Power Quality Meter Industry Volume (K Unit) Forecast, by Application 2020 & 2033
- Table 69: Argentina Power Quality Meter Industry Revenue (Million) Forecast, by Application 2020 & 2033
- Table 70: Argentina Power Quality Meter Industry Volume (K Unit) Forecast, by Application 2020 & 2033
- Table 71: Chile Power Quality Meter Industry Revenue (Million) Forecast, by Application 2020 & 2033
- Table 72: Chile Power Quality Meter Industry Volume (K Unit) Forecast, by Application 2020 & 2033
- Table 73: Rest of South America Power Quality Meter Industry Revenue (Million) Forecast, by Application 2020 & 2033
- Table 74: Rest of South America Power Quality Meter Industry Volume (K Unit) Forecast, by Application 2020 & 2033
- Table 75: Global Power Quality Meter Industry Revenue Million Forecast, by Equipment 2020 & 2033
- Table 76: Global Power Quality Meter Industry Volume K Unit Forecast, by Equipment 2020 & 2033
- Table 77: Global Power Quality Meter Industry Revenue Million Forecast, by Phase 2020 & 2033
- Table 78: Global Power Quality Meter Industry Volume K Unit Forecast, by Phase 2020 & 2033
- Table 79: Global Power Quality Meter Industry Revenue Million Forecast, by End-Users 2020 & 2033
- Table 80: Global Power Quality Meter Industry Volume K Unit Forecast, by End-Users 2020 & 2033
- Table 81: Global Power Quality Meter Industry Revenue Million Forecast, by Country 2020 & 2033
- Table 82: Global Power Quality Meter Industry Volume K Unit Forecast, by Country 2020 & 2033
- Table 83: United Arab Emirates Power Quality Meter Industry Revenue (Million) Forecast, by Application 2020 & 2033
- Table 84: United Arab Emirates Power Quality Meter Industry Volume (K Unit) Forecast, by Application 2020 & 2033
- Table 85: Qatar Power Quality Meter Industry Revenue (Million) Forecast, by Application 2020 & 2033
- Table 86: Qatar Power Quality Meter Industry Volume (K Unit) Forecast, by Application 2020 & 2033
- Table 87: Saudi Arabia Power Quality Meter Industry Revenue (Million) Forecast, by Application 2020 & 2033
- Table 88: Saudi Arabia Power Quality Meter Industry Volume (K Unit) Forecast, by Application 2020 & 2033
- Table 89: South Africa Power Quality Meter Industry Revenue (Million) Forecast, by Application 2020 & 2033
- Table 90: South Africa Power Quality Meter Industry Volume (K Unit) Forecast, by Application 2020 & 2033
- Table 91: Egypt Power Quality Meter Industry Revenue (Million) Forecast, by Application 2020 & 2033
- Table 92: Egypt Power Quality Meter Industry Volume (K Unit) Forecast, by Application 2020 & 2033
- Table 93: Rest of Middle East and Africa Power Quality Meter Industry Revenue (Million) Forecast, by Application 2020 & 2033
- Table 94: Rest of Middle East and Africa Power Quality Meter Industry Volume (K Unit) Forecast, by Application 2020 & 2033
Frequently Asked Questions
1. What is the projected Compound Annual Growth Rate (CAGR) of the Power Quality Meter Industry?
The projected CAGR is approximately 7.40%.
2. Which companies are prominent players in the Power Quality Meter Industry?
Key companies in the market include Active Power Inc, Hitachi Energy Ltd, Toshiba Corporation, Siemens AG, Schneider Electric SE, EATON Corporation Plc, MTE Corporation, General Electric Company, Schaffner, Emerson Electric Company.
3. What are the main segments of the Power Quality Meter Industry?
The market segments include Equipment, Phase, End-Users.
4. Can you provide details about the market size?
The market size is estimated to be USD 16.82 Million as of 2022.
5. What are some drivers contributing to market growth?
4.; Increasing Demand For Power Quality In Industrial And Manufacturing Sectors4.; Increase In Smart Grid Infrastructure.
6. What are the notable trends driving market growth?
Industrial and Manufacturing Segment to Dominate the Market.
7. Are there any restraints impacting market growth?
4.; High Costs Of Power Quality Equipment.
8. Can you provide examples of recent developments in the market?
In June 2023, Germany’s Government announced plans to digitalise its grid, notably at the low-voltage or distribution level, through a new “smart grids” legal framework. The Metering Point Operation Act mandates a 20% roll-out of smart meters by the end of 2025 and 50% by the end of 2028.
9. What pricing options are available for accessing the report?
Pricing options include single-user, multi-user, and enterprise licenses priced at USD 4750, USD 5250, and USD 8750 respectively.
10. Is the market size provided in terms of value or volume?
The market size is provided in terms of value, measured in Million and volume, measured in K Unit.
11. Are there any specific market keywords associated with the report?
Yes, the market keyword associated with the report is "Power Quality Meter Industry," which aids in identifying and referencing the specific market segment covered.
12. How do I determine which pricing option suits my needs best?
The pricing options vary based on user requirements and access needs. Individual users may opt for single-user licenses, while businesses requiring broader access may choose multi-user or enterprise licenses for cost-effective access to the report.
13. Are there any additional resources or data provided in the Power Quality Meter Industry report?
While the report offers comprehensive insights, it's advisable to review the specific contents or supplementary materials provided to ascertain if additional resources or data are available.
14. How can I stay updated on further developments or reports in the Power Quality Meter Industry?
To stay informed about further developments, trends, and reports in the Power Quality Meter Industry, consider subscribing to industry newsletters, following relevant companies and organizations, or regularly checking reputable industry news sources and publications.
Methodology
Step 1 - Identification of Relevant Samples Size from Population Database


Step 2 - Approaches for Defining Global Market Size (Value, Volume* & Price*)

Note*: In applicable scenarios
Step 3 - Data Sources
Primary Research
- Web Analytics
- Survey Reports
- Research Institute
- Latest Research Reports
- Opinion Leaders
Secondary Research
- Annual Reports
- White Paper
- Latest Press Release
- Industry Association
- Paid Database
- Investor Presentations

Step 4 - Data Triangulation
Involves using different sources of information in order to increase the validity of a study
These sources are likely to be stakeholders in a program - participants, other researchers, program staff, other community members, and so on.
Then we put all data in single framework & apply various statistical tools to find out the dynamic on the market.
During the analysis stage, feedback from the stakeholder groups would be compared to determine areas of agreement as well as areas of divergence