


Key Insights
The global top drive drilling market is experiencing robust growth, driven by increasing offshore drilling activities, the rising demand for efficient and precise drilling operations, and the expanding adoption of electric top drives for enhanced automation and environmental sustainability. The market's Compound Annual Growth Rate (CAGR) exceeding 4.50% signifies a healthy and expanding sector. Key segments within the market include electric and hydraulic top drives, each catering to specific operational needs and preferences. The location of deployment, encompassing onshore and offshore operations, further diversifies market segments, with offshore drilling commanding a significant premium due to the complexities involved. Leading players like Aker Solutions, CNPC, and Nabors Industries are actively shaping market dynamics through technological innovation, strategic partnerships, and expansion into new geographical areas. The North American market, particularly the United States, currently holds a substantial share, driven by a robust oil and gas exploration and production sector. However, growth in the Asia-Pacific region, especially in countries like China and India, is projected to accelerate significantly, fueled by rising energy demands and increased investments in infrastructure development.
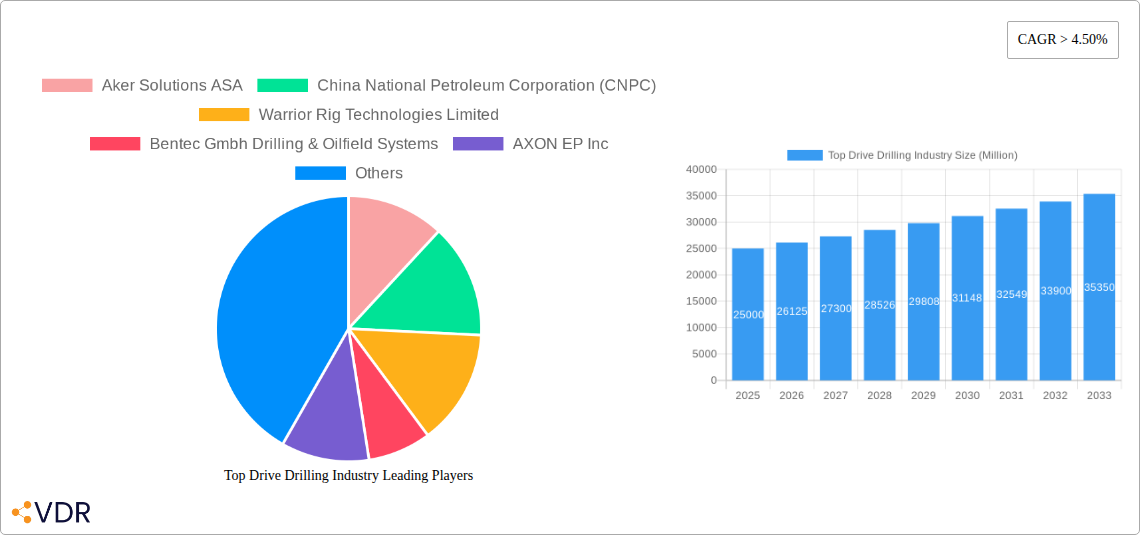
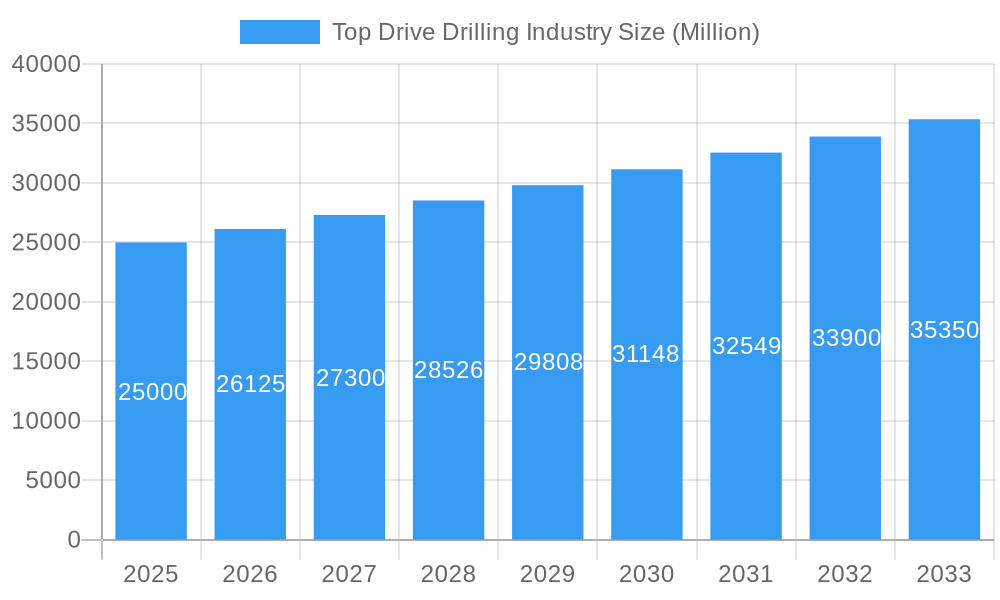
Top Drive Drilling Industry Market Size (In Billion)

Market restraints include fluctuating oil and gas prices, stringent environmental regulations, and the inherent risks associated with offshore drilling. Despite these challenges, the long-term outlook remains positive, propelled by technological advancements, increasing exploration in deepwater and harsh environments, and a sustained global need for energy resources. The market is likely to see continued consolidation among existing players, alongside the emergence of new entrants offering innovative solutions. Specific regional growth will vary based on individual energy policies and investment climates. The transition towards more environmentally friendly drilling technologies, including electric top drives, will further accelerate market growth in the coming years, as the industry strives for reduced carbon emissions and operational efficiency. The shift towards automation and digitalization will also play a pivotal role in shaping the future competitive landscape.
Top Drive Drilling Industry Company Market Share
Top Drive Drilling Industry Market Report: 2019-2033
This comprehensive report provides a detailed analysis of the Top Drive Drilling industry, encompassing market dynamics, growth trends, regional insights, and key player profiles. The study period spans from 2019 to 2033, with 2025 serving as the base and estimated year. This report is essential for industry professionals, investors, and strategic decision-makers seeking a thorough understanding of this dynamic market. The report covers both parent markets (oil and gas drilling equipment) and child markets (electric and hydraulic top drives, onshore and offshore deployments).
Top Drive Drilling Industry Market Dynamics & Structure
This section analyzes the competitive landscape, technological advancements, and regulatory influences shaping the Top Drive Drilling market. The global Top Drive Drilling market size was valued at xx Million in 2024 and is projected to reach xx Million by 2033, exhibiting a CAGR of xx% during the forecast period (2025-2033).
- Market Concentration: The market is moderately concentrated, with key players holding significant market share. However, the presence of several smaller, specialized companies fosters competition. The top 5 players account for approximately xx% of the market share in 2025.
- Technological Innovation: Continuous advancements in electric top drive technology, automation, and data analytics are driving market growth and efficiency improvements. Innovation is focused on reducing operational costs and improving drilling performance.
- Regulatory Framework: Stringent safety regulations and environmental concerns are influencing product design and operational practices. Compliance costs are a key factor in the overall cost structure.
- Competitive Product Substitutes: While top drives are the dominant technology, alternative drilling methods pose some level of competition, particularly in niche applications.
- End-User Demographics: The primary end-users are oil and gas exploration and production companies, with significant variations in demand based on geographic location and project type. Onshore drilling operations dominate in terms of unit volume but offshore deployments typically involve more sophisticated and higher value top drive systems.
- M&A Trends: The industry has seen a moderate level of mergers and acquisitions activity in recent years, driven by strategic expansion and technological consolidation. Approximately xx M&A deals were recorded in the period 2019-2024.
Top Drive Drilling Industry Growth Trends & Insights
The Top Drive Drilling market is experiencing robust growth fueled by increasing global energy demand and exploration activities. This section analyzes market size evolution, adoption rates across different segments, and the impact of technological advancements. The historical period (2019-2024) showed a CAGR of xx%, while the forecast period (2025-2033) anticipates a CAGR of xx%. This growth is primarily driven by the rising demand for efficient and technologically advanced drilling systems and the focus on enhancing operational safety and reducing environmental impact. Increased automation, improved data analytics, and the adoption of electric top drives are further accelerating market growth. Consumer behavior shifts towards sustainable drilling practices and a preference for advanced technologies also contribute positively to the market’s trajectory. Market penetration of electric top drives is expected to increase from xx% in 2025 to xx% by 2033, indicating a clear market preference for this technology.
Dominant Regions, Countries, or Segments in Top Drive Drilling Industry
The North American and Middle Eastern regions currently dominate the top drive drilling market, driven by extensive exploration activities and significant investments in oil and gas infrastructure. However, the Asia-Pacific region is expected to witness significant growth in the coming years due to increasing energy demand and rising investments in drilling infrastructure in countries such as China and India.
Type: The electric top drive segment is experiencing faster growth compared to the hydraulic top drive segment, driven by its superior efficiency, precision, and environmental benefits.
Location of Deployment: Onshore deployments currently constitute the larger share of the market, while the offshore segment is expected to grow at a faster rate due to increasing deepwater exploration activities. The offshore segment is also characterized by higher average value orders.
Key Drivers:
- Robust oil and gas exploration activities in key regions.
- Growing demand for efficient and advanced drilling technologies.
- Increasing investments in offshore drilling projects.
- Favorable government policies and regulatory frameworks in some regions.
Top Drive Drilling Industry Product Landscape
The Top Drive Drilling market offers a range of products catering to diverse drilling needs. Key product features include enhanced automation, improved torque capacity, precise control systems, and advanced safety features. Electric top drives are gaining prominence due to their energy efficiency and reduced emissions. Continuous innovation focuses on higher drilling speeds, improved reliability, and data-driven optimization capabilities. Unique selling propositions include reduced downtime, improved drilling accuracy, and enhanced operational safety.
Key Drivers, Barriers & Challenges in Top Drive Drilling Industry
Key Drivers:
- Increasing global energy demand drives exploration and production activities.
- Advancements in electric top drive technology improve efficiency and reduce costs.
- Government support and incentives for oil and gas exploration.
Key Challenges and Restraints:
- Fluctuations in oil prices impact investment in new drilling projects.
- Environmental concerns and stringent regulations increase operational costs.
- Competition from alternative drilling technologies and established players. This competition could limit growth by 5% by 2030.
Emerging Opportunities in Top Drive Drilling Industry
- Growth in unconventional drilling methods creates demand for specialized top drive systems.
- The increasing focus on digitalization and data analytics presents opportunities for innovative solutions.
- Emerging markets in developing economies offer untapped growth potential.
Growth Accelerators in the Top Drive Drilling Industry Industry
Technological advancements in automation, data analytics, and electric drive systems are key catalysts for long-term growth. Strategic partnerships between top drive manufacturers and oil and gas companies facilitate market expansion and innovation. The development of sustainable and environmentally friendly drilling technologies will also contribute significantly to future growth. Government policies promoting energy independence also create conducive market conditions.
Key Players Shaping the Top Drive Drilling Industry Market
- Aker Solutions ASA
- China National Petroleum Corporation (CNPC)
- Warrior Rig Technologies Limited
- Bentec GmbH Drilling & Oilfield Systems
- AXON EP Inc
- Herrenknecht Vertical GmbH
- Nabors Industries Ltd
- Drillmec Inc
- National-Oilwell Varco Inc
- Schlumberger Limited
- Atlas Copco Ltd
Notable Milestones in Top Drive Drilling Industry Sector
- January 2022: Abu Dhabi National Oil Company (ADNOC) awarded framework agreements worth USD 1.94 billion to four top-tier companies (Adnoc Drilling, Schlumberger, Haliburton, and Weatherford) to boost drilling activities, impacting market growth positively.
In-Depth Top Drive Drilling Industry Market Outlook
The Top Drive Drilling industry is poised for sustained growth driven by increasing global energy demand, technological innovation, and strategic investments in oil and gas exploration. The market's future potential lies in embracing automation, digitalization, and sustainable drilling practices. Companies that effectively leverage these trends and develop innovative solutions are well-positioned to capture significant market share and drive long-term growth.
Top Drive Drilling Industry Segmentation
-
1. Type
- 1.1. Electric Top Drive
- 1.2. Hydraulic Top Drive
-
2. Location of Deployment
- 2.1. Onshore
- 2.2. Offshore
Top Drive Drilling Industry Segmentation By Geography
- 1. North America
- 2. Europe
- 3. Asia Pacific
- 4. South America
- 5. Middle East and Africa
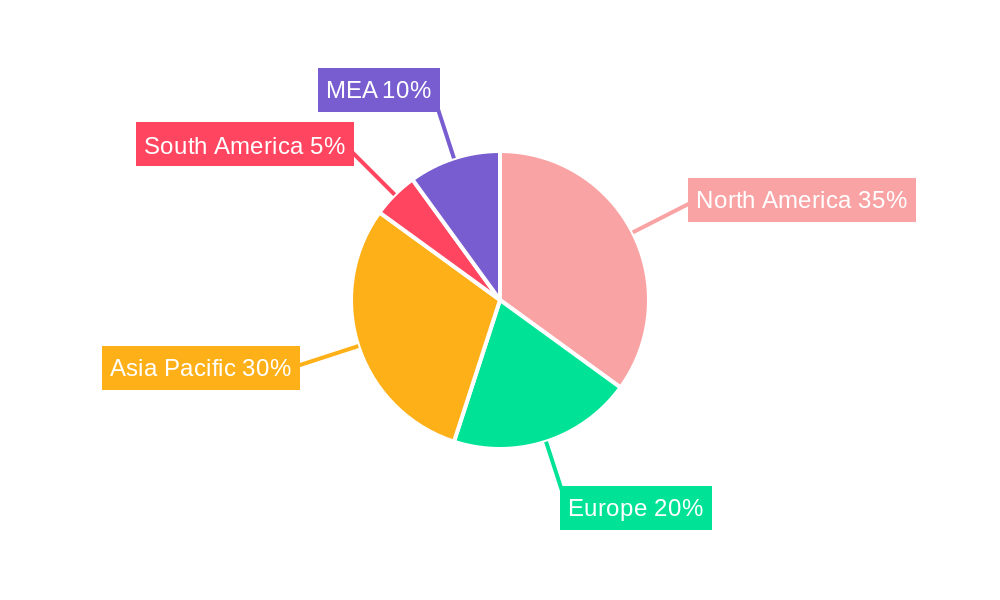
Top Drive Drilling Industry Regional Market Share
Geographic Coverage of Top Drive Drilling Industry
Top Drive Drilling Industry REPORT HIGHLIGHTS
| Aspects | Details |
|---|---|
| Study Period | 2020-2034 |
| Base Year | 2025 |
| Estimated Year | 2026 |
| Forecast Period | 2026-2034 |
| Historical Period | 2020-2025 |
| Growth Rate | CAGR of > 4.50% from 2020-2034 |
| Segmentation |
|
Table of Contents
- 1. Introduction
- 1.1. Research Scope
- 1.2. Market Segmentation
- 1.3. Research Methodology
- 1.4. Definitions and Assumptions
- 2. Executive Summary
- 2.1. Introduction
- 3. Market Dynamics
- 3.1. Introduction
- 3.2. Market Drivers
- 3.2.1. 4.; Improved Viability Of Offshore Oil And Gas Projects
- 3.3. Market Restrains
- 3.3.1. 4.; Ban On Offshore Exploration And Production Activities In Multiple Regions
- 3.4. Market Trends
- 3.4.1. Onshore Sector to Dominate the Market
- 4. Market Factor Analysis
- 4.1. Porters Five Forces
- 4.2. Supply/Value Chain
- 4.3. PESTEL analysis
- 4.4. Market Entropy
- 4.5. Patent/Trademark Analysis
- 5. Global Top Drive Drilling Industry Analysis, Insights and Forecast, 2020-2032
- 5.1. Market Analysis, Insights and Forecast - by Type
- 5.1.1. Electric Top Drive
- 5.1.2. Hydraulic Top Drive
- 5.2. Market Analysis, Insights and Forecast - by Location of Deployment
- 5.2.1. Onshore
- 5.2.2. Offshore
- 5.3. Market Analysis, Insights and Forecast - by Region
- 5.3.1. North America
- 5.3.2. Europe
- 5.3.3. Asia Pacific
- 5.3.4. South America
- 5.3.5. Middle East and Africa
- 5.1. Market Analysis, Insights and Forecast - by Type
- 6. North America Top Drive Drilling Industry Analysis, Insights and Forecast, 2020-2032
- 6.1. Market Analysis, Insights and Forecast - by Type
- 6.1.1. Electric Top Drive
- 6.1.2. Hydraulic Top Drive
- 6.2. Market Analysis, Insights and Forecast - by Location of Deployment
- 6.2.1. Onshore
- 6.2.2. Offshore
- 6.1. Market Analysis, Insights and Forecast - by Type
- 7. Europe Top Drive Drilling Industry Analysis, Insights and Forecast, 2020-2032
- 7.1. Market Analysis, Insights and Forecast - by Type
- 7.1.1. Electric Top Drive
- 7.1.2. Hydraulic Top Drive
- 7.2. Market Analysis, Insights and Forecast - by Location of Deployment
- 7.2.1. Onshore
- 7.2.2. Offshore
- 7.1. Market Analysis, Insights and Forecast - by Type
- 8. Asia Pacific Top Drive Drilling Industry Analysis, Insights and Forecast, 2020-2032
- 8.1. Market Analysis, Insights and Forecast - by Type
- 8.1.1. Electric Top Drive
- 8.1.2. Hydraulic Top Drive
- 8.2. Market Analysis, Insights and Forecast - by Location of Deployment
- 8.2.1. Onshore
- 8.2.2. Offshore
- 8.1. Market Analysis, Insights and Forecast - by Type
- 9. South America Top Drive Drilling Industry Analysis, Insights and Forecast, 2020-2032
- 9.1. Market Analysis, Insights and Forecast - by Type
- 9.1.1. Electric Top Drive
- 9.1.2. Hydraulic Top Drive
- 9.2. Market Analysis, Insights and Forecast - by Location of Deployment
- 9.2.1. Onshore
- 9.2.2. Offshore
- 9.1. Market Analysis, Insights and Forecast - by Type
- 10. Middle East and Africa Top Drive Drilling Industry Analysis, Insights and Forecast, 2020-2032
- 10.1. Market Analysis, Insights and Forecast - by Type
- 10.1.1. Electric Top Drive
- 10.1.2. Hydraulic Top Drive
- 10.2. Market Analysis, Insights and Forecast - by Location of Deployment
- 10.2.1. Onshore
- 10.2.2. Offshore
- 10.1. Market Analysis, Insights and Forecast - by Type
- 11. Competitive Analysis
- 11.1. Global Market Share Analysis 2025
- 11.2. Company Profiles
- 11.2.1 Aker Solutions ASA
- 11.2.1.1. Overview
- 11.2.1.2. Products
- 11.2.1.3. SWOT Analysis
- 11.2.1.4. Recent Developments
- 11.2.1.5. Financials (Based on Availability)
- 11.2.2 China National Petroleum Corporation (CNPC)
- 11.2.2.1. Overview
- 11.2.2.2. Products
- 11.2.2.3. SWOT Analysis
- 11.2.2.4. Recent Developments
- 11.2.2.5. Financials (Based on Availability)
- 11.2.3 Warrior Rig Technologies Limited
- 11.2.3.1. Overview
- 11.2.3.2. Products
- 11.2.3.3. SWOT Analysis
- 11.2.3.4. Recent Developments
- 11.2.3.5. Financials (Based on Availability)
- 11.2.4 Bentec Gmbh Drilling & Oilfield Systems
- 11.2.4.1. Overview
- 11.2.4.2. Products
- 11.2.4.3. SWOT Analysis
- 11.2.4.4. Recent Developments
- 11.2.4.5. Financials (Based on Availability)
- 11.2.5 AXON EP Inc
- 11.2.5.1. Overview
- 11.2.5.2. Products
- 11.2.5.3. SWOT Analysis
- 11.2.5.4. Recent Developments
- 11.2.5.5. Financials (Based on Availability)
- 11.2.6 Herrenknecht Vertical Gmbh
- 11.2.6.1. Overview
- 11.2.6.2. Products
- 11.2.6.3. SWOT Analysis
- 11.2.6.4. Recent Developments
- 11.2.6.5. Financials (Based on Availability)
- 11.2.7 Nabors Industries Ltd*List Not Exhaustive
- 11.2.7.1. Overview
- 11.2.7.2. Products
- 11.2.7.3. SWOT Analysis
- 11.2.7.4. Recent Developments
- 11.2.7.5. Financials (Based on Availability)
- 11.2.8 Drillmec Inc
- 11.2.8.1. Overview
- 11.2.8.2. Products
- 11.2.8.3. SWOT Analysis
- 11.2.8.4. Recent Developments
- 11.2.8.5. Financials (Based on Availability)
- 11.2.9 National-Oilwell Varco Inc
- 11.2.9.1. Overview
- 11.2.9.2. Products
- 11.2.9.3. SWOT Analysis
- 11.2.9.4. Recent Developments
- 11.2.9.5. Financials (Based on Availability)
- 11.2.10 Schlumberger Limited
- 11.2.10.1. Overview
- 11.2.10.2. Products
- 11.2.10.3. SWOT Analysis
- 11.2.10.4. Recent Developments
- 11.2.10.5. Financials (Based on Availability)
- 11.2.11 Atlas Copco Ltd
- 11.2.11.1. Overview
- 11.2.11.2. Products
- 11.2.11.3. SWOT Analysis
- 11.2.11.4. Recent Developments
- 11.2.11.5. Financials (Based on Availability)
- 11.2.1 Aker Solutions ASA
List of Figures
- Figure 1: Global Top Drive Drilling Industry Revenue Breakdown (Million, %) by Region 2025 & 2033
- Figure 2: North America Top Drive Drilling Industry Revenue (Million), by Type 2025 & 2033
- Figure 3: North America Top Drive Drilling Industry Revenue Share (%), by Type 2025 & 2033
- Figure 4: North America Top Drive Drilling Industry Revenue (Million), by Location of Deployment 2025 & 2033
- Figure 5: North America Top Drive Drilling Industry Revenue Share (%), by Location of Deployment 2025 & 2033
- Figure 6: North America Top Drive Drilling Industry Revenue (Million), by Country 2025 & 2033
- Figure 7: North America Top Drive Drilling Industry Revenue Share (%), by Country 2025 & 2033
- Figure 8: Europe Top Drive Drilling Industry Revenue (Million), by Type 2025 & 2033
- Figure 9: Europe Top Drive Drilling Industry Revenue Share (%), by Type 2025 & 2033
- Figure 10: Europe Top Drive Drilling Industry Revenue (Million), by Location of Deployment 2025 & 2033
- Figure 11: Europe Top Drive Drilling Industry Revenue Share (%), by Location of Deployment 2025 & 2033
- Figure 12: Europe Top Drive Drilling Industry Revenue (Million), by Country 2025 & 2033
- Figure 13: Europe Top Drive Drilling Industry Revenue Share (%), by Country 2025 & 2033
- Figure 14: Asia Pacific Top Drive Drilling Industry Revenue (Million), by Type 2025 & 2033
- Figure 15: Asia Pacific Top Drive Drilling Industry Revenue Share (%), by Type 2025 & 2033
- Figure 16: Asia Pacific Top Drive Drilling Industry Revenue (Million), by Location of Deployment 2025 & 2033
- Figure 17: Asia Pacific Top Drive Drilling Industry Revenue Share (%), by Location of Deployment 2025 & 2033
- Figure 18: Asia Pacific Top Drive Drilling Industry Revenue (Million), by Country 2025 & 2033
- Figure 19: Asia Pacific Top Drive Drilling Industry Revenue Share (%), by Country 2025 & 2033
- Figure 20: South America Top Drive Drilling Industry Revenue (Million), by Type 2025 & 2033
- Figure 21: South America Top Drive Drilling Industry Revenue Share (%), by Type 2025 & 2033
- Figure 22: South America Top Drive Drilling Industry Revenue (Million), by Location of Deployment 2025 & 2033
- Figure 23: South America Top Drive Drilling Industry Revenue Share (%), by Location of Deployment 2025 & 2033
- Figure 24: South America Top Drive Drilling Industry Revenue (Million), by Country 2025 & 2033
- Figure 25: South America Top Drive Drilling Industry Revenue Share (%), by Country 2025 & 2033
- Figure 26: Middle East and Africa Top Drive Drilling Industry Revenue (Million), by Type 2025 & 2033
- Figure 27: Middle East and Africa Top Drive Drilling Industry Revenue Share (%), by Type 2025 & 2033
- Figure 28: Middle East and Africa Top Drive Drilling Industry Revenue (Million), by Location of Deployment 2025 & 2033
- Figure 29: Middle East and Africa Top Drive Drilling Industry Revenue Share (%), by Location of Deployment 2025 & 2033
- Figure 30: Middle East and Africa Top Drive Drilling Industry Revenue (Million), by Country 2025 & 2033
- Figure 31: Middle East and Africa Top Drive Drilling Industry Revenue Share (%), by Country 2025 & 2033
List of Tables
- Table 1: Global Top Drive Drilling Industry Revenue Million Forecast, by Type 2020 & 2033
- Table 2: Global Top Drive Drilling Industry Revenue Million Forecast, by Location of Deployment 2020 & 2033
- Table 3: Global Top Drive Drilling Industry Revenue Million Forecast, by Region 2020 & 2033
- Table 4: Global Top Drive Drilling Industry Revenue Million Forecast, by Type 2020 & 2033
- Table 5: Global Top Drive Drilling Industry Revenue Million Forecast, by Location of Deployment 2020 & 2033
- Table 6: Global Top Drive Drilling Industry Revenue Million Forecast, by Country 2020 & 2033
- Table 7: Global Top Drive Drilling Industry Revenue Million Forecast, by Type 2020 & 2033
- Table 8: Global Top Drive Drilling Industry Revenue Million Forecast, by Location of Deployment 2020 & 2033
- Table 9: Global Top Drive Drilling Industry Revenue Million Forecast, by Country 2020 & 2033
- Table 10: Global Top Drive Drilling Industry Revenue Million Forecast, by Type 2020 & 2033
- Table 11: Global Top Drive Drilling Industry Revenue Million Forecast, by Location of Deployment 2020 & 2033
- Table 12: Global Top Drive Drilling Industry Revenue Million Forecast, by Country 2020 & 2033
- Table 13: Global Top Drive Drilling Industry Revenue Million Forecast, by Type 2020 & 2033
- Table 14: Global Top Drive Drilling Industry Revenue Million Forecast, by Location of Deployment 2020 & 2033
- Table 15: Global Top Drive Drilling Industry Revenue Million Forecast, by Country 2020 & 2033
- Table 16: Global Top Drive Drilling Industry Revenue Million Forecast, by Type 2020 & 2033
- Table 17: Global Top Drive Drilling Industry Revenue Million Forecast, by Location of Deployment 2020 & 2033
- Table 18: Global Top Drive Drilling Industry Revenue Million Forecast, by Country 2020 & 2033
Frequently Asked Questions
1. What is the projected Compound Annual Growth Rate (CAGR) of the Top Drive Drilling Industry?
The projected CAGR is approximately > 4.50%.
2. Which companies are prominent players in the Top Drive Drilling Industry?
Key companies in the market include Aker Solutions ASA, China National Petroleum Corporation (CNPC), Warrior Rig Technologies Limited, Bentec Gmbh Drilling & Oilfield Systems, AXON EP Inc, Herrenknecht Vertical Gmbh, Nabors Industries Ltd*List Not Exhaustive, Drillmec Inc, National-Oilwell Varco Inc, Schlumberger Limited, Atlas Copco Ltd.
3. What are the main segments of the Top Drive Drilling Industry?
The market segments include Type, Location of Deployment.
4. Can you provide details about the market size?
The market size is estimated to be USD XX Million as of 2022.
5. What are some drivers contributing to market growth?
4.; Improved Viability Of Offshore Oil And Gas Projects.
6. What are the notable trends driving market growth?
Onshore Sector to Dominate the Market.
7. Are there any restraints impacting market growth?
4.; Ban On Offshore Exploration And Production Activities In Multiple Regions.
8. Can you provide examples of recent developments in the market?
In January 2022, Abu Dhabi National Oil Company (ADNOC) awarded framework agreements worth USD 1.94 billion to four top-tier companies aiming to boost drilling activities. The contracts were awarded to Adnoc Drilling (a subsidiary of ADNOC), Schlumberger, Haliburton, and Weatherford. The framework agreement awards are likely to cover ADNOC's onshore and offshore fields and run for five years, with an option for a further two years. The deal builds on ADNOC's recent record investments in drilling-related equipment and services. It is also expected to support its strategy to boost crude oil production capacity to 5 mmbpd by 2030 and, thus, help the growth of the top drive systems market.
9. What pricing options are available for accessing the report?
Pricing options include single-user, multi-user, and enterprise licenses priced at USD 4750, USD 5250, and USD 8750 respectively.
10. Is the market size provided in terms of value or volume?
The market size is provided in terms of value, measured in Million.
11. Are there any specific market keywords associated with the report?
Yes, the market keyword associated with the report is "Top Drive Drilling Industry," which aids in identifying and referencing the specific market segment covered.
12. How do I determine which pricing option suits my needs best?
The pricing options vary based on user requirements and access needs. Individual users may opt for single-user licenses, while businesses requiring broader access may choose multi-user or enterprise licenses for cost-effective access to the report.
13. Are there any additional resources or data provided in the Top Drive Drilling Industry report?
While the report offers comprehensive insights, it's advisable to review the specific contents or supplementary materials provided to ascertain if additional resources or data are available.
14. How can I stay updated on further developments or reports in the Top Drive Drilling Industry?
To stay informed about further developments, trends, and reports in the Top Drive Drilling Industry, consider subscribing to industry newsletters, following relevant companies and organizations, or regularly checking reputable industry news sources and publications.
Methodology
Step 1 - Identification of Relevant Samples Size from Population Database


Step 2 - Approaches for Defining Global Market Size (Value, Volume* & Price*)

Note*: In applicable scenarios
Step 3 - Data Sources
Primary Research
- Web Analytics
- Survey Reports
- Research Institute
- Latest Research Reports
- Opinion Leaders
Secondary Research
- Annual Reports
- White Paper
- Latest Press Release
- Industry Association
- Paid Database
- Investor Presentations

Step 4 - Data Triangulation
Involves using different sources of information in order to increase the validity of a study
These sources are likely to be stakeholders in a program - participants, other researchers, program staff, other community members, and so on.
Then we put all data in single framework & apply various statistical tools to find out the dynamic on the market.
During the analysis stage, feedback from the stakeholder groups would be compared to determine areas of agreement as well as areas of divergence