


Key Insights
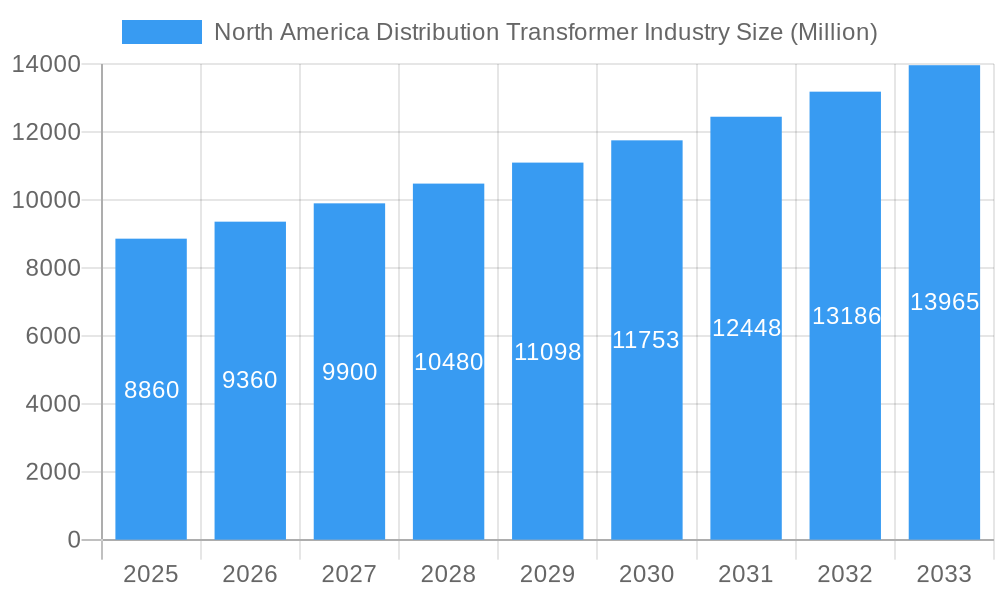
The North American distribution transformer market, valued at $8.86 billion in 2025, is projected to experience robust growth, driven by increasing electricity demand fueled by population growth and industrial expansion. The market's Compound Annual Growth Rate (CAGR) of 5.41% from 2025 to 2033 indicates a significant expansion over the forecast period. Key drivers include the modernization of aging grid infrastructure, the integration of renewable energy sources (requiring efficient distribution transformers), and the rising adoption of smart grid technologies. The market is segmented by cooling type (air-cooled and oil-cooled), transformer type (power and distribution), and power rating (small, medium, and large). Air-cooled transformers are expected to dominate due to their cost-effectiveness and ease of maintenance, while the distribution transformer segment will likely witness higher growth due to the widespread deployment of low-voltage distribution networks. Growth restraints may include material cost fluctuations (particularly for copper and steel) and supply chain disruptions. However, the continued investment in grid infrastructure upgrades and smart grid technologies, particularly in the United States, will likely outweigh these challenges. Major players like Eaton, Siemens, and ABB are strategically positioning themselves to capitalize on these opportunities, driving innovation in transformer design and efficiency.
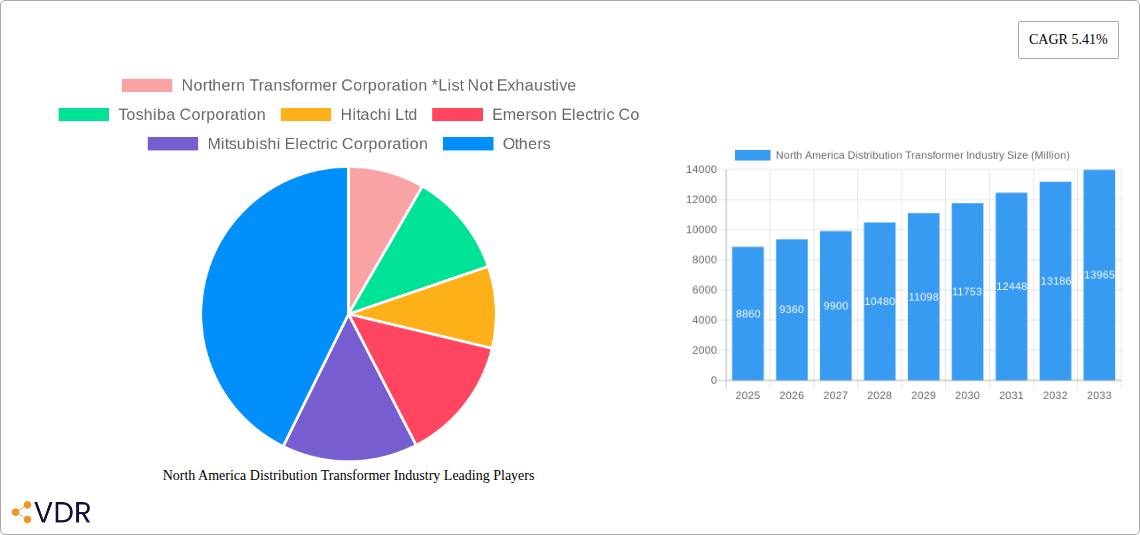
North America Distribution Transformer Industry Market Size (In Billion)

The largest share of the market is likely held by the United States, followed by Canada and Mexico. This regional dominance stems from factors including significant investment in grid infrastructure projects, a robust industrial base requiring substantial power distribution, and governmental support for renewable energy integration. Within the power rating segment, the medium-sized transformer segment (751 KVA - 100 MVA) is expected to show strong growth, driven by demand from industrial and commercial sectors. Furthermore, technological advancements, such as the development of more efficient and environmentally friendly transformer designs (e.g., those employing sustainable materials and advanced cooling systems), are expected to further shape the market landscape. This growth will be further propelled by increased government regulations aimed at reducing carbon emissions and improving grid reliability. The competitive landscape is characterized by both established international players and regional manufacturers, resulting in a dynamic market with ongoing product innovation and strategic partnerships.
North America Distribution Transformer Industry Company Market Share
North America Distribution Transformer Industry Market Report: 2019-2033
This comprehensive report provides an in-depth analysis of the North America distribution transformer industry, encompassing market dynamics, growth trends, key players, and future outlook. With a focus on the parent market (power transformers) and child market (distribution transformers), this report is essential for industry professionals, investors, and strategic planners seeking a clear understanding of this crucial sector. The report covers the period 2019-2033, with 2025 as the base year and forecasts extending to 2033. Market values are presented in million units.
North America Distribution Transformer Industry Market Dynamics & Structure
This section analyzes the competitive landscape of the North American distribution transformer market, considering market concentration, technological advancements, regulatory influences, and market trends. We examine the impact of competitive substitutes and end-user demographics, alongside mergers and acquisitions (M&A) activities. The analysis integrates quantitative data on market share and M&A deal volumes with qualitative insights into innovation barriers.
Market Concentration: The North American distribution transformer market exhibits a moderately consolidated structure, with a few large players holding significant market share. xx% of the market is controlled by the top 5 players, indicating some level of oligopoly. Smaller, regional players also contribute significantly to the overall market volume.
Technological Innovation: Ongoing innovations in cooling technologies (air-cooled and oil-cooled), materials science, and smart grid integration are key drivers of market growth. However, high R&D investment and stringent regulatory approvals pose significant innovation barriers.
Regulatory Framework: Stringent safety and environmental regulations, including those related to energy efficiency and waste management, influence product design and manufacturing processes.
Competitive Substitutes: The industry faces competition from alternative technologies such as solid-state transformers, though their market penetration remains limited as of 2025.
End-User Demographics: The primary end-users are utilities, industrial facilities, and commercial establishments, with the utility sector accounting for the largest share (xx%).
M&A Trends: The period 2019-2024 witnessed xx M&A deals in the North American distribution transformer market, primarily driven by strategies for expansion and consolidation.
North America Distribution Transformer Industry Growth Trends & Insights
This section provides a detailed analysis of the North American distribution transformer market's growth trajectory, utilizing historical data (2019-2024), current estimates (2025), and future projections (2025-2033). The analysis incorporates key metrics such as Compound Annual Growth Rate (CAGR) and market penetration to provide deep insight into market evolution, technological disruptions, and evolving consumer behaviors. The market is expected to experience a CAGR of xx% during the forecast period. Factors influencing this growth include rising electricity demand, infrastructure development, and increasing adoption of renewable energy sources. Specific factors affecting adoption rates are explored, showing the shifting consumer behaviors driving demand. The impact of technological advancements such as smart grid technologies and improved cooling mechanisms on the market's evolution is assessed.
Dominant Regions, Countries, or Segments in North America Distribution Transformer Industry
This section identifies the leading regions, countries, and segments within the North American distribution transformer market, based on analysis of market size, growth rate, and key influencing factors. The segments are analyzed based on Cooling Type (Air-Cooled, Oil-Cooled), Transformer Type (Power Transformer, Distribution Transformer), and Power Rating (Small (10 KVA - 750 KVA), Medium (751 KVA - 100 MVA), Large (above 101 MVA)).
Dominant Segment: The Distribution Transformer segment dominates the market, driven by the extensive demand for electricity distribution infrastructure upgrades. The Oil-Cooled segment holds a larger market share than the Air-Cooled segment due to its higher efficiency. The Medium Power Rating segment shows the highest growth, driven by growing demand for medium-sized commercial and industrial establishments.
Leading Regions: The US holds the largest market share, followed by Canada and Mexico. The robust infrastructure development and increasing electricity demand in the US contributes significantly to the market dominance. Government initiatives promoting renewable energy integration in Canada are also boosting growth.
Key Drivers:
- Robust infrastructure development: Investment in new power grids and upgrades to existing infrastructure is a primary driver.
- Rising electricity demand: Population growth and industrialization are fueling increased electricity consumption.
- Renewable energy integration: Growing adoption of renewable energy sources requires advanced distribution infrastructure.
- Government support and initiatives: Policies promoting energy efficiency and grid modernization contribute to market growth.
North America Distribution Transformer Industry Product Landscape
The North American distribution transformer market features a diverse range of products, incorporating technological advancements such as improved cooling systems (e.g., advanced oil-cooling techniques and air-cooling designs), advanced materials for enhanced durability and efficiency, and smart grid integration capabilities. These features enhance efficiency, reliability, and longevity, offering unique selling propositions. Key innovations include the implementation of advanced sensors for real-time monitoring and predictive maintenance.
Key Drivers, Barriers & Challenges in North America Distribution Transformer Industry
Key Drivers:
- Increased demand for electricity.
- Expansion of renewable energy sources.
- Modernization of the power grid infrastructure.
- Government regulations and incentives promoting energy efficiency.
Challenges & Restraints:
- Fluctuations in raw material prices (e.g., steel and copper).
- Supply chain disruptions impacting production and delivery timelines.
- Stringent environmental regulations impacting manufacturing processes.
- Intense competition from established and emerging players.
Emerging Opportunities in North America Distribution Transformer Industry
Emerging opportunities include:
- Growth in the microgrid and smart grid segments.
- Increasing demand for transformers with higher efficiency ratings.
- Adoption of advanced materials and technologies to improve transformer performance.
- Expansion into underserved markets, particularly in rural areas.
Growth Accelerators in the North America Distribution Transformer Industry
Long-term growth will be fueled by continued investment in grid modernization, the adoption of smart grid technologies, and the rising demand for renewable energy integration. Strategic partnerships between transformer manufacturers and utility companies will also play a significant role in market expansion. Technological breakthroughs such as the development of more efficient and sustainable transformer designs will drive further market growth.
Key Players Shaping the North America Distribution Transformer Industry Market
- Northern Transformer Corporation
- Toshiba Corporation
- Hitachi Ltd
- Emerson Electric Co
- Mitsubishi Electric Corporation
- Schneider Electric SE
- Eaton Corporation PLC
- Siemens Energy AG
- General Electric Company
- WEG SA
Notable Milestones in North America Distribution Transformer Industry Sector
- February 2023: Virginia Transformer inaugurates its fifth transformer manufacturing facility in Mexico, boosting production capacity and potentially reducing lead times.
- October 2022: Hitachi Energy invests USD 37 million in its South Boston factory, expanding capacity to meet growing demand from utility and renewable energy sectors.
In-Depth North America Distribution Transformer Industry Market Outlook
The North American distribution transformer market is poised for significant growth over the next decade. Continued investments in grid modernization, the expanding renewable energy sector, and technological advancements will drive demand. Strategic partnerships, focused on innovation and efficient supply chains, will be crucial for success in this competitive landscape. The market's future trajectory will be significantly impacted by the evolving energy mix and the ongoing push for grid modernization initiatives across the region.
North America Distribution Transformer Industry Segmentation
-
1. Power Rating
- 1.1. Small (10 KVA - 750 KVA)
- 1.2. Medium (751 KVA - 100 MVA)
- 1.3. Large (above 101 MVA)
-
2. Cooling Type
- 2.1. Air-Cooled
- 2.2. Oil-Cooled
-
3. Transformer Type
- 3.1. Power Transformer
- 3.2. Distribution Transformer
-
4. Geography
- 4.1. United States
- 4.2. Canada
- 4.3. Rest Of North America
North America Distribution Transformer Industry Segmentation By Geography
- 1. United States
- 2. Canada
- 3. Rest Of North America
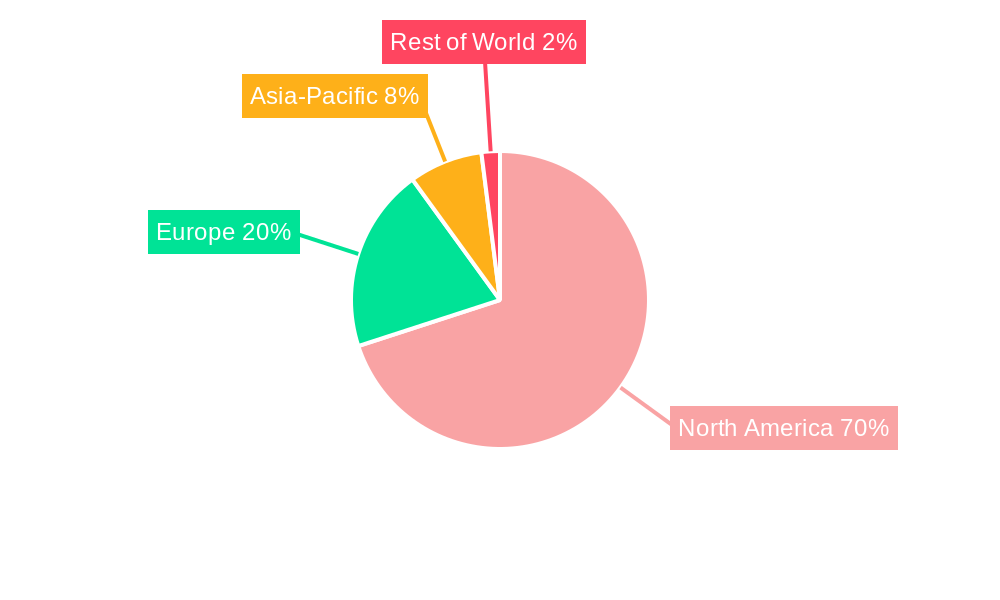
North America Distribution Transformer Industry Regional Market Share
Geographic Coverage of North America Distribution Transformer Industry
North America Distribution Transformer Industry REPORT HIGHLIGHTS
| Aspects | Details |
|---|---|
| Study Period | 2020-2034 |
| Base Year | 2025 |
| Estimated Year | 2026 |
| Forecast Period | 2026-2034 |
| Historical Period | 2020-2025 |
| Growth Rate | CAGR of 5.41% from 2020-2034 |
| Segmentation |
|
Table of Contents
- 1. Introduction
- 1.1. Research Scope
- 1.2. Market Segmentation
- 1.3. Research Methodology
- 1.4. Definitions and Assumptions
- 2. Executive Summary
- 2.1. Introduction
- 3. Market Dynamics
- 3.1. Introduction
- 3.2. Market Drivers
- 3.2.1. 4.; Substantial Investments and Efforts to Modernize the T&D Grid
- 3.3. Market Restrains
- 3.3.1. 4.; Rising Distributed Energy Generation
- 3.4. Market Trends
- 3.4.1. Power Transformer Expected to Dominate the Market
- 4. Market Factor Analysis
- 4.1. Porters Five Forces
- 4.2. Supply/Value Chain
- 4.3. PESTEL analysis
- 4.4. Market Entropy
- 4.5. Patent/Trademark Analysis
- 5. North America Distribution Transformer Industry Analysis, Insights and Forecast, 2020-2032
- 5.1. Market Analysis, Insights and Forecast - by Power Rating
- 5.1.1. Small (10 KVA - 750 KVA)
- 5.1.2. Medium (751 KVA - 100 MVA)
- 5.1.3. Large (above 101 MVA)
- 5.2. Market Analysis, Insights and Forecast - by Cooling Type
- 5.2.1. Air-Cooled
- 5.2.2. Oil-Cooled
- 5.3. Market Analysis, Insights and Forecast - by Transformer Type
- 5.3.1. Power Transformer
- 5.3.2. Distribution Transformer
- 5.4. Market Analysis, Insights and Forecast - by Geography
- 5.4.1. United States
- 5.4.2. Canada
- 5.4.3. Rest Of North America
- 5.5. Market Analysis, Insights and Forecast - by Region
- 5.5.1. United States
- 5.5.2. Canada
- 5.5.3. Rest Of North America
- 5.1. Market Analysis, Insights and Forecast - by Power Rating
- 6. United States North America Distribution Transformer Industry Analysis, Insights and Forecast, 2020-2032
- 6.1. Market Analysis, Insights and Forecast - by Power Rating
- 6.1.1. Small (10 KVA - 750 KVA)
- 6.1.2. Medium (751 KVA - 100 MVA)
- 6.1.3. Large (above 101 MVA)
- 6.2. Market Analysis, Insights and Forecast - by Cooling Type
- 6.2.1. Air-Cooled
- 6.2.2. Oil-Cooled
- 6.3. Market Analysis, Insights and Forecast - by Transformer Type
- 6.3.1. Power Transformer
- 6.3.2. Distribution Transformer
- 6.4. Market Analysis, Insights and Forecast - by Geography
- 6.4.1. United States
- 6.4.2. Canada
- 6.4.3. Rest Of North America
- 6.1. Market Analysis, Insights and Forecast - by Power Rating
- 7. Canada North America Distribution Transformer Industry Analysis, Insights and Forecast, 2020-2032
- 7.1. Market Analysis, Insights and Forecast - by Power Rating
- 7.1.1. Small (10 KVA - 750 KVA)
- 7.1.2. Medium (751 KVA - 100 MVA)
- 7.1.3. Large (above 101 MVA)
- 7.2. Market Analysis, Insights and Forecast - by Cooling Type
- 7.2.1. Air-Cooled
- 7.2.2. Oil-Cooled
- 7.3. Market Analysis, Insights and Forecast - by Transformer Type
- 7.3.1. Power Transformer
- 7.3.2. Distribution Transformer
- 7.4. Market Analysis, Insights and Forecast - by Geography
- 7.4.1. United States
- 7.4.2. Canada
- 7.4.3. Rest Of North America
- 7.1. Market Analysis, Insights and Forecast - by Power Rating
- 8. Rest Of North America North America Distribution Transformer Industry Analysis, Insights and Forecast, 2020-2032
- 8.1. Market Analysis, Insights and Forecast - by Power Rating
- 8.1.1. Small (10 KVA - 750 KVA)
- 8.1.2. Medium (751 KVA - 100 MVA)
- 8.1.3. Large (above 101 MVA)
- 8.2. Market Analysis, Insights and Forecast - by Cooling Type
- 8.2.1. Air-Cooled
- 8.2.2. Oil-Cooled
- 8.3. Market Analysis, Insights and Forecast - by Transformer Type
- 8.3.1. Power Transformer
- 8.3.2. Distribution Transformer
- 8.4. Market Analysis, Insights and Forecast - by Geography
- 8.4.1. United States
- 8.4.2. Canada
- 8.4.3. Rest Of North America
- 8.1. Market Analysis, Insights and Forecast - by Power Rating
- 9. Competitive Analysis
- 9.1. Market Share Analysis 2025
- 9.2. Company Profiles
- 9.2.1 Northern Transformer Corporation *List Not Exhaustive
- 9.2.1.1. Overview
- 9.2.1.2. Products
- 9.2.1.3. SWOT Analysis
- 9.2.1.4. Recent Developments
- 9.2.1.5. Financials (Based on Availability)
- 9.2.2 Toshiba Corporation
- 9.2.2.1. Overview
- 9.2.2.2. Products
- 9.2.2.3. SWOT Analysis
- 9.2.2.4. Recent Developments
- 9.2.2.5. Financials (Based on Availability)
- 9.2.3 Hitachi Ltd
- 9.2.3.1. Overview
- 9.2.3.2. Products
- 9.2.3.3. SWOT Analysis
- 9.2.3.4. Recent Developments
- 9.2.3.5. Financials (Based on Availability)
- 9.2.4 Emerson Electric Co
- 9.2.4.1. Overview
- 9.2.4.2. Products
- 9.2.4.3. SWOT Analysis
- 9.2.4.4. Recent Developments
- 9.2.4.5. Financials (Based on Availability)
- 9.2.5 Mitsubishi Electric Corporation
- 9.2.5.1. Overview
- 9.2.5.2. Products
- 9.2.5.3. SWOT Analysis
- 9.2.5.4. Recent Developments
- 9.2.5.5. Financials (Based on Availability)
- 9.2.6 Schneider Electric SE
- 9.2.6.1. Overview
- 9.2.6.2. Products
- 9.2.6.3. SWOT Analysis
- 9.2.6.4. Recent Developments
- 9.2.6.5. Financials (Based on Availability)
- 9.2.7 Eaton Corporation PLC
- 9.2.7.1. Overview
- 9.2.7.2. Products
- 9.2.7.3. SWOT Analysis
- 9.2.7.4. Recent Developments
- 9.2.7.5. Financials (Based on Availability)
- 9.2.8 Siemens Energy AG
- 9.2.8.1. Overview
- 9.2.8.2. Products
- 9.2.8.3. SWOT Analysis
- 9.2.8.4. Recent Developments
- 9.2.8.5. Financials (Based on Availability)
- 9.2.9 General Electric Company
- 9.2.9.1. Overview
- 9.2.9.2. Products
- 9.2.9.3. SWOT Analysis
- 9.2.9.4. Recent Developments
- 9.2.9.5. Financials (Based on Availability)
- 9.2.10 WEG SA
- 9.2.10.1. Overview
- 9.2.10.2. Products
- 9.2.10.3. SWOT Analysis
- 9.2.10.4. Recent Developments
- 9.2.10.5. Financials (Based on Availability)
- 9.2.1 Northern Transformer Corporation *List Not Exhaustive
List of Figures
- Figure 1: North America Distribution Transformer Industry Revenue Breakdown (Million, %) by Product 2025 & 2033
- Figure 2: North America Distribution Transformer Industry Share (%) by Company 2025
List of Tables
- Table 1: North America Distribution Transformer Industry Revenue Million Forecast, by Power Rating 2020 & 2033
- Table 2: North America Distribution Transformer Industry Volume K Units Forecast, by Power Rating 2020 & 2033
- Table 3: North America Distribution Transformer Industry Revenue Million Forecast, by Cooling Type 2020 & 2033
- Table 4: North America Distribution Transformer Industry Volume K Units Forecast, by Cooling Type 2020 & 2033
- Table 5: North America Distribution Transformer Industry Revenue Million Forecast, by Transformer Type 2020 & 2033
- Table 6: North America Distribution Transformer Industry Volume K Units Forecast, by Transformer Type 2020 & 2033
- Table 7: North America Distribution Transformer Industry Revenue Million Forecast, by Geography 2020 & 2033
- Table 8: North America Distribution Transformer Industry Volume K Units Forecast, by Geography 2020 & 2033
- Table 9: North America Distribution Transformer Industry Revenue Million Forecast, by Region 2020 & 2033
- Table 10: North America Distribution Transformer Industry Volume K Units Forecast, by Region 2020 & 2033
- Table 11: North America Distribution Transformer Industry Revenue Million Forecast, by Power Rating 2020 & 2033
- Table 12: North America Distribution Transformer Industry Volume K Units Forecast, by Power Rating 2020 & 2033
- Table 13: North America Distribution Transformer Industry Revenue Million Forecast, by Cooling Type 2020 & 2033
- Table 14: North America Distribution Transformer Industry Volume K Units Forecast, by Cooling Type 2020 & 2033
- Table 15: North America Distribution Transformer Industry Revenue Million Forecast, by Transformer Type 2020 & 2033
- Table 16: North America Distribution Transformer Industry Volume K Units Forecast, by Transformer Type 2020 & 2033
- Table 17: North America Distribution Transformer Industry Revenue Million Forecast, by Geography 2020 & 2033
- Table 18: North America Distribution Transformer Industry Volume K Units Forecast, by Geography 2020 & 2033
- Table 19: North America Distribution Transformer Industry Revenue Million Forecast, by Country 2020 & 2033
- Table 20: North America Distribution Transformer Industry Volume K Units Forecast, by Country 2020 & 2033
- Table 21: North America Distribution Transformer Industry Revenue Million Forecast, by Power Rating 2020 & 2033
- Table 22: North America Distribution Transformer Industry Volume K Units Forecast, by Power Rating 2020 & 2033
- Table 23: North America Distribution Transformer Industry Revenue Million Forecast, by Cooling Type 2020 & 2033
- Table 24: North America Distribution Transformer Industry Volume K Units Forecast, by Cooling Type 2020 & 2033
- Table 25: North America Distribution Transformer Industry Revenue Million Forecast, by Transformer Type 2020 & 2033
- Table 26: North America Distribution Transformer Industry Volume K Units Forecast, by Transformer Type 2020 & 2033
- Table 27: North America Distribution Transformer Industry Revenue Million Forecast, by Geography 2020 & 2033
- Table 28: North America Distribution Transformer Industry Volume K Units Forecast, by Geography 2020 & 2033
- Table 29: North America Distribution Transformer Industry Revenue Million Forecast, by Country 2020 & 2033
- Table 30: North America Distribution Transformer Industry Volume K Units Forecast, by Country 2020 & 2033
- Table 31: North America Distribution Transformer Industry Revenue Million Forecast, by Power Rating 2020 & 2033
- Table 32: North America Distribution Transformer Industry Volume K Units Forecast, by Power Rating 2020 & 2033
- Table 33: North America Distribution Transformer Industry Revenue Million Forecast, by Cooling Type 2020 & 2033
- Table 34: North America Distribution Transformer Industry Volume K Units Forecast, by Cooling Type 2020 & 2033
- Table 35: North America Distribution Transformer Industry Revenue Million Forecast, by Transformer Type 2020 & 2033
- Table 36: North America Distribution Transformer Industry Volume K Units Forecast, by Transformer Type 2020 & 2033
- Table 37: North America Distribution Transformer Industry Revenue Million Forecast, by Geography 2020 & 2033
- Table 38: North America Distribution Transformer Industry Volume K Units Forecast, by Geography 2020 & 2033
- Table 39: North America Distribution Transformer Industry Revenue Million Forecast, by Country 2020 & 2033
- Table 40: North America Distribution Transformer Industry Volume K Units Forecast, by Country 2020 & 2033
Frequently Asked Questions
1. What is the projected Compound Annual Growth Rate (CAGR) of the North America Distribution Transformer Industry?
The projected CAGR is approximately 5.41%.
2. Which companies are prominent players in the North America Distribution Transformer Industry?
Key companies in the market include Northern Transformer Corporation *List Not Exhaustive, Toshiba Corporation, Hitachi Ltd, Emerson Electric Co, Mitsubishi Electric Corporation, Schneider Electric SE, Eaton Corporation PLC, Siemens Energy AG, General Electric Company, WEG SA.
3. What are the main segments of the North America Distribution Transformer Industry?
The market segments include Power Rating, Cooling Type, Transformer Type, Geography.
4. Can you provide details about the market size?
The market size is estimated to be USD 8.86 Million as of 2022.
5. What are some drivers contributing to market growth?
4.; Substantial Investments and Efforts to Modernize the T&D Grid.
6. What are the notable trends driving market growth?
Power Transformer Expected to Dominate the Market.
7. Are there any restraints impacting market growth?
4.; Rising Distributed Energy Generation.
8. Can you provide examples of recent developments in the market?
February 2023: Virginia Transformer completed the inauguration of its fifth transformer manufacturing facility in Mexico. The new facility was expected to reduce the time consumed in manufacturing transformers. The plant is located on an area of approximately 300,000 square feet and has a substantial area for further expansions in the future.
9. What pricing options are available for accessing the report?
Pricing options include single-user, multi-user, and enterprise licenses priced at USD 4750, USD 5250, and USD 8750 respectively.
10. Is the market size provided in terms of value or volume?
The market size is provided in terms of value, measured in Million and volume, measured in K Units.
11. Are there any specific market keywords associated with the report?
Yes, the market keyword associated with the report is "North America Distribution Transformer Industry," which aids in identifying and referencing the specific market segment covered.
12. How do I determine which pricing option suits my needs best?
The pricing options vary based on user requirements and access needs. Individual users may opt for single-user licenses, while businesses requiring broader access may choose multi-user or enterprise licenses for cost-effective access to the report.
13. Are there any additional resources or data provided in the North America Distribution Transformer Industry report?
While the report offers comprehensive insights, it's advisable to review the specific contents or supplementary materials provided to ascertain if additional resources or data are available.
14. How can I stay updated on further developments or reports in the North America Distribution Transformer Industry?
To stay informed about further developments, trends, and reports in the North America Distribution Transformer Industry, consider subscribing to industry newsletters, following relevant companies and organizations, or regularly checking reputable industry news sources and publications.
Methodology
Step 1 - Identification of Relevant Samples Size from Population Database


Step 2 - Approaches for Defining Global Market Size (Value, Volume* & Price*)

Note*: In applicable scenarios
Step 3 - Data Sources
Primary Research
- Web Analytics
- Survey Reports
- Research Institute
- Latest Research Reports
- Opinion Leaders
Secondary Research
- Annual Reports
- White Paper
- Latest Press Release
- Industry Association
- Paid Database
- Investor Presentations

Step 4 - Data Triangulation
Involves using different sources of information in order to increase the validity of a study
These sources are likely to be stakeholders in a program - participants, other researchers, program staff, other community members, and so on.
Then we put all data in single framework & apply various statistical tools to find out the dynamic on the market.
During the analysis stage, feedback from the stakeholder groups would be compared to determine areas of agreement as well as areas of divergence