

Key Insights
The Middle East and Africa (MEA) power rental market is poised for substantial expansion, driven by escalating infrastructure development, dynamic energy requirements, and a critical need for dependable backup power across numerous industries. The market is projected to achieve a Compound Annual Growth Rate (CAGR) of 5.4% from 2025 to 2033, indicating significant growth potential. Key growth catalysts include the booming construction sector in nations like the UAE and Saudi Arabia, alongside the energy industry's demand for adaptable power solutions during peak periods and emergencies. Advancements in fuel-efficient generators and smart monitoring systems further accelerate this upward trend. Despite challenges such as volatile fuel prices and environmental regulations, robust demand for prime, peak shaving, and emergency standby power solutions ensures sustained market momentum. Natural gas-powered generators dominate the segment landscape, leveraging the region's abundant resources. Leading market participants are strategically enhancing service offerings and investing in advanced equipment to meet evolving demands. A diverse end-user base, including utilities, oil and gas, and construction, underpins the market's resilience and growth trajectory. With favorable economic forecasts and projected CAGR, the MEA power rental sector offers considerable opportunities.
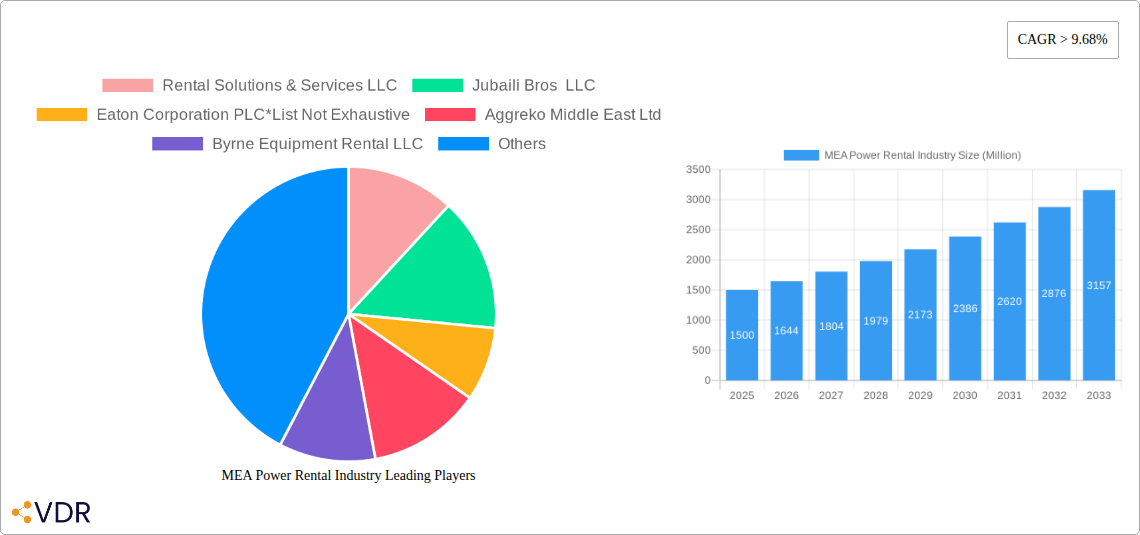
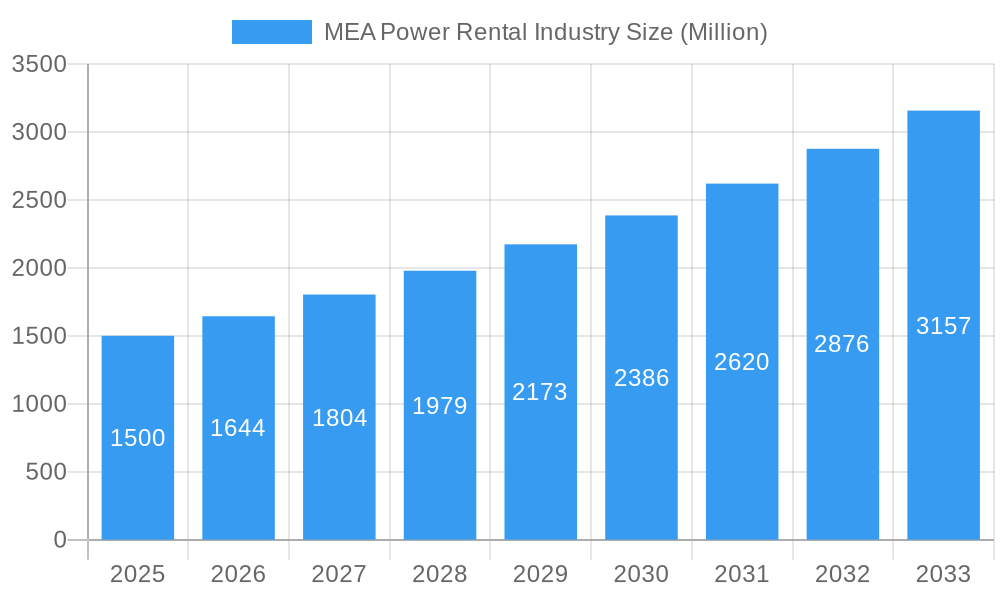
MEA Power Rental Industry Market Size (In Billion)
Government initiatives championing sustainable energy and infrastructure enhancement further bolster the MEA power rental market's growth. Economic diversification across the region also fuels demand for temporary power solutions. While multiple factors contribute to market expansion, robust economic projections, significant investments in large-scale projects, and the persistent need for reliable power during unexpected outages collectively underscore sustained market growth. Industry players are proactively responding with tailored solutions, expanded service networks, and innovative technologies focused on efficiency and reduced environmental impact. This strategic approach, coupled with a positive regional economic outlook, solidifies the MEA power rental market's strong growth prospects.
MEA Power Rental Industry Company Market Share
MEA Power Rental Industry Market Report: 2019-2033
This comprehensive report provides an in-depth analysis of the Middle East and Africa (MEA) power rental industry, offering invaluable insights for industry professionals, investors, and strategic planners. The report covers the period from 2019 to 2033, with a focus on the 2025-2033 forecast period, and utilizes 2025 as the base year. Market values are presented in millions of units.
MEA Power Rental Industry Market Dynamics & Structure
This section analyzes the MEA power rental market's competitive landscape, technological advancements, regulatory environment, and market trends. We delve into market concentration, exploring the market share held by key players such as Rental Solutions & Services LLC, Jubaili Bros LLC, Aggreko Middle East Ltd, Byrne Equipment Rental LLC, Jozi Power Limited, SES SMART Energy Solutions FZCO, KPS Power Generation, Peax Equipment Rental, and Eaton Corporation PLC (list not exhaustive). The analysis also considers the impact of mergers and acquisitions (M&A) activity on market structure.
- Market Concentration: The MEA power rental market exhibits a [xx]% concentration ratio (CRx), indicating [Describe market concentration - e.g., a moderately concentrated market with a few dominant players].
- Technological Innovation: Adoption of [mention specific technologies e.g., digital monitoring systems, advanced fuel-efficient generators] is driving growth, although [mention barriers e.g., high initial investment costs, lack of skilled workforce] hinder faster adoption.
- Regulatory Framework: Government regulations regarding [e.g., emissions standards, safety protocols] significantly influence market dynamics. [Mention specific regulations and their impact -e.g., stricter emission norms are pushing the adoption of natural gas generators].
- Competitive Substitutes: [mention alternatives e.g., grid-connected power, renewable energy sources] pose a competitive threat, particularly in [mention specific sectors e.g., the renewable energy sector].
- End-User Demographics: The construction, oil and gas, and utilities sectors are major end-users, with varying demand patterns based on project cycles and energy requirements.
- M&A Trends: The number of M&A deals in the MEA power rental sector from 2019-2024 totaled approximately [xx] deals, driven by [mention reasons e.g., expansion strategies, market consolidation].
MEA Power Rental Industry Growth Trends & Insights
This section provides a comprehensive overview of the MEA power rental market's growth trajectory. We analyze historical data (2019-2024) and project future growth (2025-2033), considering factors such as technological advancements, evolving end-user needs, and macroeconomic conditions. The market size is expected to reach [xx] million units by 2033, exhibiting a CAGR of [xx]% during the forecast period. [Include a detailed paragraph analysis of the market size evolution, adoption rates across different segments, technological disruptions like the shift towards digitalization and automation, and changes in consumer behavior and preferences in the MEA region over the study period].
Dominant Regions, Countries, or Segments in MEA Power Rental Industry
This section identifies the leading regions, countries, and segments within the MEA power rental market. Analysis includes market share, growth potential, and key drivers for each segment (Application: Prime Power, Peak Shaving, Emergency Standby; End-User: Utilities, Oil and Gas, Construction, Other End-Users; Fuel Type: Natural Gas, Diesel).
- Dominant Segment: The [mention dominant segment e.g., Prime Power application segment] currently dominates the market, accounting for [xx]% of the total market share in 2025.
- Key Drivers: [Specific bullet points highlighting economic policies like government infrastructure investments, industry-specific growth drivers like increased construction activity and oil & gas exploration, and other relevant factors for the dominant segment(s)].
- Regional Dominance: [Mention the dominant region/country and provide reasons for its leading position e.g., The UAE dominates due to its robust construction industry and large-scale infrastructure projects].
MEA Power Rental Industry Product Landscape
The MEA power rental market offers a diverse range of products, including [mention examples e.g., diesel generators, gas generators, mobile power plants]. Recent innovations focus on improving fuel efficiency, reducing emissions, and enhancing operational reliability through features such as remote monitoring and predictive maintenance. The key selling propositions are focused on [mention USPs, e.g., cost-effectiveness, reliability, and ease of operation]. Technological advancements include the integration of [mention specific tech e.g., IoT sensors and data analytics] for optimized performance and reduced downtime.
Key Drivers, Barriers & Challenges in MEA Power Rental Industry
Key Drivers: The MEA power rental market is propelled by several factors, including rising energy demand driven by [mention causes e.g., population growth, industrial expansion], the need for reliable backup power in regions with [mention challenges e.g., unreliable grid infrastructure], and increasing government investments in [mention areas e.g., infrastructure development].
Challenges: Key challenges include [mention specific challenges e.g., fluctuating fuel prices, stringent emission regulations, and intense competition]. These factors can impact profitability and market expansion. Supply chain disruptions, particularly regarding [mention specific disruptions e.g., procurement of critical components], could negatively affect availability and costs.
Emerging Opportunities in MEA Power Rental Industry
Emerging opportunities lie in [mention specific opportunities e.g., the growing adoption of renewable energy sources alongside traditional power generation, expansion into underserved markets, and the development of customized solutions for specific end-user needs]. Further opportunities exist in leveraging [mention technologies e.g., digital technologies] to enhance operational efficiency and customer experience.
Growth Accelerators in the MEA Power Rental Industry
Long-term growth will be fueled by continued infrastructure development, increasing investments in renewable energy sources [mention examples e.g., solar and wind], and advancements in power generation technologies [mention examples e.g., fuel cells and microgrids]. Strategic partnerships and collaborations between rental companies and technology providers can significantly enhance market penetration and accelerate innovation.
Key Players Shaping the MEA Power Rental Industry Market
- Rental Solutions & Services LLC
- Jubaili Bros LLC
- Eaton Corporation PLC
- Aggreko Middle East Ltd
- Byrne Equipment Rental LLC
- Jozi Power Limited
- SES SMART Energy Solutions FZCO
- KPS Power Generation
- Peax Equipment Rental
Notable Milestones in MEA Power Rental Industry Sector
- [Year/Month]: [Milestone description and its impact e.g., Aggreko Middle East launched a new range of low-emission generators, increasing market share in the environmentally conscious segment.]
- [Year/Month]: [Another milestone and impact]
- [Year/Month]: [Another milestone and impact]
- …
In-Depth MEA Power Rental Industry Market Outlook
The MEA power rental market is poised for significant growth in the coming years, driven by sustained infrastructure development, increasing urbanization, and the rising demand for reliable power solutions. Strategic opportunities abound for companies that can offer innovative, cost-effective, and environmentally friendly power rental solutions. The focus on digitalization, technological advancements, and sustainable practices will play a crucial role in shaping the future of the MEA power rental market.
MEA Power Rental Industry Segmentation
-
1. End-User
- 1.1. Utilities
- 1.2. Oil and Gas
- 1.3. Construction
- 1.4. Other End-Users
-
2. Fuel Type
- 2.1. Natural Gas
- 2.2. Diesel
-
3. Application
- 3.1. Prime Power
- 3.2. Peak Shaving
- 3.3. Emergency Standby
-
4. Geography
- 4.1. South Africa
- 4.2. Saudi Arabia
- 4.3. United Arab Emirates
- 4.4. Rest of Middle East and Africa
MEA Power Rental Industry Segmentation By Geography
- 1. South Africa
- 2. Saudi Arabia
- 3. United Arab Emirates
- 4. Rest of Middle East and Africa
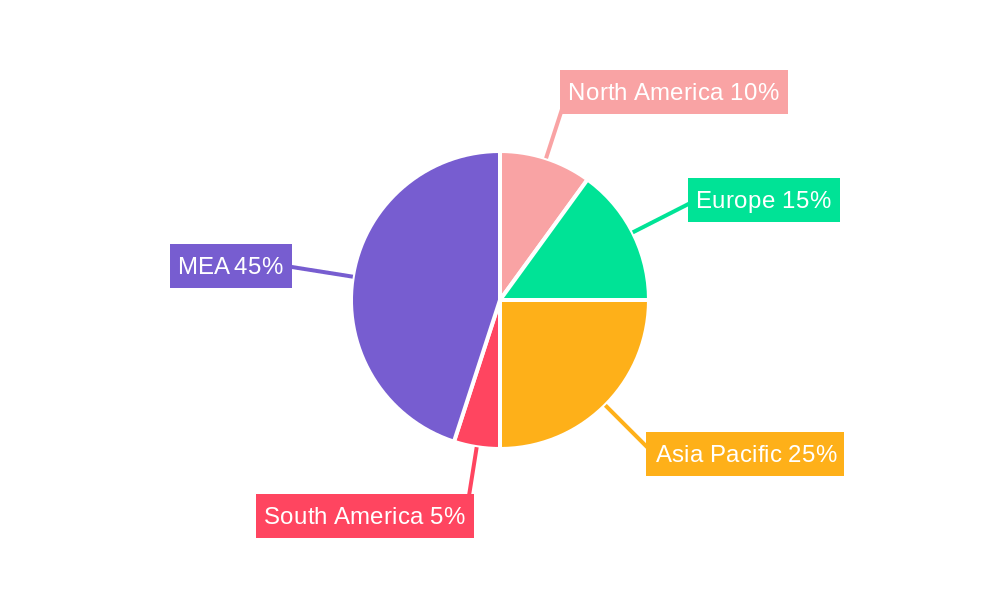
MEA Power Rental Industry Regional Market Share
Geographic Coverage of MEA Power Rental Industry
MEA Power Rental Industry REPORT HIGHLIGHTS
| Aspects | Details |
|---|---|
| Study Period | 2020-2034 |
| Base Year | 2025 |
| Estimated Year | 2026 |
| Forecast Period | 2026-2034 |
| Historical Period | 2020-2025 |
| Growth Rate | CAGR of 5.4% from 2020-2034 |
| Segmentation |
|
Table of Contents
- 1. Introduction
- 1.1. Research Scope
- 1.2. Market Segmentation
- 1.3. Research Objective
- 1.4. Definitions and Assumptions
- 2. Executive Summary
- 2.1. Market Snapshot
- 3. Market Dynamics
- 3.1. Market Drivers
- 3.2. Market Restrains
- 3.3. Market Trends
- 3.4. Market Opportunities
- 4. Market Factor Analysis
- 4.1. Porters Five Forces
- 4.1.1. Bargaining Power of Suppliers
- 4.1.2. Bargaining Power of Buyers
- 4.1.3. Threat of New Entrants
- 4.1.4. Threat of Substitutes
- 4.1.5. Competitive Rivalry
- 4.2. PESTEL analysis
- 4.3. BCG Analysis
- 4.3.1. Stars (High Growth, High Market Share)
- 4.3.2. Cash Cows (Low Growth, High Market Share)
- 4.3.3. Question Mark (High Growth, Low Market Share)
- 4.3.4. Dogs (Low Growth, Low Market Share)
- 4.4. Ansoff Matrix Analysis
- 4.5. Supply Chain Analysis
- 4.6. Regulatory Landscape
- 4.7. Current Market Potential and Opportunity Assessment (TAM–SAM–SOM Framework)
- 4.8. VDR Analyst Note
- 4.1. Porters Five Forces
- 5. Market Analysis, Insights and Forecast 2021-2033
- 5.1. Market Analysis, Insights and Forecast - by End-User
- 5.1.1. Utilities
- 5.1.2. Oil and Gas
- 5.1.3. Construction
- 5.1.4. Other End-Users
- 5.2. Market Analysis, Insights and Forecast - by Fuel Type
- 5.2.1. Natural Gas
- 5.2.2. Diesel
- 5.3. Market Analysis, Insights and Forecast - by Application
- 5.3.1. Prime Power
- 5.3.2. Peak Shaving
- 5.3.3. Emergency Standby
- 5.4. Market Analysis, Insights and Forecast - by Geography
- 5.4.1. South Africa
- 5.4.2. Saudi Arabia
- 5.4.3. United Arab Emirates
- 5.4.4. Rest of Middle East and Africa
- 5.5. Market Analysis, Insights and Forecast - by Region
- 5.5.1. South Africa
- 5.5.2. Saudi Arabia
- 5.5.3. United Arab Emirates
- 5.5.4. Rest of Middle East and Africa
- 5.1. Market Analysis, Insights and Forecast - by End-User
- 6. Global MEA Power Rental Industry Analysis, Insights and Forecast, 2021-2033
- 6.1. Market Analysis, Insights and Forecast - by End-User
- 6.1.1. Utilities
- 6.1.2. Oil and Gas
- 6.1.3. Construction
- 6.1.4. Other End-Users
- 6.2. Market Analysis, Insights and Forecast - by Fuel Type
- 6.2.1. Natural Gas
- 6.2.2. Diesel
- 6.3. Market Analysis, Insights and Forecast - by Application
- 6.3.1. Prime Power
- 6.3.2. Peak Shaving
- 6.3.3. Emergency Standby
- 6.4. Market Analysis, Insights and Forecast - by Geography
- 6.4.1. South Africa
- 6.4.2. Saudi Arabia
- 6.4.3. United Arab Emirates
- 6.4.4. Rest of Middle East and Africa
- 6.1. Market Analysis, Insights and Forecast - by End-User
- 7. South Africa MEA Power Rental Industry Analysis, Insights and Forecast, 2021-2033
- 7.1. Market Analysis, Insights and Forecast - by End-User
- 7.1.1. Utilities
- 7.1.2. Oil and Gas
- 7.1.3. Construction
- 7.1.4. Other End-Users
- 7.2. Market Analysis, Insights and Forecast - by Fuel Type
- 7.2.1. Natural Gas
- 7.2.2. Diesel
- 7.3. Market Analysis, Insights and Forecast - by Application
- 7.3.1. Prime Power
- 7.3.2. Peak Shaving
- 7.3.3. Emergency Standby
- 7.4. Market Analysis, Insights and Forecast - by Geography
- 7.4.1. South Africa
- 7.4.2. Saudi Arabia
- 7.4.3. United Arab Emirates
- 7.4.4. Rest of Middle East and Africa
- 7.1. Market Analysis, Insights and Forecast - by End-User
- 8. Saudi Arabia MEA Power Rental Industry Analysis, Insights and Forecast, 2021-2033
- 8.1. Market Analysis, Insights and Forecast - by End-User
- 8.1.1. Utilities
- 8.1.2. Oil and Gas
- 8.1.3. Construction
- 8.1.4. Other End-Users
- 8.2. Market Analysis, Insights and Forecast - by Fuel Type
- 8.2.1. Natural Gas
- 8.2.2. Diesel
- 8.3. Market Analysis, Insights and Forecast - by Application
- 8.3.1. Prime Power
- 8.3.2. Peak Shaving
- 8.3.3. Emergency Standby
- 8.4. Market Analysis, Insights and Forecast - by Geography
- 8.4.1. South Africa
- 8.4.2. Saudi Arabia
- 8.4.3. United Arab Emirates
- 8.4.4. Rest of Middle East and Africa
- 8.1. Market Analysis, Insights and Forecast - by End-User
- 9. United Arab Emirates MEA Power Rental Industry Analysis, Insights and Forecast, 2021-2033
- 9.1. Market Analysis, Insights and Forecast - by End-User
- 9.1.1. Utilities
- 9.1.2. Oil and Gas
- 9.1.3. Construction
- 9.1.4. Other End-Users
- 9.2. Market Analysis, Insights and Forecast - by Fuel Type
- 9.2.1. Natural Gas
- 9.2.2. Diesel
- 9.3. Market Analysis, Insights and Forecast - by Application
- 9.3.1. Prime Power
- 9.3.2. Peak Shaving
- 9.3.3. Emergency Standby
- 9.4. Market Analysis, Insights and Forecast - by Geography
- 9.4.1. South Africa
- 9.4.2. Saudi Arabia
- 9.4.3. United Arab Emirates
- 9.4.4. Rest of Middle East and Africa
- 9.1. Market Analysis, Insights and Forecast - by End-User
- 10. Rest of Middle East and Africa MEA Power Rental Industry Analysis, Insights and Forecast, 2021-2033
- 10.1. Market Analysis, Insights and Forecast - by End-User
- 10.1.1. Utilities
- 10.1.2. Oil and Gas
- 10.1.3. Construction
- 10.1.4. Other End-Users
- 10.2. Market Analysis, Insights and Forecast - by Fuel Type
- 10.2.1. Natural Gas
- 10.2.2. Diesel
- 10.3. Market Analysis, Insights and Forecast - by Application
- 10.3.1. Prime Power
- 10.3.2. Peak Shaving
- 10.3.3. Emergency Standby
- 10.4. Market Analysis, Insights and Forecast - by Geography
- 10.4.1. South Africa
- 10.4.2. Saudi Arabia
- 10.4.3. United Arab Emirates
- 10.4.4. Rest of Middle East and Africa
- 10.1. Market Analysis, Insights and Forecast - by End-User
- 11. Competitive Analysis
- 11.1. Company Profiles
- 11.1.1 Rental Solutions & Services LLC
- 11.1.1.1. Company Overview
- 11.1.1.2. Products
- 11.1.1.3. Company Financials
- 11.1.1.4. SWOT Analysis
- 11.1.2 Jubaili Bros LLC
- 11.1.2.1. Company Overview
- 11.1.2.2. Products
- 11.1.2.3. Company Financials
- 11.1.2.4. SWOT Analysis
- 11.1.3 Eaton Corporation PLC*List Not Exhaustive
- 11.1.3.1. Company Overview
- 11.1.3.2. Products
- 11.1.3.3. Company Financials
- 11.1.3.4. SWOT Analysis
- 11.1.4 Aggreko Middle East Ltd
- 11.1.4.1. Company Overview
- 11.1.4.2. Products
- 11.1.4.3. Company Financials
- 11.1.4.4. SWOT Analysis
- 11.1.5 Byrne Equipment Rental LLC
- 11.1.5.1. Company Overview
- 11.1.5.2. Products
- 11.1.5.3. Company Financials
- 11.1.5.4. SWOT Analysis
- 11.1.6 Jozi Power Limited
- 11.1.6.1. Company Overview
- 11.1.6.2. Products
- 11.1.6.3. Company Financials
- 11.1.6.4. SWOT Analysis
- 11.1.7 SES SMART Energy Solutions FZCO
- 11.1.7.1. Company Overview
- 11.1.7.2. Products
- 11.1.7.3. Company Financials
- 11.1.7.4. SWOT Analysis
- 11.1.8 KPS Power Generation
- 11.1.8.1. Company Overview
- 11.1.8.2. Products
- 11.1.8.3. Company Financials
- 11.1.8.4. SWOT Analysis
- 11.1.9 Peax Equipment Rental
- 11.1.9.1. Company Overview
- 11.1.9.2. Products
- 11.1.9.3. Company Financials
- 11.1.9.4. SWOT Analysis
- 11.1.1 Rental Solutions & Services LLC
- 11.2. Market Entropy
- 11.2.1 Company's Key Areas Served
- 11.2.2 Recent Developments
- 11.3. Company Market Share Analysis 2025
- 11.3.1 Top 5 Companies Market Share Analysis
- 11.3.2 Top 3 Companies Market Share Analysis
- 11.4. List of Potential Customers
- 12. Research Methodology
List of Figures
- Figure 1: Global MEA Power Rental Industry Revenue Breakdown (billion, %) by Region 2025 & 2033
- Figure 2: South Africa MEA Power Rental Industry Revenue (billion), by End-User 2025 & 2033
- Figure 3: South Africa MEA Power Rental Industry Revenue Share (%), by End-User 2025 & 2033
- Figure 4: South Africa MEA Power Rental Industry Revenue (billion), by Fuel Type 2025 & 2033
- Figure 5: South Africa MEA Power Rental Industry Revenue Share (%), by Fuel Type 2025 & 2033
- Figure 6: South Africa MEA Power Rental Industry Revenue (billion), by Application 2025 & 2033
- Figure 7: South Africa MEA Power Rental Industry Revenue Share (%), by Application 2025 & 2033
- Figure 8: South Africa MEA Power Rental Industry Revenue (billion), by Geography 2025 & 2033
- Figure 9: South Africa MEA Power Rental Industry Revenue Share (%), by Geography 2025 & 2033
- Figure 10: South Africa MEA Power Rental Industry Revenue (billion), by Country 2025 & 2033
- Figure 11: South Africa MEA Power Rental Industry Revenue Share (%), by Country 2025 & 2033
- Figure 12: Saudi Arabia MEA Power Rental Industry Revenue (billion), by End-User 2025 & 2033
- Figure 13: Saudi Arabia MEA Power Rental Industry Revenue Share (%), by End-User 2025 & 2033
- Figure 14: Saudi Arabia MEA Power Rental Industry Revenue (billion), by Fuel Type 2025 & 2033
- Figure 15: Saudi Arabia MEA Power Rental Industry Revenue Share (%), by Fuel Type 2025 & 2033
- Figure 16: Saudi Arabia MEA Power Rental Industry Revenue (billion), by Application 2025 & 2033
- Figure 17: Saudi Arabia MEA Power Rental Industry Revenue Share (%), by Application 2025 & 2033
- Figure 18: Saudi Arabia MEA Power Rental Industry Revenue (billion), by Geography 2025 & 2033
- Figure 19: Saudi Arabia MEA Power Rental Industry Revenue Share (%), by Geography 2025 & 2033
- Figure 20: Saudi Arabia MEA Power Rental Industry Revenue (billion), by Country 2025 & 2033
- Figure 21: Saudi Arabia MEA Power Rental Industry Revenue Share (%), by Country 2025 & 2033
- Figure 22: United Arab Emirates MEA Power Rental Industry Revenue (billion), by End-User 2025 & 2033
- Figure 23: United Arab Emirates MEA Power Rental Industry Revenue Share (%), by End-User 2025 & 2033
- Figure 24: United Arab Emirates MEA Power Rental Industry Revenue (billion), by Fuel Type 2025 & 2033
- Figure 25: United Arab Emirates MEA Power Rental Industry Revenue Share (%), by Fuel Type 2025 & 2033
- Figure 26: United Arab Emirates MEA Power Rental Industry Revenue (billion), by Application 2025 & 2033
- Figure 27: United Arab Emirates MEA Power Rental Industry Revenue Share (%), by Application 2025 & 2033
- Figure 28: United Arab Emirates MEA Power Rental Industry Revenue (billion), by Geography 2025 & 2033
- Figure 29: United Arab Emirates MEA Power Rental Industry Revenue Share (%), by Geography 2025 & 2033
- Figure 30: United Arab Emirates MEA Power Rental Industry Revenue (billion), by Country 2025 & 2033
- Figure 31: United Arab Emirates MEA Power Rental Industry Revenue Share (%), by Country 2025 & 2033
- Figure 32: Rest of Middle East and Africa MEA Power Rental Industry Revenue (billion), by End-User 2025 & 2033
- Figure 33: Rest of Middle East and Africa MEA Power Rental Industry Revenue Share (%), by End-User 2025 & 2033
- Figure 34: Rest of Middle East and Africa MEA Power Rental Industry Revenue (billion), by Fuel Type 2025 & 2033
- Figure 35: Rest of Middle East and Africa MEA Power Rental Industry Revenue Share (%), by Fuel Type 2025 & 2033
- Figure 36: Rest of Middle East and Africa MEA Power Rental Industry Revenue (billion), by Application 2025 & 2033
- Figure 37: Rest of Middle East and Africa MEA Power Rental Industry Revenue Share (%), by Application 2025 & 2033
- Figure 38: Rest of Middle East and Africa MEA Power Rental Industry Revenue (billion), by Geography 2025 & 2033
- Figure 39: Rest of Middle East and Africa MEA Power Rental Industry Revenue Share (%), by Geography 2025 & 2033
- Figure 40: Rest of Middle East and Africa MEA Power Rental Industry Revenue (billion), by Country 2025 & 2033
- Figure 41: Rest of Middle East and Africa MEA Power Rental Industry Revenue Share (%), by Country 2025 & 2033
List of Tables
- Table 1: Global MEA Power Rental Industry Revenue billion Forecast, by End-User 2020 & 2033
- Table 2: Global MEA Power Rental Industry Revenue billion Forecast, by Fuel Type 2020 & 2033
- Table 3: Global MEA Power Rental Industry Revenue billion Forecast, by Application 2020 & 2033
- Table 4: Global MEA Power Rental Industry Revenue billion Forecast, by Geography 2020 & 2033
- Table 5: Global MEA Power Rental Industry Revenue billion Forecast, by Region 2020 & 2033
- Table 6: Global MEA Power Rental Industry Revenue billion Forecast, by End-User 2020 & 2033
- Table 7: Global MEA Power Rental Industry Revenue billion Forecast, by Fuel Type 2020 & 2033
- Table 8: Global MEA Power Rental Industry Revenue billion Forecast, by Application 2020 & 2033
- Table 9: Global MEA Power Rental Industry Revenue billion Forecast, by Geography 2020 & 2033
- Table 10: Global MEA Power Rental Industry Revenue billion Forecast, by Country 2020 & 2033
- Table 11: Global MEA Power Rental Industry Revenue billion Forecast, by End-User 2020 & 2033
- Table 12: Global MEA Power Rental Industry Revenue billion Forecast, by Fuel Type 2020 & 2033
- Table 13: Global MEA Power Rental Industry Revenue billion Forecast, by Application 2020 & 2033
- Table 14: Global MEA Power Rental Industry Revenue billion Forecast, by Geography 2020 & 2033
- Table 15: Global MEA Power Rental Industry Revenue billion Forecast, by Country 2020 & 2033
- Table 16: Global MEA Power Rental Industry Revenue billion Forecast, by End-User 2020 & 2033
- Table 17: Global MEA Power Rental Industry Revenue billion Forecast, by Fuel Type 2020 & 2033
- Table 18: Global MEA Power Rental Industry Revenue billion Forecast, by Application 2020 & 2033
- Table 19: Global MEA Power Rental Industry Revenue billion Forecast, by Geography 2020 & 2033
- Table 20: Global MEA Power Rental Industry Revenue billion Forecast, by Country 2020 & 2033
- Table 21: Global MEA Power Rental Industry Revenue billion Forecast, by End-User 2020 & 2033
- Table 22: Global MEA Power Rental Industry Revenue billion Forecast, by Fuel Type 2020 & 2033
- Table 23: Global MEA Power Rental Industry Revenue billion Forecast, by Application 2020 & 2033
- Table 24: Global MEA Power Rental Industry Revenue billion Forecast, by Geography 2020 & 2033
- Table 25: Global MEA Power Rental Industry Revenue billion Forecast, by Country 2020 & 2033
Frequently Asked Questions
1. What is the projected Compound Annual Growth Rate (CAGR) of the MEA Power Rental Industry?
The projected CAGR is approximately 5.4%.
2. Which companies are prominent players in the MEA Power Rental Industry?
Key companies in the market include Rental Solutions & Services LLC, Jubaili Bros LLC, Eaton Corporation PLC*List Not Exhaustive, Aggreko Middle East Ltd, Byrne Equipment Rental LLC, Jozi Power Limited, SES SMART Energy Solutions FZCO, KPS Power Generation, Peax Equipment Rental.
3. What are the main segments of the MEA Power Rental Industry?
The market segments include End-User, Fuel Type, Application, Geography.
4. Can you provide details about the market size?
The market size is estimated to be USD 2.17 billion as of 2022.
5. What are some drivers contributing to market growth?
4.; Favorable Government Policies.
6. What are the notable trends driving market growth?
Utility Segment to Dominate the Market.
7. Are there any restraints impacting market growth?
4.; Rising Emphasis on Other Alternative Clean Energy Sources.
8. Can you provide examples of recent developments in the market?
N/A
9. What pricing options are available for accessing the report?
Pricing options include single-user, multi-user, and enterprise licenses priced at USD 4750, USD 5250, and USD 8750 respectively.
10. Is the market size provided in terms of value or volume?
The market size is provided in terms of value, measured in billion.
11. Are there any specific market keywords associated with the report?
Yes, the market keyword associated with the report is "MEA Power Rental Industry," which aids in identifying and referencing the specific market segment covered.
12. How do I determine which pricing option suits my needs best?
The pricing options vary based on user requirements and access needs. Individual users may opt for single-user licenses, while businesses requiring broader access may choose multi-user or enterprise licenses for cost-effective access to the report.
13. Are there any additional resources or data provided in the MEA Power Rental Industry report?
While the report offers comprehensive insights, it's advisable to review the specific contents or supplementary materials provided to ascertain if additional resources or data are available.
14. How can I stay updated on further developments or reports in the MEA Power Rental Industry?
To stay informed about further developments, trends, and reports in the MEA Power Rental Industry, consider subscribing to industry newsletters, following relevant companies and organizations, or regularly checking reputable industry news sources and publications.
Methodology
Step 1 - Identification of Relevant Samples Size from Population Database


Step 2 - Approaches for Defining Global Market Size (Value, Volume* & Price*)

Note*: In applicable scenarios
Step 3 - Data Sources
Primary Research
- Web Analytics
- Survey Reports
- Research Institute
- Latest Research Reports
- Opinion Leaders
Secondary Research
- Annual Reports
- White Paper
- Latest Press Release
- Industry Association
- Paid Database
- Investor Presentations

Step 4 - Data Triangulation
Involves using different sources of information in order to increase the validity of a study
These sources are likely to be stakeholders in a program - participants, other researchers, program staff, other community members, and so on.
Then we put all data in single framework & apply various statistical tools to find out the dynamic on the market.
During the analysis stage, feedback from the stakeholder groups would be compared to determine areas of agreement as well as areas of divergence