
Key Insights
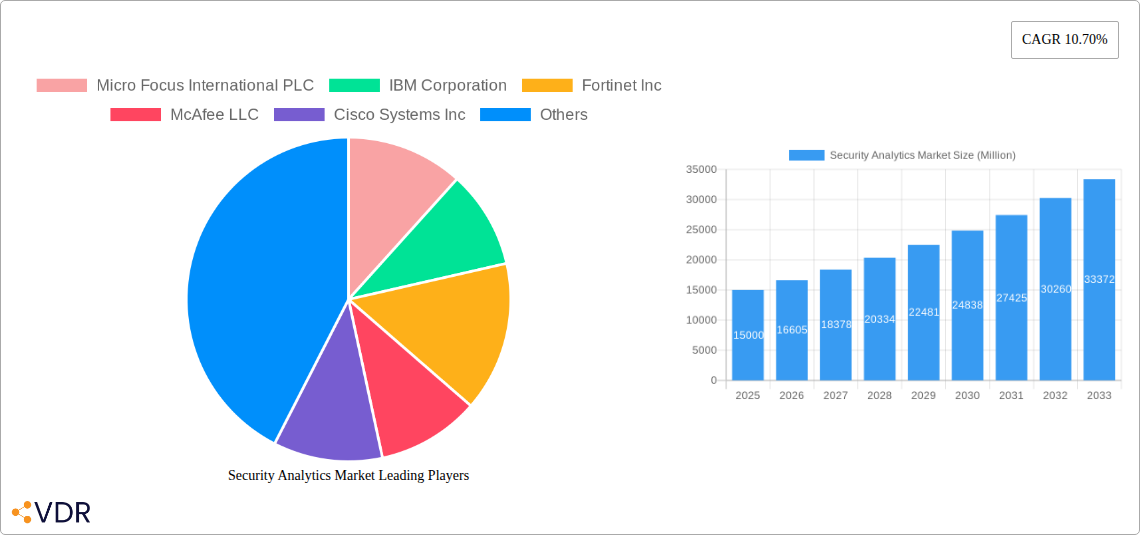
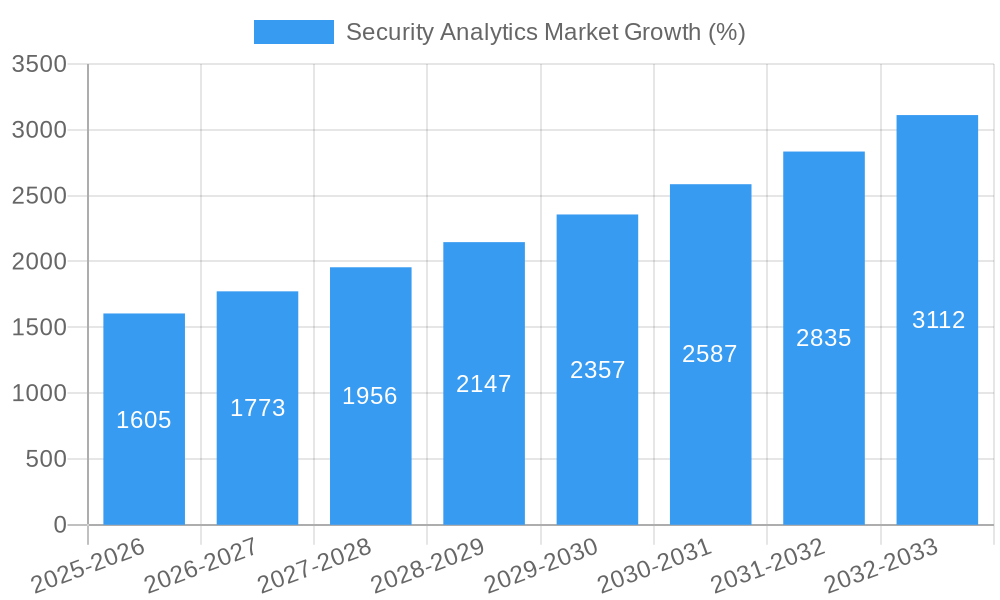
The Security Analytics market is experiencing robust growth, projected to reach a substantial size and maintain a Compound Annual Growth Rate (CAGR) of 10.70% from 2025 to 2033. This expansion is driven by several key factors. The increasing sophistication of cyber threats, coupled with the rising volume and complexity of data generated by organizations, necessitates advanced security analytics solutions. Regulations like GDPR and CCPA further incentivize businesses to enhance their security posture, contributing to market growth. The adoption of cloud computing and the expanding Internet of Things (IoT) also contribute significantly, as these technologies expand the attack surface, demanding more robust analytics capabilities. Market segmentation reveals strong demand across various applications, including network, application, web, and endpoint security analytics. The healthcare, defense and security, banking and financial services, and telecom and IT sectors are significant end-user industries driving market demand due to their critical reliance on data security and regulatory compliance.
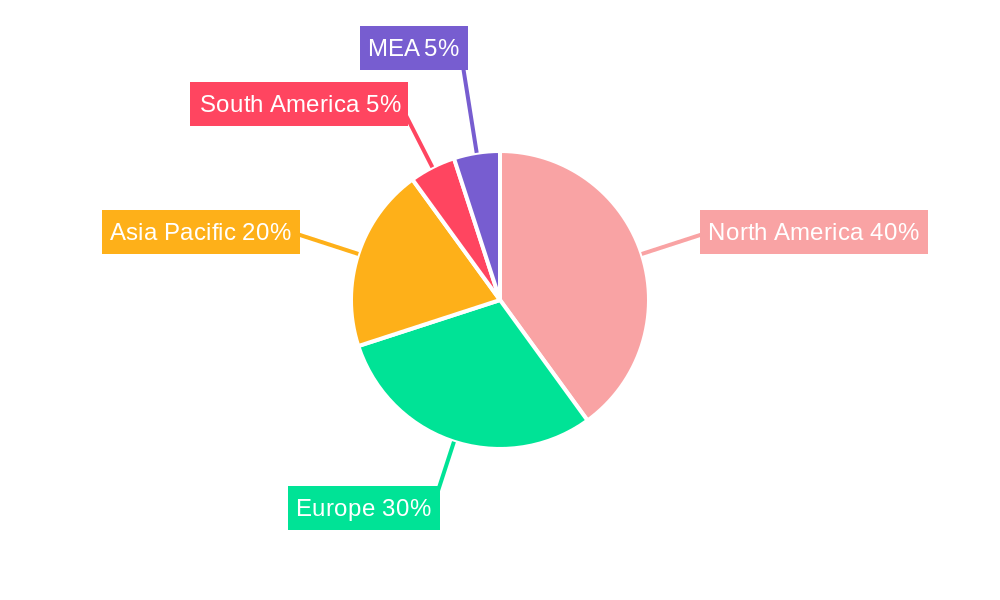
The market's competitive landscape is populated by both established players and emerging innovators. Companies like Micro Focus, IBM, Fortinet, McAfee, Cisco, and others offer a diverse range of security analytics solutions catering to various organizational needs and scales. Geographical analysis indicates strong market presence across North America, Europe, and Asia Pacific, reflecting high levels of technological adoption and cybersecurity awareness in these regions. While North America currently holds a significant market share, the Asia Pacific region is expected to exhibit substantial growth in the coming years, driven by increasing digitalization and investments in cybersecurity infrastructure. The continued evolution of cyber threats, technological advancements, and regulatory pressures will continue to shape the market dynamics, fostering innovation and further expansion of the security analytics sector throughout the forecast period.
Security Analytics Market: A Comprehensive Report (2019-2033)
This in-depth report provides a comprehensive analysis of the Security Analytics Market, encompassing market dynamics, growth trends, regional dominance, product landscape, key players, and future outlook. The study period covers 2019-2033, with 2025 as the base and estimated year, and a forecast period of 2025-2033. The report segments the market by application (Network Security Analytics, Application Security Analytics, Web Security Analytics, Endpoint Security Analytics) and end-user industry (Healthcare, Defense and Security, Banking and Financial Services, Telecom and IT), offering granular insights for strategic decision-making. The total market value in 2025 is estimated at xx Million.
Security Analytics Market Dynamics & Structure
The Security Analytics Market is characterized by a moderately concentrated landscape with key players like IBM Corporation, Fortinet Inc, and Cisco Systems Inc holding significant market share. However, the market exhibits considerable dynamism due to continuous technological innovation, evolving regulatory frameworks, and the emergence of competitive product substitutes. The market is driven by increasing cyber threats, stringent data privacy regulations (like GDPR and CCPA), and the rising adoption of cloud computing and IoT devices. Mergers and acquisitions (M&A) activity is a notable trend, with xx deals recorded between 2019 and 2024, reflecting the consolidation within the sector.
- Market Concentration: Moderately concentrated, with top 5 players holding approximately xx% market share in 2025.
- Technological Innovation Drivers: AI, Machine Learning, Big Data analytics, and automation are key drivers, enhancing threat detection and response capabilities.
- Regulatory Frameworks: GDPR, CCPA, and other data privacy regulations are driving demand for robust security analytics solutions.
- Competitive Product Substitutes: Traditional security solutions are being replaced by more comprehensive and integrated security analytics platforms.
- End-User Demographics: Large enterprises and government agencies constitute the majority of the market, although adoption is growing amongst SMBs.
- M&A Trends: A significant number of M&A activities, driven by the need for technology expansion and market consolidation.
Security Analytics Market Growth Trends & Insights
The Security Analytics Market is experiencing robust growth, with a Compound Annual Growth Rate (CAGR) of xx% during the forecast period (2025-2033). This growth is fueled by several factors, including the increasing sophistication and frequency of cyberattacks, growing adoption of cloud-based security solutions, and rising awareness regarding data security among organizations across various industries. The market penetration rate is estimated to reach xx% by 2033, indicating significant untapped potential. Technological disruptions, particularly in AI and machine learning, are further accelerating market growth by enabling more accurate threat detection and response. Consumer behavior shifts towards greater reliance on digital services and increased adoption of IoT devices contribute to the expanding market.
Dominant Regions, Countries, or Segments in Security Analytics Market
North America currently dominates the Security Analytics Market, holding approximately xx% of the global market share in 2025, followed by Europe and Asia-Pacific. Within the application segments, Network Security Analytics holds the largest share, driven by the widespread adoption of networking technologies and increasing reliance on network connectivity. The Banking and Financial Services sector is the leading end-user industry, owing to the high sensitivity of financial data and the stringent regulatory requirements surrounding its protection.
- Key Drivers for North America Dominance: Strong technological infrastructure, high cybersecurity awareness, and the presence of major technology companies.
- Key Drivers for Banking and Financial Services: Stringent regulatory compliance requirements and the high value of financial data make this sector a key adopter.
- Growth Potential: The Asia-Pacific region presents significant growth opportunities due to rising digitalization and increasing cybersecurity concerns.
Security Analytics Market Product Landscape
The Security Analytics Market offers a diverse range of products, including Security Information and Event Management (SIEM) systems, Security Orchestration, Automation, and Response (SOAR) platforms, User and Entity Behavior Analytics (UEBA) solutions, and cloud-based security analytics platforms. These solutions offer varied capabilities, from basic threat detection to advanced threat hunting and incident response. Key innovations include the integration of AI and machine learning for enhanced threat detection and automation capabilities. The focus is increasingly on providing comprehensive, integrated solutions that address the multifaceted nature of modern cyber threats.
Key Drivers, Barriers & Challenges in Security Analytics Market
Key Drivers: The increasing sophistication of cyberattacks, rising adoption of cloud and IoT technologies, expanding data volumes, and stringent data privacy regulations are major drivers of market growth. Government initiatives promoting cybersecurity also play a crucial role.
Key Challenges & Restraints: High implementation costs, skill shortages in cybersecurity professionals, and integration complexities with existing IT infrastructure can hinder market adoption. Furthermore, vendor lock-in and the constant evolution of cyber threats pose ongoing challenges. The impact of these factors on market growth is estimated to be approximately xx% reduction in CAGR by 2033.
Emerging Opportunities in Security Analytics Market
Emerging opportunities lie in the development of advanced threat intelligence platforms, integration with IoT security, and the growth of managed security services. The expansion into untapped markets like small and medium-sized businesses (SMBs) and the increasing demand for AI-powered threat detection and response systems also present lucrative opportunities. Furthermore, the development of specialized security analytics solutions for specific industries offers promising potential.
Growth Accelerators in the Security Analytics Market Industry
Strategic partnerships between security vendors and cloud providers, technological breakthroughs in AI and machine learning, and ongoing expansion into emerging markets are key catalysts for long-term growth in the Security Analytics Market. The increasing awareness of cybersecurity risks among businesses and consumers will further accelerate market adoption.
Key Players Shaping the Security Analytics Market Market
- Micro Focus International PLC
- IBM Corporation
- Fortinet Inc
- McAfee LLC
- Cisco Systems Inc
- Arbor Networks Inc
- Hewlett-Packard Enterprise Co
- Fireeye Inc
- Broadcom Inc (Symantec Corporation)
- Alert Logic Inc
- Splunk Inc
- RSA Security LLC
- Logrhythm Inc
Notable Milestones in Security Analytics Market Sector
- July 2022: Crowdstrike launched Falcon OverWatch Cloud Threat Hunting, enhancing cloud security threat detection capabilities.
- June 2022: Ensono partnered with ATPCO to offer enhanced monitoring and threat detection services, boosting operational excellence in Mainframe-as-a-Service.
In-Depth Security Analytics Market Market Outlook
The Security Analytics Market is poised for continued robust growth, driven by technological advancements, increasing cyber threats, and expanding regulatory requirements. Strategic opportunities exist for companies focusing on AI-powered solutions, cloud-based offerings, and integrated security platforms. The market's future potential is significant, with substantial growth expected across all segments and regions, particularly in developing economies.
Security Analytics Market Segmentation
-
1. Application
- 1.1. Network Security Analytics
- 1.2. Application Security Analytics
- 1.3. Web Security Analytics
- 1.4. Endpoint Security Analytics
-
2. End-user Industry
- 2.1. Healthcare
- 2.2. Defense and Security
- 2.3. Banking and Financial Services
- 2.4. Telecom and IT
Security Analytics Market Segmentation By Geography
- 1. North America
- 2. Europe
- 3. Asia Pacific
- 4. Latin America
- 5. Middle East
Security Analytics Market REPORT HIGHLIGHTS
| Aspects | Details |
|---|---|
| Study Period | 2019-2033 |
| Base Year | 2024 |
| Estimated Year | 2025 |
| Forecast Period | 2025-2033 |
| Historical Period | 2019-2024 |
| Growth Rate | CAGR of 10.70% from 2019-2033 |
| Segmentation |
|
Table of Contents
- 1. Introduction
- 1.1. Research Scope
- 1.2. Market Segmentation
- 1.3. Research Methodology
- 1.4. Definitions and Assumptions
- 2. Executive Summary
- 2.1. Introduction
- 3. Market Dynamics
- 3.1. Introduction
- 3.2. Market Drivers
- 3.2.1. Increasing Level of Sophistication of Threats And Security Breaches; Rise in IoT and BYOD Trend
- 3.3. Market Restrains
- 3.3.1. Lack of Data Integration and Connectivity
- 3.4. Market Trends
- 3.4.1. Network Security Analytics to Account for Significant Share
- 4. Market Factor Analysis
- 4.1. Porters Five Forces
- 4.2. Supply/Value Chain
- 4.3. PESTEL analysis
- 4.4. Market Entropy
- 4.5. Patent/Trademark Analysis
- 5. Global Security Analytics Market Analysis, Insights and Forecast, 2019-2031
- 5.1. Market Analysis, Insights and Forecast - by Application
- 5.1.1. Network Security Analytics
- 5.1.2. Application Security Analytics
- 5.1.3. Web Security Analytics
- 5.1.4. Endpoint Security Analytics
- 5.2. Market Analysis, Insights and Forecast - by End-user Industry
- 5.2.1. Healthcare
- 5.2.2. Defense and Security
- 5.2.3. Banking and Financial Services
- 5.2.4. Telecom and IT
- 5.3. Market Analysis, Insights and Forecast - by Region
- 5.3.1. North America
- 5.3.2. Europe
- 5.3.3. Asia Pacific
- 5.3.4. Latin America
- 5.3.5. Middle East
- 5.1. Market Analysis, Insights and Forecast - by Application
- 6. North America Security Analytics Market Analysis, Insights and Forecast, 2019-2031
- 6.1. Market Analysis, Insights and Forecast - by Application
- 6.1.1. Network Security Analytics
- 6.1.2. Application Security Analytics
- 6.1.3. Web Security Analytics
- 6.1.4. Endpoint Security Analytics
- 6.2. Market Analysis, Insights and Forecast - by End-user Industry
- 6.2.1. Healthcare
- 6.2.2. Defense and Security
- 6.2.3. Banking and Financial Services
- 6.2.4. Telecom and IT
- 6.1. Market Analysis, Insights and Forecast - by Application
- 7. Europe Security Analytics Market Analysis, Insights and Forecast, 2019-2031
- 7.1. Market Analysis, Insights and Forecast - by Application
- 7.1.1. Network Security Analytics
- 7.1.2. Application Security Analytics
- 7.1.3. Web Security Analytics
- 7.1.4. Endpoint Security Analytics
- 7.2. Market Analysis, Insights and Forecast - by End-user Industry
- 7.2.1. Healthcare
- 7.2.2. Defense and Security
- 7.2.3. Banking and Financial Services
- 7.2.4. Telecom and IT
- 7.1. Market Analysis, Insights and Forecast - by Application
- 8. Asia Pacific Security Analytics Market Analysis, Insights and Forecast, 2019-2031
- 8.1. Market Analysis, Insights and Forecast - by Application
- 8.1.1. Network Security Analytics
- 8.1.2. Application Security Analytics
- 8.1.3. Web Security Analytics
- 8.1.4. Endpoint Security Analytics
- 8.2. Market Analysis, Insights and Forecast - by End-user Industry
- 8.2.1. Healthcare
- 8.2.2. Defense and Security
- 8.2.3. Banking and Financial Services
- 8.2.4. Telecom and IT
- 8.1. Market Analysis, Insights and Forecast - by Application
- 9. Latin America Security Analytics Market Analysis, Insights and Forecast, 2019-2031
- 9.1. Market Analysis, Insights and Forecast - by Application
- 9.1.1. Network Security Analytics
- 9.1.2. Application Security Analytics
- 9.1.3. Web Security Analytics
- 9.1.4. Endpoint Security Analytics
- 9.2. Market Analysis, Insights and Forecast - by End-user Industry
- 9.2.1. Healthcare
- 9.2.2. Defense and Security
- 9.2.3. Banking and Financial Services
- 9.2.4. Telecom and IT
- 9.1. Market Analysis, Insights and Forecast - by Application
- 10. Middle East Security Analytics Market Analysis, Insights and Forecast, 2019-2031
- 10.1. Market Analysis, Insights and Forecast - by Application
- 10.1.1. Network Security Analytics
- 10.1.2. Application Security Analytics
- 10.1.3. Web Security Analytics
- 10.1.4. Endpoint Security Analytics
- 10.2. Market Analysis, Insights and Forecast - by End-user Industry
- 10.2.1. Healthcare
- 10.2.2. Defense and Security
- 10.2.3. Banking and Financial Services
- 10.2.4. Telecom and IT
- 10.1. Market Analysis, Insights and Forecast - by Application
- 11. North America Security Analytics Market Analysis, Insights and Forecast, 2019-2031
- 11.1. Market Analysis, Insights and Forecast - By Country/Sub-region
- 11.1.1 United States
- 11.1.2 Canada
- 11.1.3 Mexico
- 12. Europe Security Analytics Market Analysis, Insights and Forecast, 2019-2031
- 12.1. Market Analysis, Insights and Forecast - By Country/Sub-region
- 12.1.1 Germany
- 12.1.2 United Kingdom
- 12.1.3 France
- 12.1.4 Spain
- 12.1.5 Italy
- 12.1.6 Spain
- 12.1.7 Belgium
- 12.1.8 Netherland
- 12.1.9 Nordics
- 12.1.10 Rest of Europe
- 13. Asia Pacific Security Analytics Market Analysis, Insights and Forecast, 2019-2031
- 13.1. Market Analysis, Insights and Forecast - By Country/Sub-region
- 13.1.1 China
- 13.1.2 Japan
- 13.1.3 India
- 13.1.4 South Korea
- 13.1.5 Southeast Asia
- 13.1.6 Australia
- 13.1.7 Indonesia
- 13.1.8 Phillipes
- 13.1.9 Singapore
- 13.1.10 Thailandc
- 13.1.11 Rest of Asia Pacific
- 14. South America Security Analytics Market Analysis, Insights and Forecast, 2019-2031
- 14.1. Market Analysis, Insights and Forecast - By Country/Sub-region
- 14.1.1 Brazil
- 14.1.2 Argentina
- 14.1.3 Peru
- 14.1.4 Chile
- 14.1.5 Colombia
- 14.1.6 Ecuador
- 14.1.7 Venezuela
- 14.1.8 Rest of South America
- 15. North America Security Analytics Market Analysis, Insights and Forecast, 2019-2031
- 15.1. Market Analysis, Insights and Forecast - By Country/Sub-region
- 15.1.1 United States
- 15.1.2 Canada
- 15.1.3 Mexico
- 16. MEA Security Analytics Market Analysis, Insights and Forecast, 2019-2031
- 16.1. Market Analysis, Insights and Forecast - By Country/Sub-region
- 16.1.1 United Arab Emirates
- 16.1.2 Saudi Arabia
- 16.1.3 South Africa
- 16.1.4 Rest of Middle East and Africa
- 17. Competitive Analysis
- 17.1. Global Market Share Analysis 2024
- 17.2. Company Profiles
- 17.2.1 Micro Focus International PLC
- 17.2.1.1. Overview
- 17.2.1.2. Products
- 17.2.1.3. SWOT Analysis
- 17.2.1.4. Recent Developments
- 17.2.1.5. Financials (Based on Availability)
- 17.2.2 IBM Corporation
- 17.2.2.1. Overview
- 17.2.2.2. Products
- 17.2.2.3. SWOT Analysis
- 17.2.2.4. Recent Developments
- 17.2.2.5. Financials (Based on Availability)
- 17.2.3 Fortinet Inc
- 17.2.3.1. Overview
- 17.2.3.2. Products
- 17.2.3.3. SWOT Analysis
- 17.2.3.4. Recent Developments
- 17.2.3.5. Financials (Based on Availability)
- 17.2.4 McAfee LLC
- 17.2.4.1. Overview
- 17.2.4.2. Products
- 17.2.4.3. SWOT Analysis
- 17.2.4.4. Recent Developments
- 17.2.4.5. Financials (Based on Availability)
- 17.2.5 Cisco Systems Inc
- 17.2.5.1. Overview
- 17.2.5.2. Products
- 17.2.5.3. SWOT Analysis
- 17.2.5.4. Recent Developments
- 17.2.5.5. Financials (Based on Availability)
- 17.2.6 Arbor Networks Inc
- 17.2.6.1. Overview
- 17.2.6.2. Products
- 17.2.6.3. SWOT Analysis
- 17.2.6.4. Recent Developments
- 17.2.6.5. Financials (Based on Availability)
- 17.2.7 Hewlett-Packard Enterprise Co
- 17.2.7.1. Overview
- 17.2.7.2. Products
- 17.2.7.3. SWOT Analysis
- 17.2.7.4. Recent Developments
- 17.2.7.5. Financials (Based on Availability)
- 17.2.8 Fireeye Inc
- 17.2.8.1. Overview
- 17.2.8.2. Products
- 17.2.8.3. SWOT Analysis
- 17.2.8.4. Recent Developments
- 17.2.8.5. Financials (Based on Availability)
- 17.2.9 Broadcom Inc (Symantec Corporation)
- 17.2.9.1. Overview
- 17.2.9.2. Products
- 17.2.9.3. SWOT Analysis
- 17.2.9.4. Recent Developments
- 17.2.9.5. Financials (Based on Availability)
- 17.2.10 Alert Logic Inc
- 17.2.10.1. Overview
- 17.2.10.2. Products
- 17.2.10.3. SWOT Analysis
- 17.2.10.4. Recent Developments
- 17.2.10.5. Financials (Based on Availability)
- 17.2.11 Splunk Inc
- 17.2.11.1. Overview
- 17.2.11.2. Products
- 17.2.11.3. SWOT Analysis
- 17.2.11.4. Recent Developments
- 17.2.11.5. Financials (Based on Availability)
- 17.2.12 RSA Security LLC
- 17.2.12.1. Overview
- 17.2.12.2. Products
- 17.2.12.3. SWOT Analysis
- 17.2.12.4. Recent Developments
- 17.2.12.5. Financials (Based on Availability)
- 17.2.13 Logrhythm Inc
- 17.2.13.1. Overview
- 17.2.13.2. Products
- 17.2.13.3. SWOT Analysis
- 17.2.13.4. Recent Developments
- 17.2.13.5. Financials (Based on Availability)
- 17.2.1 Micro Focus International PLC
List of Figures
- Figure 1: Global Security Analytics Market Revenue Breakdown (Million, %) by Region 2024 & 2032
- Figure 2: Global Security Analytics Market Volume Breakdown (K Unit, %) by Region 2024 & 2032
- Figure 3: North America Security Analytics Market Revenue (Million), by Country 2024 & 2032
- Figure 4: North America Security Analytics Market Volume (K Unit), by Country 2024 & 2032
- Figure 5: North America Security Analytics Market Revenue Share (%), by Country 2024 & 2032
- Figure 6: North America Security Analytics Market Volume Share (%), by Country 2024 & 2032
- Figure 7: Europe Security Analytics Market Revenue (Million), by Country 2024 & 2032
- Figure 8: Europe Security Analytics Market Volume (K Unit), by Country 2024 & 2032
- Figure 9: Europe Security Analytics Market Revenue Share (%), by Country 2024 & 2032
- Figure 10: Europe Security Analytics Market Volume Share (%), by Country 2024 & 2032
- Figure 11: Asia Pacific Security Analytics Market Revenue (Million), by Country 2024 & 2032
- Figure 12: Asia Pacific Security Analytics Market Volume (K Unit), by Country 2024 & 2032
- Figure 13: Asia Pacific Security Analytics Market Revenue Share (%), by Country 2024 & 2032
- Figure 14: Asia Pacific Security Analytics Market Volume Share (%), by Country 2024 & 2032
- Figure 15: South America Security Analytics Market Revenue (Million), by Country 2024 & 2032
- Figure 16: South America Security Analytics Market Volume (K Unit), by Country 2024 & 2032
- Figure 17: South America Security Analytics Market Revenue Share (%), by Country 2024 & 2032
- Figure 18: South America Security Analytics Market Volume Share (%), by Country 2024 & 2032
- Figure 19: North America Security Analytics Market Revenue (Million), by Country 2024 & 2032
- Figure 20: North America Security Analytics Market Volume (K Unit), by Country 2024 & 2032
- Figure 21: North America Security Analytics Market Revenue Share (%), by Country 2024 & 2032
- Figure 22: North America Security Analytics Market Volume Share (%), by Country 2024 & 2032
- Figure 23: MEA Security Analytics Market Revenue (Million), by Country 2024 & 2032
- Figure 24: MEA Security Analytics Market Volume (K Unit), by Country 2024 & 2032
- Figure 25: MEA Security Analytics Market Revenue Share (%), by Country 2024 & 2032
- Figure 26: MEA Security Analytics Market Volume Share (%), by Country 2024 & 2032
- Figure 27: North America Security Analytics Market Revenue (Million), by Application 2024 & 2032
- Figure 28: North America Security Analytics Market Volume (K Unit), by Application 2024 & 2032
- Figure 29: North America Security Analytics Market Revenue Share (%), by Application 2024 & 2032
- Figure 30: North America Security Analytics Market Volume Share (%), by Application 2024 & 2032
- Figure 31: North America Security Analytics Market Revenue (Million), by End-user Industry 2024 & 2032
- Figure 32: North America Security Analytics Market Volume (K Unit), by End-user Industry 2024 & 2032
- Figure 33: North America Security Analytics Market Revenue Share (%), by End-user Industry 2024 & 2032
- Figure 34: North America Security Analytics Market Volume Share (%), by End-user Industry 2024 & 2032
- Figure 35: North America Security Analytics Market Revenue (Million), by Country 2024 & 2032
- Figure 36: North America Security Analytics Market Volume (K Unit), by Country 2024 & 2032
- Figure 37: North America Security Analytics Market Revenue Share (%), by Country 2024 & 2032
- Figure 38: North America Security Analytics Market Volume Share (%), by Country 2024 & 2032
- Figure 39: Europe Security Analytics Market Revenue (Million), by Application 2024 & 2032
- Figure 40: Europe Security Analytics Market Volume (K Unit), by Application 2024 & 2032
- Figure 41: Europe Security Analytics Market Revenue Share (%), by Application 2024 & 2032
- Figure 42: Europe Security Analytics Market Volume Share (%), by Application 2024 & 2032
- Figure 43: Europe Security Analytics Market Revenue (Million), by End-user Industry 2024 & 2032
- Figure 44: Europe Security Analytics Market Volume (K Unit), by End-user Industry 2024 & 2032
- Figure 45: Europe Security Analytics Market Revenue Share (%), by End-user Industry 2024 & 2032
- Figure 46: Europe Security Analytics Market Volume Share (%), by End-user Industry 2024 & 2032
- Figure 47: Europe Security Analytics Market Revenue (Million), by Country 2024 & 2032
- Figure 48: Europe Security Analytics Market Volume (K Unit), by Country 2024 & 2032
- Figure 49: Europe Security Analytics Market Revenue Share (%), by Country 2024 & 2032
- Figure 50: Europe Security Analytics Market Volume Share (%), by Country 2024 & 2032
- Figure 51: Asia Pacific Security Analytics Market Revenue (Million), by Application 2024 & 2032
- Figure 52: Asia Pacific Security Analytics Market Volume (K Unit), by Application 2024 & 2032
- Figure 53: Asia Pacific Security Analytics Market Revenue Share (%), by Application 2024 & 2032
- Figure 54: Asia Pacific Security Analytics Market Volume Share (%), by Application 2024 & 2032
- Figure 55: Asia Pacific Security Analytics Market Revenue (Million), by End-user Industry 2024 & 2032
- Figure 56: Asia Pacific Security Analytics Market Volume (K Unit), by End-user Industry 2024 & 2032
- Figure 57: Asia Pacific Security Analytics Market Revenue Share (%), by End-user Industry 2024 & 2032
- Figure 58: Asia Pacific Security Analytics Market Volume Share (%), by End-user Industry 2024 & 2032
- Figure 59: Asia Pacific Security Analytics Market Revenue (Million), by Country 2024 & 2032
- Figure 60: Asia Pacific Security Analytics Market Volume (K Unit), by Country 2024 & 2032
- Figure 61: Asia Pacific Security Analytics Market Revenue Share (%), by Country 2024 & 2032
- Figure 62: Asia Pacific Security Analytics Market Volume Share (%), by Country 2024 & 2032
- Figure 63: Latin America Security Analytics Market Revenue (Million), by Application 2024 & 2032
- Figure 64: Latin America Security Analytics Market Volume (K Unit), by Application 2024 & 2032
- Figure 65: Latin America Security Analytics Market Revenue Share (%), by Application 2024 & 2032
- Figure 66: Latin America Security Analytics Market Volume Share (%), by Application 2024 & 2032
- Figure 67: Latin America Security Analytics Market Revenue (Million), by End-user Industry 2024 & 2032
- Figure 68: Latin America Security Analytics Market Volume (K Unit), by End-user Industry 2024 & 2032
- Figure 69: Latin America Security Analytics Market Revenue Share (%), by End-user Industry 2024 & 2032
- Figure 70: Latin America Security Analytics Market Volume Share (%), by End-user Industry 2024 & 2032
- Figure 71: Latin America Security Analytics Market Revenue (Million), by Country 2024 & 2032
- Figure 72: Latin America Security Analytics Market Volume (K Unit), by Country 2024 & 2032
- Figure 73: Latin America Security Analytics Market Revenue Share (%), by Country 2024 & 2032
- Figure 74: Latin America Security Analytics Market Volume Share (%), by Country 2024 & 2032
- Figure 75: Middle East Security Analytics Market Revenue (Million), by Application 2024 & 2032
- Figure 76: Middle East Security Analytics Market Volume (K Unit), by Application 2024 & 2032
- Figure 77: Middle East Security Analytics Market Revenue Share (%), by Application 2024 & 2032
- Figure 78: Middle East Security Analytics Market Volume Share (%), by Application 2024 & 2032
- Figure 79: Middle East Security Analytics Market Revenue (Million), by End-user Industry 2024 & 2032
- Figure 80: Middle East Security Analytics Market Volume (K Unit), by End-user Industry 2024 & 2032
- Figure 81: Middle East Security Analytics Market Revenue Share (%), by End-user Industry 2024 & 2032
- Figure 82: Middle East Security Analytics Market Volume Share (%), by End-user Industry 2024 & 2032
- Figure 83: Middle East Security Analytics Market Revenue (Million), by Country 2024 & 2032
- Figure 84: Middle East Security Analytics Market Volume (K Unit), by Country 2024 & 2032
- Figure 85: Middle East Security Analytics Market Revenue Share (%), by Country 2024 & 2032
- Figure 86: Middle East Security Analytics Market Volume Share (%), by Country 2024 & 2032
List of Tables
- Table 1: Global Security Analytics Market Revenue Million Forecast, by Region 2019 & 2032
- Table 2: Global Security Analytics Market Volume K Unit Forecast, by Region 2019 & 2032
- Table 3: Global Security Analytics Market Revenue Million Forecast, by Application 2019 & 2032
- Table 4: Global Security Analytics Market Volume K Unit Forecast, by Application 2019 & 2032
- Table 5: Global Security Analytics Market Revenue Million Forecast, by End-user Industry 2019 & 2032
- Table 6: Global Security Analytics Market Volume K Unit Forecast, by End-user Industry 2019 & 2032
- Table 7: Global Security Analytics Market Revenue Million Forecast, by Region 2019 & 2032
- Table 8: Global Security Analytics Market Volume K Unit Forecast, by Region 2019 & 2032
- Table 9: Global Security Analytics Market Revenue Million Forecast, by Country 2019 & 2032
- Table 10: Global Security Analytics Market Volume K Unit Forecast, by Country 2019 & 2032
- Table 11: United States Security Analytics Market Revenue (Million) Forecast, by Application 2019 & 2032
- Table 12: United States Security Analytics Market Volume (K Unit) Forecast, by Application 2019 & 2032
- Table 13: Canada Security Analytics Market Revenue (Million) Forecast, by Application 2019 & 2032
- Table 14: Canada Security Analytics Market Volume (K Unit) Forecast, by Application 2019 & 2032
- Table 15: Mexico Security Analytics Market Revenue (Million) Forecast, by Application 2019 & 2032
- Table 16: Mexico Security Analytics Market Volume (K Unit) Forecast, by Application 2019 & 2032
- Table 17: Global Security Analytics Market Revenue Million Forecast, by Country 2019 & 2032
- Table 18: Global Security Analytics Market Volume K Unit Forecast, by Country 2019 & 2032
- Table 19: Germany Security Analytics Market Revenue (Million) Forecast, by Application 2019 & 2032
- Table 20: Germany Security Analytics Market Volume (K Unit) Forecast, by Application 2019 & 2032
- Table 21: United Kingdom Security Analytics Market Revenue (Million) Forecast, by Application 2019 & 2032
- Table 22: United Kingdom Security Analytics Market Volume (K Unit) Forecast, by Application 2019 & 2032
- Table 23: France Security Analytics Market Revenue (Million) Forecast, by Application 2019 & 2032
- Table 24: France Security Analytics Market Volume (K Unit) Forecast, by Application 2019 & 2032
- Table 25: Spain Security Analytics Market Revenue (Million) Forecast, by Application 2019 & 2032
- Table 26: Spain Security Analytics Market Volume (K Unit) Forecast, by Application 2019 & 2032
- Table 27: Italy Security Analytics Market Revenue (Million) Forecast, by Application 2019 & 2032
- Table 28: Italy Security Analytics Market Volume (K Unit) Forecast, by Application 2019 & 2032
- Table 29: Spain Security Analytics Market Revenue (Million) Forecast, by Application 2019 & 2032
- Table 30: Spain Security Analytics Market Volume (K Unit) Forecast, by Application 2019 & 2032
- Table 31: Belgium Security Analytics Market Revenue (Million) Forecast, by Application 2019 & 2032
- Table 32: Belgium Security Analytics Market Volume (K Unit) Forecast, by Application 2019 & 2032
- Table 33: Netherland Security Analytics Market Revenue (Million) Forecast, by Application 2019 & 2032
- Table 34: Netherland Security Analytics Market Volume (K Unit) Forecast, by Application 2019 & 2032
- Table 35: Nordics Security Analytics Market Revenue (Million) Forecast, by Application 2019 & 2032
- Table 36: Nordics Security Analytics Market Volume (K Unit) Forecast, by Application 2019 & 2032
- Table 37: Rest of Europe Security Analytics Market Revenue (Million) Forecast, by Application 2019 & 2032
- Table 38: Rest of Europe Security Analytics Market Volume (K Unit) Forecast, by Application 2019 & 2032
- Table 39: Global Security Analytics Market Revenue Million Forecast, by Country 2019 & 2032
- Table 40: Global Security Analytics Market Volume K Unit Forecast, by Country 2019 & 2032
- Table 41: China Security Analytics Market Revenue (Million) Forecast, by Application 2019 & 2032
- Table 42: China Security Analytics Market Volume (K Unit) Forecast, by Application 2019 & 2032
- Table 43: Japan Security Analytics Market Revenue (Million) Forecast, by Application 2019 & 2032
- Table 44: Japan Security Analytics Market Volume (K Unit) Forecast, by Application 2019 & 2032
- Table 45: India Security Analytics Market Revenue (Million) Forecast, by Application 2019 & 2032
- Table 46: India Security Analytics Market Volume (K Unit) Forecast, by Application 2019 & 2032
- Table 47: South Korea Security Analytics Market Revenue (Million) Forecast, by Application 2019 & 2032
- Table 48: South Korea Security Analytics Market Volume (K Unit) Forecast, by Application 2019 & 2032
- Table 49: Southeast Asia Security Analytics Market Revenue (Million) Forecast, by Application 2019 & 2032
- Table 50: Southeast Asia Security Analytics Market Volume (K Unit) Forecast, by Application 2019 & 2032
- Table 51: Australia Security Analytics Market Revenue (Million) Forecast, by Application 2019 & 2032
- Table 52: Australia Security Analytics Market Volume (K Unit) Forecast, by Application 2019 & 2032
- Table 53: Indonesia Security Analytics Market Revenue (Million) Forecast, by Application 2019 & 2032
- Table 54: Indonesia Security Analytics Market Volume (K Unit) Forecast, by Application 2019 & 2032
- Table 55: Phillipes Security Analytics Market Revenue (Million) Forecast, by Application 2019 & 2032
- Table 56: Phillipes Security Analytics Market Volume (K Unit) Forecast, by Application 2019 & 2032
- Table 57: Singapore Security Analytics Market Revenue (Million) Forecast, by Application 2019 & 2032
- Table 58: Singapore Security Analytics Market Volume (K Unit) Forecast, by Application 2019 & 2032
- Table 59: Thailandc Security Analytics Market Revenue (Million) Forecast, by Application 2019 & 2032
- Table 60: Thailandc Security Analytics Market Volume (K Unit) Forecast, by Application 2019 & 2032
- Table 61: Rest of Asia Pacific Security Analytics Market Revenue (Million) Forecast, by Application 2019 & 2032
- Table 62: Rest of Asia Pacific Security Analytics Market Volume (K Unit) Forecast, by Application 2019 & 2032
- Table 63: Global Security Analytics Market Revenue Million Forecast, by Country 2019 & 2032
- Table 64: Global Security Analytics Market Volume K Unit Forecast, by Country 2019 & 2032
- Table 65: Brazil Security Analytics Market Revenue (Million) Forecast, by Application 2019 & 2032
- Table 66: Brazil Security Analytics Market Volume (K Unit) Forecast, by Application 2019 & 2032
- Table 67: Argentina Security Analytics Market Revenue (Million) Forecast, by Application 2019 & 2032
- Table 68: Argentina Security Analytics Market Volume (K Unit) Forecast, by Application 2019 & 2032
- Table 69: Peru Security Analytics Market Revenue (Million) Forecast, by Application 2019 & 2032
- Table 70: Peru Security Analytics Market Volume (K Unit) Forecast, by Application 2019 & 2032
- Table 71: Chile Security Analytics Market Revenue (Million) Forecast, by Application 2019 & 2032
- Table 72: Chile Security Analytics Market Volume (K Unit) Forecast, by Application 2019 & 2032
- Table 73: Colombia Security Analytics Market Revenue (Million) Forecast, by Application 2019 & 2032
- Table 74: Colombia Security Analytics Market Volume (K Unit) Forecast, by Application 2019 & 2032
- Table 75: Ecuador Security Analytics Market Revenue (Million) Forecast, by Application 2019 & 2032
- Table 76: Ecuador Security Analytics Market Volume (K Unit) Forecast, by Application 2019 & 2032
- Table 77: Venezuela Security Analytics Market Revenue (Million) Forecast, by Application 2019 & 2032
- Table 78: Venezuela Security Analytics Market Volume (K Unit) Forecast, by Application 2019 & 2032
- Table 79: Rest of South America Security Analytics Market Revenue (Million) Forecast, by Application 2019 & 2032
- Table 80: Rest of South America Security Analytics Market Volume (K Unit) Forecast, by Application 2019 & 2032
- Table 81: Global Security Analytics Market Revenue Million Forecast, by Country 2019 & 2032
- Table 82: Global Security Analytics Market Volume K Unit Forecast, by Country 2019 & 2032
- Table 83: United States Security Analytics Market Revenue (Million) Forecast, by Application 2019 & 2032
- Table 84: United States Security Analytics Market Volume (K Unit) Forecast, by Application 2019 & 2032
- Table 85: Canada Security Analytics Market Revenue (Million) Forecast, by Application 2019 & 2032
- Table 86: Canada Security Analytics Market Volume (K Unit) Forecast, by Application 2019 & 2032
- Table 87: Mexico Security Analytics Market Revenue (Million) Forecast, by Application 2019 & 2032
- Table 88: Mexico Security Analytics Market Volume (K Unit) Forecast, by Application 2019 & 2032
- Table 89: Global Security Analytics Market Revenue Million Forecast, by Country 2019 & 2032
- Table 90: Global Security Analytics Market Volume K Unit Forecast, by Country 2019 & 2032
- Table 91: United Arab Emirates Security Analytics Market Revenue (Million) Forecast, by Application 2019 & 2032
- Table 92: United Arab Emirates Security Analytics Market Volume (K Unit) Forecast, by Application 2019 & 2032
- Table 93: Saudi Arabia Security Analytics Market Revenue (Million) Forecast, by Application 2019 & 2032
- Table 94: Saudi Arabia Security Analytics Market Volume (K Unit) Forecast, by Application 2019 & 2032
- Table 95: South Africa Security Analytics Market Revenue (Million) Forecast, by Application 2019 & 2032
- Table 96: South Africa Security Analytics Market Volume (K Unit) Forecast, by Application 2019 & 2032
- Table 97: Rest of Middle East and Africa Security Analytics Market Revenue (Million) Forecast, by Application 2019 & 2032
- Table 98: Rest of Middle East and Africa Security Analytics Market Volume (K Unit) Forecast, by Application 2019 & 2032
- Table 99: Global Security Analytics Market Revenue Million Forecast, by Application 2019 & 2032
- Table 100: Global Security Analytics Market Volume K Unit Forecast, by Application 2019 & 2032
- Table 101: Global Security Analytics Market Revenue Million Forecast, by End-user Industry 2019 & 2032
- Table 102: Global Security Analytics Market Volume K Unit Forecast, by End-user Industry 2019 & 2032
- Table 103: Global Security Analytics Market Revenue Million Forecast, by Country 2019 & 2032
- Table 104: Global Security Analytics Market Volume K Unit Forecast, by Country 2019 & 2032
- Table 105: Global Security Analytics Market Revenue Million Forecast, by Application 2019 & 2032
- Table 106: Global Security Analytics Market Volume K Unit Forecast, by Application 2019 & 2032
- Table 107: Global Security Analytics Market Revenue Million Forecast, by End-user Industry 2019 & 2032
- Table 108: Global Security Analytics Market Volume K Unit Forecast, by End-user Industry 2019 & 2032
- Table 109: Global Security Analytics Market Revenue Million Forecast, by Country 2019 & 2032
- Table 110: Global Security Analytics Market Volume K Unit Forecast, by Country 2019 & 2032
- Table 111: Global Security Analytics Market Revenue Million Forecast, by Application 2019 & 2032
- Table 112: Global Security Analytics Market Volume K Unit Forecast, by Application 2019 & 2032
- Table 113: Global Security Analytics Market Revenue Million Forecast, by End-user Industry 2019 & 2032
- Table 114: Global Security Analytics Market Volume K Unit Forecast, by End-user Industry 2019 & 2032
- Table 115: Global Security Analytics Market Revenue Million Forecast, by Country 2019 & 2032
- Table 116: Global Security Analytics Market Volume K Unit Forecast, by Country 2019 & 2032
- Table 117: Global Security Analytics Market Revenue Million Forecast, by Application 2019 & 2032
- Table 118: Global Security Analytics Market Volume K Unit Forecast, by Application 2019 & 2032
- Table 119: Global Security Analytics Market Revenue Million Forecast, by End-user Industry 2019 & 2032
- Table 120: Global Security Analytics Market Volume K Unit Forecast, by End-user Industry 2019 & 2032
- Table 121: Global Security Analytics Market Revenue Million Forecast, by Country 2019 & 2032
- Table 122: Global Security Analytics Market Volume K Unit Forecast, by Country 2019 & 2032
- Table 123: Global Security Analytics Market Revenue Million Forecast, by Application 2019 & 2032
- Table 124: Global Security Analytics Market Volume K Unit Forecast, by Application 2019 & 2032
- Table 125: Global Security Analytics Market Revenue Million Forecast, by End-user Industry 2019 & 2032
- Table 126: Global Security Analytics Market Volume K Unit Forecast, by End-user Industry 2019 & 2032
- Table 127: Global Security Analytics Market Revenue Million Forecast, by Country 2019 & 2032
- Table 128: Global Security Analytics Market Volume K Unit Forecast, by Country 2019 & 2032
Frequently Asked Questions
1. What is the projected Compound Annual Growth Rate (CAGR) of the Security Analytics Market?
The projected CAGR is approximately 10.70%.
2. Which companies are prominent players in the Security Analytics Market?
Key companies in the market include Micro Focus International PLC, IBM Corporation, Fortinet Inc, McAfee LLC, Cisco Systems Inc, Arbor Networks Inc, Hewlett-Packard Enterprise Co, Fireeye Inc, Broadcom Inc (Symantec Corporation), Alert Logic Inc, Splunk Inc, RSA Security LLC, Logrhythm Inc.
3. What are the main segments of the Security Analytics Market?
The market segments include Application, End-user Industry.
4. Can you provide details about the market size?
The market size is estimated to be USD XX Million as of 2022.
5. What are some drivers contributing to market growth?
Increasing Level of Sophistication of Threats And Security Breaches; Rise in IoT and BYOD Trend.
6. What are the notable trends driving market growth?
Network Security Analytics to Account for Significant Share.
7. Are there any restraints impacting market growth?
Lack of Data Integration and Connectivity.
8. Can you provide examples of recent developments in the market?
July 2022: Falcon OverWatch Cloud Threat Hunting, a new cloud threat hunting service from Crowdstrike, was launched, giving security teams the capability to continuously identify sophisticated and covert threats that originate from and remain in cloud settings. This helps onsite analysts identify vulnerabilities that put sensitive data at risk.
9. What pricing options are available for accessing the report?
Pricing options include single-user, multi-user, and enterprise licenses priced at USD 4750, USD 5250, and USD 8750 respectively.
10. Is the market size provided in terms of value or volume?
The market size is provided in terms of value, measured in Million and volume, measured in K Unit.
11. Are there any specific market keywords associated with the report?
Yes, the market keyword associated with the report is "Security Analytics Market," which aids in identifying and referencing the specific market segment covered.
12. How do I determine which pricing option suits my needs best?
The pricing options vary based on user requirements and access needs. Individual users may opt for single-user licenses, while businesses requiring broader access may choose multi-user or enterprise licenses for cost-effective access to the report.
13. Are there any additional resources or data provided in the Security Analytics Market report?
While the report offers comprehensive insights, it's advisable to review the specific contents or supplementary materials provided to ascertain if additional resources or data are available.
14. How can I stay updated on further developments or reports in the Security Analytics Market?
To stay informed about further developments, trends, and reports in the Security Analytics Market, consider subscribing to industry newsletters, following relevant companies and organizations, or regularly checking reputable industry news sources and publications.
Methodology
Step 1 - Identification of Relevant Samples Size from Population Database


Step 2 - Approaches for Defining Global Market Size (Value, Volume* & Price*)

Note*: In applicable scenarios
Step 3 - Data Sources
Primary Research
- Web Analytics
- Survey Reports
- Research Institute
- Latest Research Reports
- Opinion Leaders
Secondary Research
- Annual Reports
- White Paper
- Latest Press Release
- Industry Association
- Paid Database
- Investor Presentations

Step 4 - Data Triangulation
Involves using different sources of information in order to increase the validity of a study
These sources are likely to be stakeholders in a program - participants, other researchers, program staff, other community members, and so on.
Then we put all data in single framework & apply various statistical tools to find out the dynamic on the market.
During the analysis stage, feedback from the stakeholder groups would be compared to determine areas of agreement as well as areas of divergence


