
Key Insights
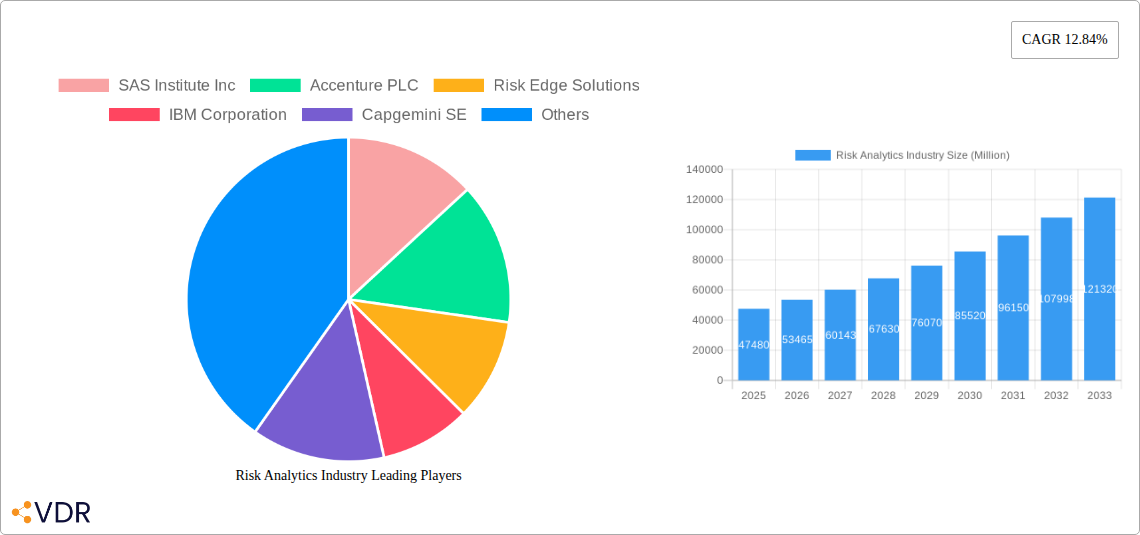
The global risk analytics market, valued at $47.48 billion in 2025, is projected to experience robust growth, exhibiting a Compound Annual Growth Rate (CAGR) of 12.84% from 2025 to 2033. This expansion is fueled by several key drivers. Increasing regulatory scrutiny across diverse sectors like BFSI (Banking, Financial Services, and Insurance), healthcare, and manufacturing necessitates sophisticated risk management solutions. Furthermore, the rising adoption of cloud-based deployment models offers scalability and cost-effectiveness, driving market growth. The increasing sophistication of cyber threats and data breaches is also significantly contributing to the demand for advanced risk analytics capabilities. The market is segmented by component (solution and service), deployment (on-premise and cloud), and end-user vertical (BFSI, healthcare, retail, manufacturing, and others). The BFSI segment is expected to maintain its dominance, driven by the need to mitigate financial risks and comply with stringent regulations. However, other sectors are also rapidly adopting risk analytics solutions, demonstrating a diversified growth trajectory. Competitive landscape analysis reveals key players such as SAS Institute, Accenture, IBM, and others actively investing in research and development and strategic partnerships to maintain a strong market presence.
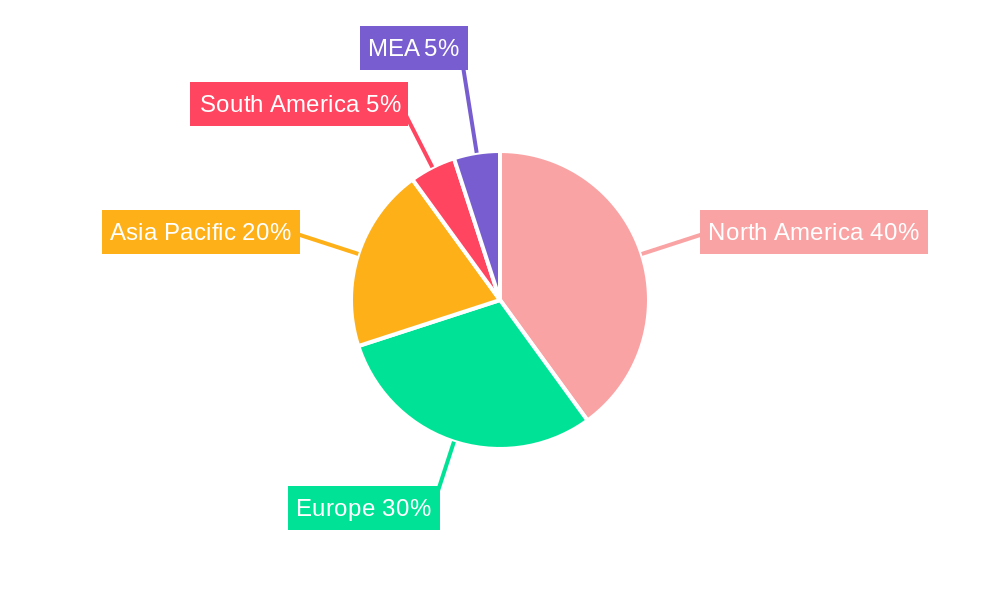
The geographical distribution of the market shows North America holding a significant market share, followed by Europe and Asia Pacific. However, emerging economies in Asia Pacific and South America are expected to demonstrate strong growth potential, driven by increasing digitalization and the adoption of advanced technologies. While the market faces certain restraints, such as the high cost of implementation and the complexity of integrating these solutions, the overall positive outlook, fueled by increasing data volumes and the imperative for proactive risk management, is expected to outweigh these challenges and drive sustained market expansion over the forecast period. Continuous innovation in areas like AI and machine learning are further accelerating the market's trajectory, enhancing the accuracy and efficiency of risk analytics solutions.
Risk Analytics Industry Market Report: 2019-2033
This comprehensive report delivers an in-depth analysis of the Risk Analytics industry, encompassing market dynamics, growth trends, regional dominance, product landscape, key players, and future outlook. The study period covers 2019-2033, with a base year of 2025 and a forecast period of 2025-2033. The report segments the market by component (Solution, Service), deployment (On-premise, Cloud), and end-user vertical (BFSI, Healthcare, Retail, Manufacturing, Other End-user Verticals (IT and Telecom)), providing granular insights into each sector. The total market size is predicted to reach xx Million by 2033.
Risk Analytics Industry Market Dynamics & Structure
The Risk Analytics market exhibits a moderately concentrated landscape, with key players like SAS Institute Inc., Accenture PLC, and IBM Corporation holding significant market share. Technological innovation, particularly in AI and machine learning, is a major driver, enhancing predictive capabilities and automation. Stringent regulatory frameworks, particularly in BFSI and healthcare, influence market growth and adoption. Competitive product substitutes, such as traditional risk assessment methods, exist but are being increasingly replaced by the efficiency and scalability of risk analytics solutions. The end-user demographic is broad, spanning diverse industries, but BFSI remains the dominant sector. M&A activity is frequent, reflecting consolidation and expansion efforts within the industry.
- Market Concentration: Moderately concentrated, with top 5 players holding approximately xx% market share in 2025.
- Technological Innovation: AI, Machine Learning, and Big Data Analytics drive efficiency and accuracy.
- Regulatory Frameworks: Compliance mandates (e.g., GDPR, CCPA) fuel demand, particularly in BFSI and Healthcare.
- Competitive Substitutes: Traditional risk assessment methods face decreasing relevance.
- End-User Demographics: BFSI, Healthcare, and Retail sectors show highest adoption rates.
- M&A Trends: xx M&A deals observed between 2019-2024, indicating industry consolidation.
Risk Analytics Industry Growth Trends & Insights
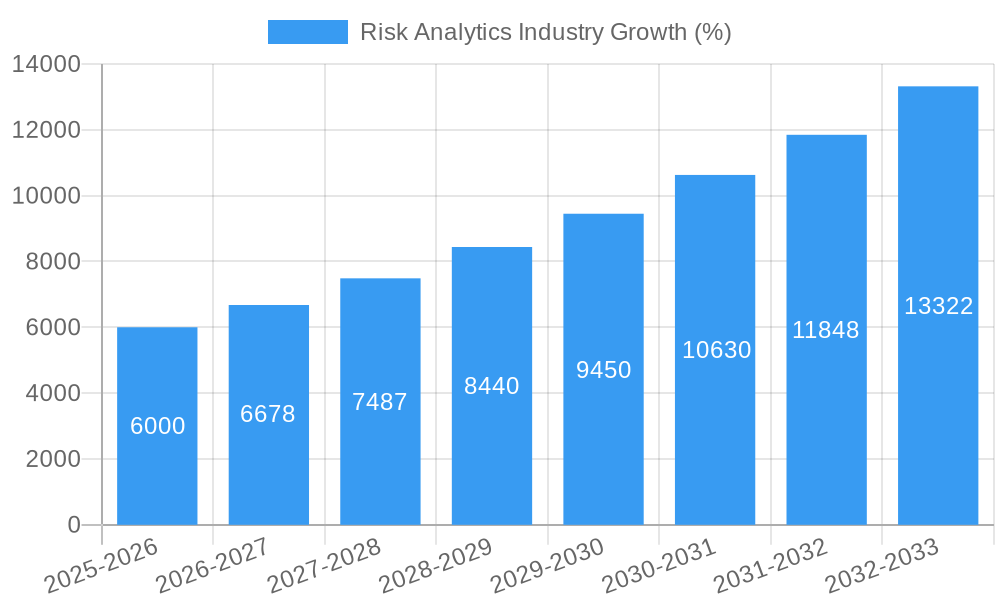
The Risk Analytics market experienced robust growth during the historical period (2019-2024), driven by increasing data volumes, heightened regulatory scrutiny, and the rising need for proactive risk management. The market size expanded from xx Million in 2019 to xx Million in 2024, recording a CAGR of xx%. This growth is expected to continue during the forecast period (2025-2033), propelled by factors like expanding cloud adoption, rising adoption of AI-powered solutions, and increasing demand from emerging economies. The adoption rate shows accelerated growth in cloud-based solutions, while on-premise solutions maintain a steady but slower growth. Consumer behavior shifts toward data-driven decision-making further solidify market expansion.
Dominant Regions, Countries, or Segments in Risk Analytics Industry
North America currently dominates the Risk Analytics market, driven by strong technological advancements, high adoption rates in the BFSI sector, and well-established regulatory frameworks. Within segments, the BFSI sector holds the largest market share, followed by Healthcare and Retail. The Cloud deployment model is exhibiting faster growth compared to the on-premise model, largely due to its scalability and cost-effectiveness.
- Leading Region: North America, driven by technological innovation and high adoption in BFSI.
- Leading Segment (Component): Solution segment, owing to its wide range of functionalities.
- Leading Segment (Deployment): Cloud deployment, propelled by scalability and cost advantages.
- Leading Segment (End-user Vertical): BFSI, due to stringent regulatory requirements and data-intensive nature.
- Key Drivers (North America): Strong regulatory environment, advanced technological infrastructure, high digital literacy.
- Key Drivers (BFSI): Strict compliance requirements, need for fraud detection, and credit risk management.
Risk Analytics Industry Product Landscape
The Risk Analytics product landscape is characterized by a diverse range of solutions, from basic risk scoring models to sophisticated AI-powered platforms offering predictive analytics, scenario modeling, and real-time monitoring. Product innovation centers on enhancing accuracy, automation, and integration capabilities. Key selling propositions include reduced operational costs, improved decision-making, and enhanced regulatory compliance. Technological advancements in AI, machine learning, and big data analytics are constantly shaping the landscape, leading to more sophisticated and effective risk management tools.
Key Drivers, Barriers & Challenges in Risk Analytics Industry
Key Drivers:
- Increasing data volumes and complexity
- Heightened regulatory scrutiny
- Need for proactive risk management
- Rise of AI and machine learning
Challenges & Restraints:
- High initial investment costs for advanced solutions
- Data security and privacy concerns
- Integration complexities with existing systems
- Lack of skilled professionals in some regions
Emerging Opportunities in Risk Analytics Industry
- Expansion into untapped markets (e.g., developing economies)
- Application of Risk Analytics in emerging sectors (e.g., ESG, Supply Chain)
- Development of specialized solutions for niche industries
- Integration of blockchain technology for enhanced data security and transparency
Growth Accelerators in the Risk Analytics Industry
The long-term growth of the Risk Analytics industry will be significantly accelerated by ongoing technological advancements, particularly in AI and machine learning, leading to the development of more sophisticated and accurate risk prediction models. Strategic partnerships between technology providers and industry-specific companies will further expand market reach and adoption. Furthermore, market expansion strategies, particularly in emerging economies with growing regulatory scrutiny, will play a crucial role in fueling market expansion.
Key Players Shaping the Risk Analytics Industry Market
- SAS Institute Inc.
- Accenture PLC
- Risk Edge Solutions
- IBM Corporation
- Capgemini SE
- Adenza Group Inc (AxiomSL Ltd)
- Provenir Inc
- OneSpan Inc
- Oracle Corporation
- Moody's Analytics Inc
- SAP SE
Notable Milestones in Risk Analytics Industry Sector
- November 2023: SimCorp's merger with Axioma strengthens its position in North America.
- August 2023: Kearney and Everstream Analytics expand partnership, integrating AI-powered risk analytics into supply chain management.
- November 2022: Elpha Secure partners with CyberCube for cyber risk analytics solutions in the ILS market.
- November 2022: Synspective and GCRS partner to offer SAR-based risk analysis solutions for critical infrastructure and mining in South Asia.
In-Depth Risk Analytics Industry Market Outlook
The Risk Analytics market exhibits substantial future potential, driven by the continuous need for effective and proactive risk management across various sectors. Technological advancements will lead to more sophisticated and personalized solutions, while strategic partnerships and market expansion efforts will further broaden the reach of these technologies. This, combined with rising regulatory pressure and increased data availability, positions the Risk Analytics industry for sustained and robust growth in the coming years.
Risk Analytics Industry Segmentation
-
1. Component
- 1.1. Solution
- 1.2. Service
-
2. Deployment
- 2.1. On-premise
- 2.2. Cloud
-
3. End-user Vertical
- 3.1. BFSI
- 3.2. Healthcare
- 3.3. Retail
- 3.4. Manufacturing
- 3.5. Other End-user Verticals (IT and Telecom)
Risk Analytics Industry Segmentation By Geography
-
1. North America
- 1.1. United States
- 1.2. Canada
-
2. Europe
- 2.1. Germany
- 2.2. United Kingdom
- 2.3. France
- 2.4. Spain
-
3. Asia
- 3.1. China
- 3.2. Japan
- 3.3. India
- 3.4. Australia and New Zealand
-
4. Latin America
- 4.1. Brazil
- 4.2. Mexico
- 4.3. Argentina
-
5. Middle East and Africa
- 5.1. United Arab Emirates
- 5.2. Saudi Arabia
- 5.3. South Africa
Risk Analytics Industry REPORT HIGHLIGHTS
| Aspects | Details |
|---|---|
| Study Period | 2019-2033 |
| Base Year | 2024 |
| Estimated Year | 2025 |
| Forecast Period | 2025-2033 |
| Historical Period | 2019-2024 |
| Growth Rate | CAGR of 12.84% from 2019-2033 |
| Segmentation |
|
Table of Contents
- 1. Introduction
- 1.1. Research Scope
- 1.2. Market Segmentation
- 1.3. Research Methodology
- 1.4. Definitions and Assumptions
- 2. Executive Summary
- 2.1. Introduction
- 3. Market Dynamics
- 3.1. Introduction
- 3.2. Market Drivers
- 3.2.1. Growing Complexities across Business Processes; Global Regulatory Frameworks and Government Policies
- 3.3. Market Restrains
- 3.3.1. High Installation and Operational Costs; Complicated Regulatory Compliance might hinder the Market Growth
- 3.4. Market Trends
- 3.4.1. BFSI is Expected to Witness Huge Adoption of Risk Analytics Solutions
- 4. Market Factor Analysis
- 4.1. Porters Five Forces
- 4.2. Supply/Value Chain
- 4.3. PESTEL analysis
- 4.4. Market Entropy
- 4.5. Patent/Trademark Analysis
- 5. Global Risk Analytics Industry Analysis, Insights and Forecast, 2019-2031
- 5.1. Market Analysis, Insights and Forecast - by Component
- 5.1.1. Solution
- 5.1.2. Service
- 5.2. Market Analysis, Insights and Forecast - by Deployment
- 5.2.1. On-premise
- 5.2.2. Cloud
- 5.3. Market Analysis, Insights and Forecast - by End-user Vertical
- 5.3.1. BFSI
- 5.3.2. Healthcare
- 5.3.3. Retail
- 5.3.4. Manufacturing
- 5.3.5. Other End-user Verticals (IT and Telecom)
- 5.4. Market Analysis, Insights and Forecast - by Region
- 5.4.1. North America
- 5.4.2. Europe
- 5.4.3. Asia
- 5.4.4. Latin America
- 5.4.5. Middle East and Africa
- 5.1. Market Analysis, Insights and Forecast - by Component
- 6. North America Risk Analytics Industry Analysis, Insights and Forecast, 2019-2031
- 6.1. Market Analysis, Insights and Forecast - by Component
- 6.1.1. Solution
- 6.1.2. Service
- 6.2. Market Analysis, Insights and Forecast - by Deployment
- 6.2.1. On-premise
- 6.2.2. Cloud
- 6.3. Market Analysis, Insights and Forecast - by End-user Vertical
- 6.3.1. BFSI
- 6.3.2. Healthcare
- 6.3.3. Retail
- 6.3.4. Manufacturing
- 6.3.5. Other End-user Verticals (IT and Telecom)
- 6.1. Market Analysis, Insights and Forecast - by Component
- 7. Europe Risk Analytics Industry Analysis, Insights and Forecast, 2019-2031
- 7.1. Market Analysis, Insights and Forecast - by Component
- 7.1.1. Solution
- 7.1.2. Service
- 7.2. Market Analysis, Insights and Forecast - by Deployment
- 7.2.1. On-premise
- 7.2.2. Cloud
- 7.3. Market Analysis, Insights and Forecast - by End-user Vertical
- 7.3.1. BFSI
- 7.3.2. Healthcare
- 7.3.3. Retail
- 7.3.4. Manufacturing
- 7.3.5. Other End-user Verticals (IT and Telecom)
- 7.1. Market Analysis, Insights and Forecast - by Component
- 8. Asia Risk Analytics Industry Analysis, Insights and Forecast, 2019-2031
- 8.1. Market Analysis, Insights and Forecast - by Component
- 8.1.1. Solution
- 8.1.2. Service
- 8.2. Market Analysis, Insights and Forecast - by Deployment
- 8.2.1. On-premise
- 8.2.2. Cloud
- 8.3. Market Analysis, Insights and Forecast - by End-user Vertical
- 8.3.1. BFSI
- 8.3.2. Healthcare
- 8.3.3. Retail
- 8.3.4. Manufacturing
- 8.3.5. Other End-user Verticals (IT and Telecom)
- 8.1. Market Analysis, Insights and Forecast - by Component
- 9. Latin America Risk Analytics Industry Analysis, Insights and Forecast, 2019-2031
- 9.1. Market Analysis, Insights and Forecast - by Component
- 9.1.1. Solution
- 9.1.2. Service
- 9.2. Market Analysis, Insights and Forecast - by Deployment
- 9.2.1. On-premise
- 9.2.2. Cloud
- 9.3. Market Analysis, Insights and Forecast - by End-user Vertical
- 9.3.1. BFSI
- 9.3.2. Healthcare
- 9.3.3. Retail
- 9.3.4. Manufacturing
- 9.3.5. Other End-user Verticals (IT and Telecom)
- 9.1. Market Analysis, Insights and Forecast - by Component
- 10. Middle East and Africa Risk Analytics Industry Analysis, Insights and Forecast, 2019-2031
- 10.1. Market Analysis, Insights and Forecast - by Component
- 10.1.1. Solution
- 10.1.2. Service
- 10.2. Market Analysis, Insights and Forecast - by Deployment
- 10.2.1. On-premise
- 10.2.2. Cloud
- 10.3. Market Analysis, Insights and Forecast - by End-user Vertical
- 10.3.1. BFSI
- 10.3.2. Healthcare
- 10.3.3. Retail
- 10.3.4. Manufacturing
- 10.3.5. Other End-user Verticals (IT and Telecom)
- 10.1. Market Analysis, Insights and Forecast - by Component
- 11. North America Risk Analytics Industry Analysis, Insights and Forecast, 2019-2031
- 11.1. Market Analysis, Insights and Forecast - By Country/Sub-region
- 11.1.1 United States
- 11.1.2 Canada
- 11.1.3 Mexico
- 12. Europe Risk Analytics Industry Analysis, Insights and Forecast, 2019-2031
- 12.1. Market Analysis, Insights and Forecast - By Country/Sub-region
- 12.1.1 Germany
- 12.1.2 United Kingdom
- 12.1.3 France
- 12.1.4 Spain
- 12.1.5 Italy
- 12.1.6 Spain
- 12.1.7 Belgium
- 12.1.8 Netherland
- 12.1.9 Nordics
- 12.1.10 Rest of Europe
- 13. Asia Pacific Risk Analytics Industry Analysis, Insights and Forecast, 2019-2031
- 13.1. Market Analysis, Insights and Forecast - By Country/Sub-region
- 13.1.1 China
- 13.1.2 Japan
- 13.1.3 India
- 13.1.4 South Korea
- 13.1.5 Southeast Asia
- 13.1.6 Australia
- 13.1.7 Indonesia
- 13.1.8 Phillipes
- 13.1.9 Singapore
- 13.1.10 Thailandc
- 13.1.11 Rest of Asia Pacific
- 14. South America Risk Analytics Industry Analysis, Insights and Forecast, 2019-2031
- 14.1. Market Analysis, Insights and Forecast - By Country/Sub-region
- 14.1.1 Brazil
- 14.1.2 Argentina
- 14.1.3 Peru
- 14.1.4 Chile
- 14.1.5 Colombia
- 14.1.6 Ecuador
- 14.1.7 Venezuela
- 14.1.8 Rest of South America
- 15. North America Risk Analytics Industry Analysis, Insights and Forecast, 2019-2031
- 15.1. Market Analysis, Insights and Forecast - By Country/Sub-region
- 15.1.1 United States
- 15.1.2 Canada
- 15.1.3 Mexico
- 16. MEA Risk Analytics Industry Analysis, Insights and Forecast, 2019-2031
- 16.1. Market Analysis, Insights and Forecast - By Country/Sub-region
- 16.1.1 United Arab Emirates
- 16.1.2 Saudi Arabia
- 16.1.3 South Africa
- 16.1.4 Rest of Middle East and Africa
- 17. Competitive Analysis
- 17.1. Global Market Share Analysis 2024
- 17.2. Company Profiles
- 17.2.1 SAS Institute Inc
- 17.2.1.1. Overview
- 17.2.1.2. Products
- 17.2.1.3. SWOT Analysis
- 17.2.1.4. Recent Developments
- 17.2.1.5. Financials (Based on Availability)
- 17.2.2 Accenture PLC
- 17.2.2.1. Overview
- 17.2.2.2. Products
- 17.2.2.3. SWOT Analysis
- 17.2.2.4. Recent Developments
- 17.2.2.5. Financials (Based on Availability)
- 17.2.3 Risk Edge Solutions
- 17.2.3.1. Overview
- 17.2.3.2. Products
- 17.2.3.3. SWOT Analysis
- 17.2.3.4. Recent Developments
- 17.2.3.5. Financials (Based on Availability)
- 17.2.4 IBM Corporation
- 17.2.4.1. Overview
- 17.2.4.2. Products
- 17.2.4.3. SWOT Analysis
- 17.2.4.4. Recent Developments
- 17.2.4.5. Financials (Based on Availability)
- 17.2.5 Capgemini SE
- 17.2.5.1. Overview
- 17.2.5.2. Products
- 17.2.5.3. SWOT Analysis
- 17.2.5.4. Recent Developments
- 17.2.5.5. Financials (Based on Availability)
- 17.2.6 Adenza Group Inc (AxiomSL Ltd )
- 17.2.6.1. Overview
- 17.2.6.2. Products
- 17.2.6.3. SWOT Analysis
- 17.2.6.4. Recent Developments
- 17.2.6.5. Financials (Based on Availability)
- 17.2.7 Provenir Inc
- 17.2.7.1. Overview
- 17.2.7.2. Products
- 17.2.7.3. SWOT Analysis
- 17.2.7.4. Recent Developments
- 17.2.7.5. Financials (Based on Availability)
- 17.2.8 OneSpan Inc
- 17.2.8.1. Overview
- 17.2.8.2. Products
- 17.2.8.3. SWOT Analysis
- 17.2.8.4. Recent Developments
- 17.2.8.5. Financials (Based on Availability)
- 17.2.9 Oracle Corporation
- 17.2.9.1. Overview
- 17.2.9.2. Products
- 17.2.9.3. SWOT Analysis
- 17.2.9.4. Recent Developments
- 17.2.9.5. Financials (Based on Availability)
- 17.2.10 Moody's Analytics Inc
- 17.2.10.1. Overview
- 17.2.10.2. Products
- 17.2.10.3. SWOT Analysis
- 17.2.10.4. Recent Developments
- 17.2.10.5. Financials (Based on Availability)
- 17.2.11 SAP SE
- 17.2.11.1. Overview
- 17.2.11.2. Products
- 17.2.11.3. SWOT Analysis
- 17.2.11.4. Recent Developments
- 17.2.11.5. Financials (Based on Availability)
- 17.2.1 SAS Institute Inc
List of Figures
- Figure 1: Global Risk Analytics Industry Revenue Breakdown (Million, %) by Region 2024 & 2032
- Figure 2: North America Risk Analytics Industry Revenue (Million), by Country 2024 & 2032
- Figure 3: North America Risk Analytics Industry Revenue Share (%), by Country 2024 & 2032
- Figure 4: Europe Risk Analytics Industry Revenue (Million), by Country 2024 & 2032
- Figure 5: Europe Risk Analytics Industry Revenue Share (%), by Country 2024 & 2032
- Figure 6: Asia Pacific Risk Analytics Industry Revenue (Million), by Country 2024 & 2032
- Figure 7: Asia Pacific Risk Analytics Industry Revenue Share (%), by Country 2024 & 2032
- Figure 8: South America Risk Analytics Industry Revenue (Million), by Country 2024 & 2032
- Figure 9: South America Risk Analytics Industry Revenue Share (%), by Country 2024 & 2032
- Figure 10: North America Risk Analytics Industry Revenue (Million), by Country 2024 & 2032
- Figure 11: North America Risk Analytics Industry Revenue Share (%), by Country 2024 & 2032
- Figure 12: MEA Risk Analytics Industry Revenue (Million), by Country 2024 & 2032
- Figure 13: MEA Risk Analytics Industry Revenue Share (%), by Country 2024 & 2032
- Figure 14: North America Risk Analytics Industry Revenue (Million), by Component 2024 & 2032
- Figure 15: North America Risk Analytics Industry Revenue Share (%), by Component 2024 & 2032
- Figure 16: North America Risk Analytics Industry Revenue (Million), by Deployment 2024 & 2032
- Figure 17: North America Risk Analytics Industry Revenue Share (%), by Deployment 2024 & 2032
- Figure 18: North America Risk Analytics Industry Revenue (Million), by End-user Vertical 2024 & 2032
- Figure 19: North America Risk Analytics Industry Revenue Share (%), by End-user Vertical 2024 & 2032
- Figure 20: North America Risk Analytics Industry Revenue (Million), by Country 2024 & 2032
- Figure 21: North America Risk Analytics Industry Revenue Share (%), by Country 2024 & 2032
- Figure 22: Europe Risk Analytics Industry Revenue (Million), by Component 2024 & 2032
- Figure 23: Europe Risk Analytics Industry Revenue Share (%), by Component 2024 & 2032
- Figure 24: Europe Risk Analytics Industry Revenue (Million), by Deployment 2024 & 2032
- Figure 25: Europe Risk Analytics Industry Revenue Share (%), by Deployment 2024 & 2032
- Figure 26: Europe Risk Analytics Industry Revenue (Million), by End-user Vertical 2024 & 2032
- Figure 27: Europe Risk Analytics Industry Revenue Share (%), by End-user Vertical 2024 & 2032
- Figure 28: Europe Risk Analytics Industry Revenue (Million), by Country 2024 & 2032
- Figure 29: Europe Risk Analytics Industry Revenue Share (%), by Country 2024 & 2032
- Figure 30: Asia Risk Analytics Industry Revenue (Million), by Component 2024 & 2032
- Figure 31: Asia Risk Analytics Industry Revenue Share (%), by Component 2024 & 2032
- Figure 32: Asia Risk Analytics Industry Revenue (Million), by Deployment 2024 & 2032
- Figure 33: Asia Risk Analytics Industry Revenue Share (%), by Deployment 2024 & 2032
- Figure 34: Asia Risk Analytics Industry Revenue (Million), by End-user Vertical 2024 & 2032
- Figure 35: Asia Risk Analytics Industry Revenue Share (%), by End-user Vertical 2024 & 2032
- Figure 36: Asia Risk Analytics Industry Revenue (Million), by Country 2024 & 2032
- Figure 37: Asia Risk Analytics Industry Revenue Share (%), by Country 2024 & 2032
- Figure 38: Latin America Risk Analytics Industry Revenue (Million), by Component 2024 & 2032
- Figure 39: Latin America Risk Analytics Industry Revenue Share (%), by Component 2024 & 2032
- Figure 40: Latin America Risk Analytics Industry Revenue (Million), by Deployment 2024 & 2032
- Figure 41: Latin America Risk Analytics Industry Revenue Share (%), by Deployment 2024 & 2032
- Figure 42: Latin America Risk Analytics Industry Revenue (Million), by End-user Vertical 2024 & 2032
- Figure 43: Latin America Risk Analytics Industry Revenue Share (%), by End-user Vertical 2024 & 2032
- Figure 44: Latin America Risk Analytics Industry Revenue (Million), by Country 2024 & 2032
- Figure 45: Latin America Risk Analytics Industry Revenue Share (%), by Country 2024 & 2032
- Figure 46: Middle East and Africa Risk Analytics Industry Revenue (Million), by Component 2024 & 2032
- Figure 47: Middle East and Africa Risk Analytics Industry Revenue Share (%), by Component 2024 & 2032
- Figure 48: Middle East and Africa Risk Analytics Industry Revenue (Million), by Deployment 2024 & 2032
- Figure 49: Middle East and Africa Risk Analytics Industry Revenue Share (%), by Deployment 2024 & 2032
- Figure 50: Middle East and Africa Risk Analytics Industry Revenue (Million), by End-user Vertical 2024 & 2032
- Figure 51: Middle East and Africa Risk Analytics Industry Revenue Share (%), by End-user Vertical 2024 & 2032
- Figure 52: Middle East and Africa Risk Analytics Industry Revenue (Million), by Country 2024 & 2032
- Figure 53: Middle East and Africa Risk Analytics Industry Revenue Share (%), by Country 2024 & 2032
List of Tables
- Table 1: Global Risk Analytics Industry Revenue Million Forecast, by Region 2019 & 2032
- Table 2: Global Risk Analytics Industry Revenue Million Forecast, by Component 2019 & 2032
- Table 3: Global Risk Analytics Industry Revenue Million Forecast, by Deployment 2019 & 2032
- Table 4: Global Risk Analytics Industry Revenue Million Forecast, by End-user Vertical 2019 & 2032
- Table 5: Global Risk Analytics Industry Revenue Million Forecast, by Region 2019 & 2032
- Table 6: Global Risk Analytics Industry Revenue Million Forecast, by Country 2019 & 2032
- Table 7: United States Risk Analytics Industry Revenue (Million) Forecast, by Application 2019 & 2032
- Table 8: Canada Risk Analytics Industry Revenue (Million) Forecast, by Application 2019 & 2032
- Table 9: Mexico Risk Analytics Industry Revenue (Million) Forecast, by Application 2019 & 2032
- Table 10: Global Risk Analytics Industry Revenue Million Forecast, by Country 2019 & 2032
- Table 11: Germany Risk Analytics Industry Revenue (Million) Forecast, by Application 2019 & 2032
- Table 12: United Kingdom Risk Analytics Industry Revenue (Million) Forecast, by Application 2019 & 2032
- Table 13: France Risk Analytics Industry Revenue (Million) Forecast, by Application 2019 & 2032
- Table 14: Spain Risk Analytics Industry Revenue (Million) Forecast, by Application 2019 & 2032
- Table 15: Italy Risk Analytics Industry Revenue (Million) Forecast, by Application 2019 & 2032
- Table 16: Spain Risk Analytics Industry Revenue (Million) Forecast, by Application 2019 & 2032
- Table 17: Belgium Risk Analytics Industry Revenue (Million) Forecast, by Application 2019 & 2032
- Table 18: Netherland Risk Analytics Industry Revenue (Million) Forecast, by Application 2019 & 2032
- Table 19: Nordics Risk Analytics Industry Revenue (Million) Forecast, by Application 2019 & 2032
- Table 20: Rest of Europe Risk Analytics Industry Revenue (Million) Forecast, by Application 2019 & 2032
- Table 21: Global Risk Analytics Industry Revenue Million Forecast, by Country 2019 & 2032
- Table 22: China Risk Analytics Industry Revenue (Million) Forecast, by Application 2019 & 2032
- Table 23: Japan Risk Analytics Industry Revenue (Million) Forecast, by Application 2019 & 2032
- Table 24: India Risk Analytics Industry Revenue (Million) Forecast, by Application 2019 & 2032
- Table 25: South Korea Risk Analytics Industry Revenue (Million) Forecast, by Application 2019 & 2032
- Table 26: Southeast Asia Risk Analytics Industry Revenue (Million) Forecast, by Application 2019 & 2032
- Table 27: Australia Risk Analytics Industry Revenue (Million) Forecast, by Application 2019 & 2032
- Table 28: Indonesia Risk Analytics Industry Revenue (Million) Forecast, by Application 2019 & 2032
- Table 29: Phillipes Risk Analytics Industry Revenue (Million) Forecast, by Application 2019 & 2032
- Table 30: Singapore Risk Analytics Industry Revenue (Million) Forecast, by Application 2019 & 2032
- Table 31: Thailandc Risk Analytics Industry Revenue (Million) Forecast, by Application 2019 & 2032
- Table 32: Rest of Asia Pacific Risk Analytics Industry Revenue (Million) Forecast, by Application 2019 & 2032
- Table 33: Global Risk Analytics Industry Revenue Million Forecast, by Country 2019 & 2032
- Table 34: Brazil Risk Analytics Industry Revenue (Million) Forecast, by Application 2019 & 2032
- Table 35: Argentina Risk Analytics Industry Revenue (Million) Forecast, by Application 2019 & 2032
- Table 36: Peru Risk Analytics Industry Revenue (Million) Forecast, by Application 2019 & 2032
- Table 37: Chile Risk Analytics Industry Revenue (Million) Forecast, by Application 2019 & 2032
- Table 38: Colombia Risk Analytics Industry Revenue (Million) Forecast, by Application 2019 & 2032
- Table 39: Ecuador Risk Analytics Industry Revenue (Million) Forecast, by Application 2019 & 2032
- Table 40: Venezuela Risk Analytics Industry Revenue (Million) Forecast, by Application 2019 & 2032
- Table 41: Rest of South America Risk Analytics Industry Revenue (Million) Forecast, by Application 2019 & 2032
- Table 42: Global Risk Analytics Industry Revenue Million Forecast, by Country 2019 & 2032
- Table 43: United States Risk Analytics Industry Revenue (Million) Forecast, by Application 2019 & 2032
- Table 44: Canada Risk Analytics Industry Revenue (Million) Forecast, by Application 2019 & 2032
- Table 45: Mexico Risk Analytics Industry Revenue (Million) Forecast, by Application 2019 & 2032
- Table 46: Global Risk Analytics Industry Revenue Million Forecast, by Country 2019 & 2032
- Table 47: United Arab Emirates Risk Analytics Industry Revenue (Million) Forecast, by Application 2019 & 2032
- Table 48: Saudi Arabia Risk Analytics Industry Revenue (Million) Forecast, by Application 2019 & 2032
- Table 49: South Africa Risk Analytics Industry Revenue (Million) Forecast, by Application 2019 & 2032
- Table 50: Rest of Middle East and Africa Risk Analytics Industry Revenue (Million) Forecast, by Application 2019 & 2032
- Table 51: Global Risk Analytics Industry Revenue Million Forecast, by Component 2019 & 2032
- Table 52: Global Risk Analytics Industry Revenue Million Forecast, by Deployment 2019 & 2032
- Table 53: Global Risk Analytics Industry Revenue Million Forecast, by End-user Vertical 2019 & 2032
- Table 54: Global Risk Analytics Industry Revenue Million Forecast, by Country 2019 & 2032
- Table 55: United States Risk Analytics Industry Revenue (Million) Forecast, by Application 2019 & 2032
- Table 56: Canada Risk Analytics Industry Revenue (Million) Forecast, by Application 2019 & 2032
- Table 57: Global Risk Analytics Industry Revenue Million Forecast, by Component 2019 & 2032
- Table 58: Global Risk Analytics Industry Revenue Million Forecast, by Deployment 2019 & 2032
- Table 59: Global Risk Analytics Industry Revenue Million Forecast, by End-user Vertical 2019 & 2032
- Table 60: Global Risk Analytics Industry Revenue Million Forecast, by Country 2019 & 2032
- Table 61: Germany Risk Analytics Industry Revenue (Million) Forecast, by Application 2019 & 2032
- Table 62: United Kingdom Risk Analytics Industry Revenue (Million) Forecast, by Application 2019 & 2032
- Table 63: France Risk Analytics Industry Revenue (Million) Forecast, by Application 2019 & 2032
- Table 64: Spain Risk Analytics Industry Revenue (Million) Forecast, by Application 2019 & 2032
- Table 65: Global Risk Analytics Industry Revenue Million Forecast, by Component 2019 & 2032
- Table 66: Global Risk Analytics Industry Revenue Million Forecast, by Deployment 2019 & 2032
- Table 67: Global Risk Analytics Industry Revenue Million Forecast, by End-user Vertical 2019 & 2032
- Table 68: Global Risk Analytics Industry Revenue Million Forecast, by Country 2019 & 2032
- Table 69: China Risk Analytics Industry Revenue (Million) Forecast, by Application 2019 & 2032
- Table 70: Japan Risk Analytics Industry Revenue (Million) Forecast, by Application 2019 & 2032
- Table 71: India Risk Analytics Industry Revenue (Million) Forecast, by Application 2019 & 2032
- Table 72: Australia and New Zealand Risk Analytics Industry Revenue (Million) Forecast, by Application 2019 & 2032
- Table 73: Global Risk Analytics Industry Revenue Million Forecast, by Component 2019 & 2032
- Table 74: Global Risk Analytics Industry Revenue Million Forecast, by Deployment 2019 & 2032
- Table 75: Global Risk Analytics Industry Revenue Million Forecast, by End-user Vertical 2019 & 2032
- Table 76: Global Risk Analytics Industry Revenue Million Forecast, by Country 2019 & 2032
- Table 77: Brazil Risk Analytics Industry Revenue (Million) Forecast, by Application 2019 & 2032
- Table 78: Mexico Risk Analytics Industry Revenue (Million) Forecast, by Application 2019 & 2032
- Table 79: Argentina Risk Analytics Industry Revenue (Million) Forecast, by Application 2019 & 2032
- Table 80: Global Risk Analytics Industry Revenue Million Forecast, by Component 2019 & 2032
- Table 81: Global Risk Analytics Industry Revenue Million Forecast, by Deployment 2019 & 2032
- Table 82: Global Risk Analytics Industry Revenue Million Forecast, by End-user Vertical 2019 & 2032
- Table 83: Global Risk Analytics Industry Revenue Million Forecast, by Country 2019 & 2032
- Table 84: United Arab Emirates Risk Analytics Industry Revenue (Million) Forecast, by Application 2019 & 2032
- Table 85: Saudi Arabia Risk Analytics Industry Revenue (Million) Forecast, by Application 2019 & 2032
- Table 86: South Africa Risk Analytics Industry Revenue (Million) Forecast, by Application 2019 & 2032
Frequently Asked Questions
1. What is the projected Compound Annual Growth Rate (CAGR) of the Risk Analytics Industry?
The projected CAGR is approximately 12.84%.
2. Which companies are prominent players in the Risk Analytics Industry?
Key companies in the market include SAS Institute Inc, Accenture PLC, Risk Edge Solutions, IBM Corporation, Capgemini SE, Adenza Group Inc (AxiomSL Ltd ), Provenir Inc, OneSpan Inc, Oracle Corporation, Moody's Analytics Inc, SAP SE.
3. What are the main segments of the Risk Analytics Industry?
The market segments include Component, Deployment, End-user Vertical.
4. Can you provide details about the market size?
The market size is estimated to be USD 47.48 Million as of 2022.
5. What are some drivers contributing to market growth?
Growing Complexities across Business Processes; Global Regulatory Frameworks and Government Policies.
6. What are the notable trends driving market growth?
BFSI is Expected to Witness Huge Adoption of Risk Analytics Solutions.
7. Are there any restraints impacting market growth?
High Installation and Operational Costs; Complicated Regulatory Compliance might hinder the Market Growth.
8. Can you provide examples of recent developments in the market?
November 2023 - SimCorp, a Denmark-based software company, announced it will merge with Axioma, a global supplier of multi-asset class enterprise risk solutions, factor risk models, and tools for building portfolios. This dynamic, front-to-back platform remains crucial due to the combined strength of Axioma and SimCorp. As its primary growth market, SimCorp's merger with Axioma strengthens its position in significant regions like North America.
9. What pricing options are available for accessing the report?
Pricing options include single-user, multi-user, and enterprise licenses priced at USD 4750, USD 5250, and USD 8750 respectively.
10. Is the market size provided in terms of value or volume?
The market size is provided in terms of value, measured in Million.
11. Are there any specific market keywords associated with the report?
Yes, the market keyword associated with the report is "Risk Analytics Industry," which aids in identifying and referencing the specific market segment covered.
12. How do I determine which pricing option suits my needs best?
The pricing options vary based on user requirements and access needs. Individual users may opt for single-user licenses, while businesses requiring broader access may choose multi-user or enterprise licenses for cost-effective access to the report.
13. Are there any additional resources or data provided in the Risk Analytics Industry report?
While the report offers comprehensive insights, it's advisable to review the specific contents or supplementary materials provided to ascertain if additional resources or data are available.
14. How can I stay updated on further developments or reports in the Risk Analytics Industry?
To stay informed about further developments, trends, and reports in the Risk Analytics Industry, consider subscribing to industry newsletters, following relevant companies and organizations, or regularly checking reputable industry news sources and publications.
Methodology
Step 1 - Identification of Relevant Samples Size from Population Database


Step 2 - Approaches for Defining Global Market Size (Value, Volume* & Price*)

Note*: In applicable scenarios
Step 3 - Data Sources
Primary Research
- Web Analytics
- Survey Reports
- Research Institute
- Latest Research Reports
- Opinion Leaders
Secondary Research
- Annual Reports
- White Paper
- Latest Press Release
- Industry Association
- Paid Database
- Investor Presentations

Step 4 - Data Triangulation
Involves using different sources of information in order to increase the validity of a study
These sources are likely to be stakeholders in a program - participants, other researchers, program staff, other community members, and so on.
Then we put all data in single framework & apply various statistical tools to find out the dynamic on the market.
During the analysis stage, feedback from the stakeholder groups would be compared to determine areas of agreement as well as areas of divergence


