
Key Insights
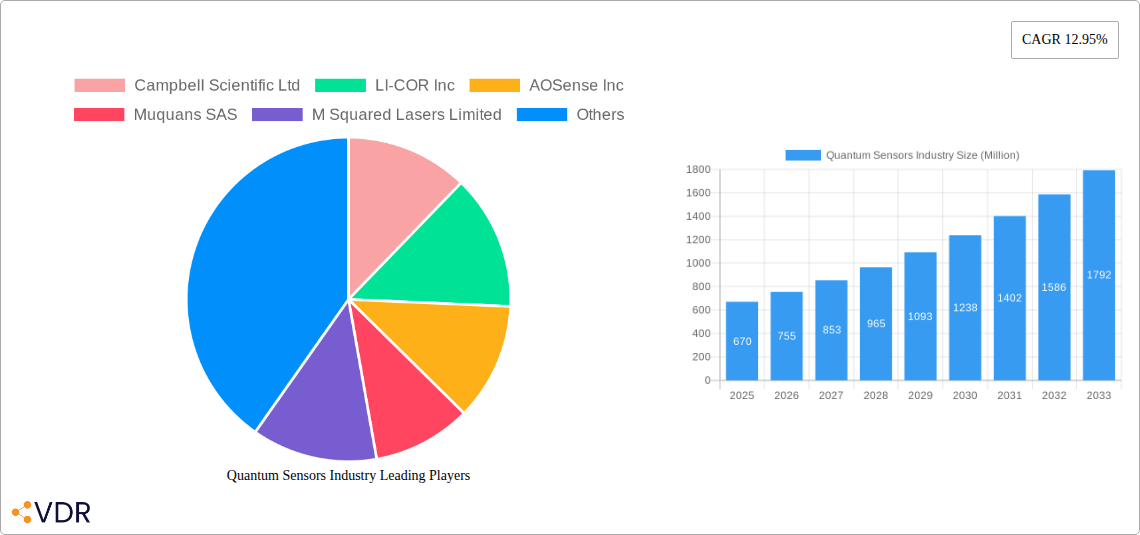
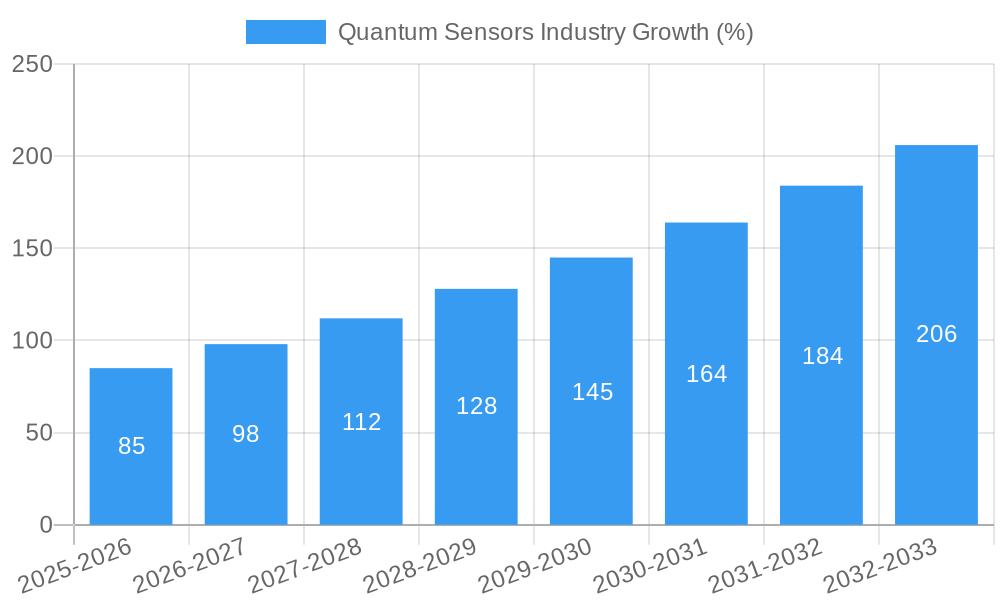
The Quantum Sensors market, currently valued at $0.67 billion in 2025, is projected to experience robust growth, driven by increasing demand across diverse sectors. A Compound Annual Growth Rate (CAGR) of 12.95% from 2025 to 2033 indicates a significant expansion of the market. Key drivers include advancements in quantum technologies leading to higher sensitivity and accuracy in sensor measurements, the rising adoption of quantum sensors in defense applications (navigation, surveillance, and target acquisition), and the growing need for precise measurements in the automotive industry (autonomous driving and advanced driver-assistance systems). Furthermore, the exploration of quantum sensing applications in healthcare (medical imaging and diagnostics) and the oil and gas industry (enhanced exploration and production techniques) fuels market expansion. While technological complexities and high initial investment costs pose some restraints, the ongoing research and development efforts aimed at reducing costs and improving the accessibility of quantum sensors are mitigating these challenges. The market segmentation by product type (atomic clocks, magnetic sensors, PAR quantum sensors, gravity sensors, and others) and application (military and defense, automotive, oil and gas, healthcare, and others) reveals a diverse and dynamic landscape with considerable potential for future growth.
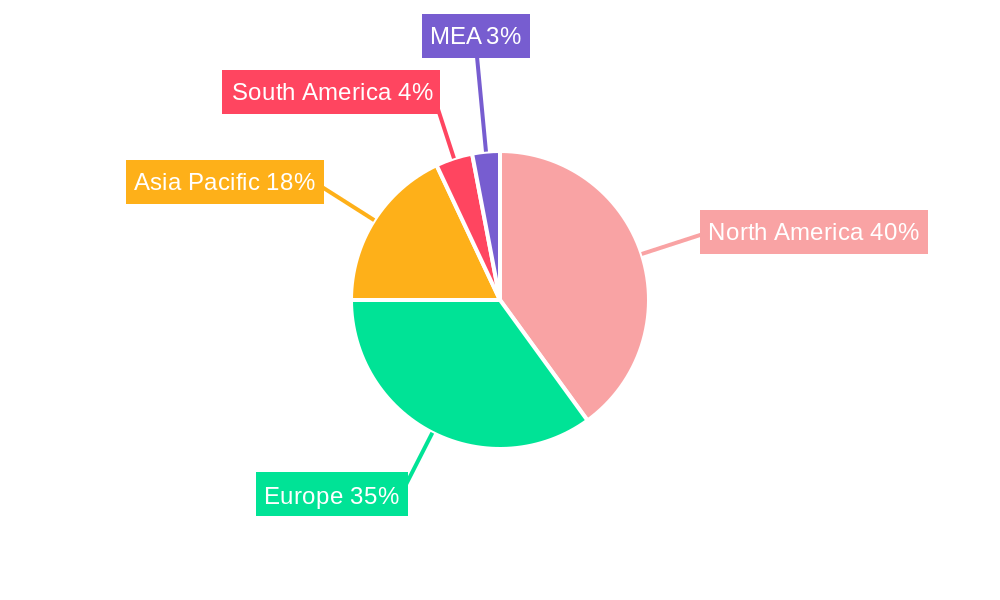
The geographical distribution of the Quantum Sensors market shows a concentration in North America and Europe, driven by substantial investments in R&D and early adoption of advanced technologies. However, the Asia-Pacific region is anticipated to witness the fastest growth in the coming years due to increasing industrialization, technological advancements, and the growing presence of key market players. This growth trajectory is expected to be further accelerated by government initiatives supporting technological innovation and substantial investments in infrastructure development. The competitive landscape comprises a mix of established players and emerging companies, reflecting a dynamic and innovative market with ample opportunities for both established and new entrants. This necessitates a strategic approach for players seeking to capitalize on the significant potential of this rapidly evolving market.
Quantum Sensors Industry Market Report: 2019-2033
This comprehensive report provides an in-depth analysis of the Quantum Sensors industry, encompassing market dynamics, growth trends, regional dominance, product landscape, and key players. The study period covers 2019-2033, with 2025 as the base and estimated year. This report is invaluable for industry professionals, investors, and researchers seeking to understand and capitalize on the burgeoning opportunities within this transformative sector. The market is segmented by product type (Atomic Clocks, Magnetic Sensors, PAR Quantum Sensors, Gravity Sensors, Other Product Types) and application (Military and Defense, Automotive, Oil and Gas, Healthcare, Other Applications).
Quantum Sensors Industry Market Dynamics & Structure
The Quantum Sensors market is characterized by moderate concentration, with several key players vying for market share. Technological innovation, particularly in areas like atomic clocks and magnetic sensors, is a primary growth driver. Stringent regulatory frameworks, especially concerning defense applications, influence market development. Competitive substitutes, such as traditional sensor technologies, pose challenges but also drive innovation. The end-user demographics are diverse, spanning military, automotive, healthcare, and oil & gas sectors. M&A activity is expected to increase as companies seek to consolidate their market positions and expand technological capabilities.
- Market Concentration: Moderately concentrated, with top 5 players holding an estimated xx% market share in 2025.
- Technological Innovation: Significant advancements in atomic clocks and magnetic field sensors are key drivers.
- Regulatory Landscape: Stringent regulations in defense and healthcare sectors shape market access.
- Competitive Substitutes: Traditional sensor technologies present competitive pressure, but also stimulate innovation in quantum sensing.
- M&A Activity: Projected increase in M&A deals driven by expansion and technological consolidation, with an estimated xx deals expected between 2025-2033.
- End-User Demographics: Diverse end-user base including Military & Defence, Automotive, Healthcare, and Oil & Gas.
Quantum Sensors Industry Growth Trends & Insights
The Quantum Sensors market is experiencing robust growth, driven by increasing demand across various sectors. The market size is projected to reach xx million units by 2033, exhibiting a CAGR of xx% during the forecast period (2025-2033). This growth is fueled by technological advancements leading to improved sensor accuracy, sensitivity, and miniaturization. Adoption rates are accelerating, particularly in high-precision applications. Consumer behavior shifts towards enhanced data accuracy and reliability are also bolstering market growth. Technological disruptions, such as the development of more robust and cost-effective quantum sensors, will continue to shape market dynamics. Market penetration in emerging applications will continue to rise, driven by the increasing need for accurate measurements across numerous industry verticals.
Dominant Regions, Countries, or Segments in Quantum Sensors Industry
The North American region is currently the dominant market for quantum sensors, driven by significant R&D investments and the strong presence of key players. Within this, the Military and Defense segment is the fastest-growing application area due to the high demand for advanced sensor technologies. However, the Asian market is experiencing rapid growth, especially in countries like China and Japan, which are investing heavily in quantum technology development.
- North America: Dominant region due to high R&D expenditure and presence of major companies. Strong growth in Military & Defence applications.
- Europe: Significant market presence, particularly in Germany and France, focused on industrial and automotive applications.
- Asia-Pacific: Rapid growth driven by investments in quantum technology, particularly in China and Japan.
- Other Regions: Developing markets presenting untapped growth opportunities.
The Atomic Clocks segment holds the largest market share due to its critical role in various applications. The Magnetic Sensors segment is also experiencing strong growth, particularly in healthcare and automotive applications. The growth of the Automotive segment is notably significant given the rise of autonomous driving and advanced driver-assistance systems (ADAS).
Quantum Sensors Industry Product Landscape
Quantum sensors encompass a range of product types, including atomic clocks offering superior timekeeping accuracy, magnetic sensors providing highly sensitive magnetic field measurements, and PAR quantum sensors used in photosynthesis research. Gravity sensors deliver precise gravitational field measurements, with each type exhibiting distinct advantages across diverse applications. Ongoing advancements lead to miniaturization, increased sensitivity, and lower power consumption, broadening their market appeal and fostering wider adoption across various sectors. Unique selling propositions include unparalleled precision, improved sensitivity, and enhanced stability compared to traditional sensor technologies.
Key Drivers, Barriers & Challenges in Quantum Sensors Industry
Key Drivers:
- Technological advancements: Improved accuracy, miniaturization, and reduced cost of quantum sensors.
- Increased demand: Growing need for high-precision measurements in diverse sectors (military, healthcare, automotive).
- Government funding: Significant investments in quantum technology R&D from governments worldwide (e.g., US National Science Foundation investment).
Challenges:
- High initial cost: Quantum sensors are currently expensive to manufacture compared to classical alternatives.
- Technical complexity: Design, manufacturing, and operation require advanced expertise.
- Supply chain limitations: Limited access to certain materials necessary for sensor construction, resulting in supply chain vulnerabilities.
Emerging Opportunities in Quantum Sensors Industry
Emerging opportunities lie in the development of integrated quantum sensor systems, incorporating multiple sensor types for enhanced functionality. Untapped markets include environmental monitoring, precision agriculture, and advanced materials research. Innovative applications, such as quantum-based medical imaging, are expected to drive growth.
Growth Accelerators in the Quantum Sensors Industry
Strategic partnerships between technology developers and end-users are accelerating market growth. Technological breakthroughs, such as the development of more robust and compact quantum sensors, are expanding their range of applications. Market expansion into new geographical regions and sectors is further fueled by growing government support and private investment in quantum technology.
Key Players Shaping the Quantum Sensors Industry Market
- Campbell Scientific Ltd
- LI-COR Inc
- AOSense Inc
- Muquans SAS
- M Squared Lasers Limited
- Skye Instruments Ltd
- Robert Bosch GmbH
- Apogee Instrument Inc
Notable Milestones in Quantum Sensors Industry Sector
- April 2024: The US National Science Foundation invested USD 29 million in quantum sensing research across US universities, boosting technological advancements.
- January 2024: Brazil announced a new industrial policy aiming to improve technology development and competitiveness, potentially fostering growth in the quantum sensors sector.
In-Depth Quantum Sensors Industry Market Outlook
The future of the quantum sensors market is exceptionally promising. Continued technological advancements, increased funding for R&D, and expanding applications across various sectors will fuel substantial market growth. Strategic partnerships and investments will enable the development of more efficient, cost-effective quantum sensors, making them more accessible and fostering wider adoption. This will lead to substantial market expansion and the creation of innovative applications within a wide array of industries.
Quantum Sensors Industry Segmentation
-
1. Product Type
- 1.1. Atomic Clocks
- 1.2. Magnetic Sensors
- 1.3. PAR Quantum Sensors
- 1.4. Gravity Sensors
- 1.5. Other Product Types
-
2. Application
- 2.1. Military and Defense
- 2.2. Automotive
- 2.3. Oil and Gas
- 2.4. Healthcare
- 2.5. Other Applications
Quantum Sensors Industry Segmentation By Geography
-
1. North America
- 1.1. United States
- 1.2. Canada
- 1.3. Mexico
-
2. Europe
- 2.1. Germany
- 2.2. United Kingdom
- 2.3. France
- 2.4. Italy
- 2.5. Spain
- 2.6. Rest of Europe
-
3. Asia
- 3.1. China
- 3.2. Japan
- 3.3. India
- 3.4. Australia
- 3.5. South Korea
- 3.6. Rest of Asia Pacific
-
4. Middle East and Africa
- 4.1. UAE
- 4.2. South Africa
- 4.3. Saudi Arabia
- 4.4. Rest Of MEA
-
5. Latin America
- 5.1. Brazil
- 5.2. Argentina
- 5.3. Rest of South America
Quantum Sensors Industry REPORT HIGHLIGHTS
| Aspects | Details |
|---|---|
| Study Period | 2019-2033 |
| Base Year | 2024 |
| Estimated Year | 2025 |
| Forecast Period | 2025-2033 |
| Historical Period | 2019-2024 |
| Growth Rate | CAGR of 12.95% from 2019-2033 |
| Segmentation |
|
Table of Contents
- 1. Introduction
- 1.1. Research Scope
- 1.2. Market Segmentation
- 1.3. Research Methodology
- 1.4. Definitions and Assumptions
- 2. Executive Summary
- 2.1. Introduction
- 3. Market Dynamics
- 3.1. Introduction
- 3.2. Market Drivers
- 3.2.1. Increasing Research Activities in the Quantum Field; Increasing Investment in Space Communication
- 3.3. Market Restrains
- 3.3.1. High Deployment and Maintenance Costs
- 3.4. Market Trends
- 3.4.1. Oil and Gas Industry to Grow Significantly
- 4. Market Factor Analysis
- 4.1. Porters Five Forces
- 4.2. Supply/Value Chain
- 4.3. PESTEL analysis
- 4.4. Market Entropy
- 4.5. Patent/Trademark Analysis
- 5. Global Quantum Sensors Industry Analysis, Insights and Forecast, 2019-2031
- 5.1. Market Analysis, Insights and Forecast - by Product Type
- 5.1.1. Atomic Clocks
- 5.1.2. Magnetic Sensors
- 5.1.3. PAR Quantum Sensors
- 5.1.4. Gravity Sensors
- 5.1.5. Other Product Types
- 5.2. Market Analysis, Insights and Forecast - by Application
- 5.2.1. Military and Defense
- 5.2.2. Automotive
- 5.2.3. Oil and Gas
- 5.2.4. Healthcare
- 5.2.5. Other Applications
- 5.3. Market Analysis, Insights and Forecast - by Region
- 5.3.1. North America
- 5.3.2. Europe
- 5.3.3. Asia
- 5.3.4. Middle East and Africa
- 5.3.5. Latin America
- 5.1. Market Analysis, Insights and Forecast - by Product Type
- 6. North America Quantum Sensors Industry Analysis, Insights and Forecast, 2019-2031
- 6.1. Market Analysis, Insights and Forecast - by Product Type
- 6.1.1. Atomic Clocks
- 6.1.2. Magnetic Sensors
- 6.1.3. PAR Quantum Sensors
- 6.1.4. Gravity Sensors
- 6.1.5. Other Product Types
- 6.2. Market Analysis, Insights and Forecast - by Application
- 6.2.1. Military and Defense
- 6.2.2. Automotive
- 6.2.3. Oil and Gas
- 6.2.4. Healthcare
- 6.2.5. Other Applications
- 6.1. Market Analysis, Insights and Forecast - by Product Type
- 7. Europe Quantum Sensors Industry Analysis, Insights and Forecast, 2019-2031
- 7.1. Market Analysis, Insights and Forecast - by Product Type
- 7.1.1. Atomic Clocks
- 7.1.2. Magnetic Sensors
- 7.1.3. PAR Quantum Sensors
- 7.1.4. Gravity Sensors
- 7.1.5. Other Product Types
- 7.2. Market Analysis, Insights and Forecast - by Application
- 7.2.1. Military and Defense
- 7.2.2. Automotive
- 7.2.3. Oil and Gas
- 7.2.4. Healthcare
- 7.2.5. Other Applications
- 7.1. Market Analysis, Insights and Forecast - by Product Type
- 8. Asia Quantum Sensors Industry Analysis, Insights and Forecast, 2019-2031
- 8.1. Market Analysis, Insights and Forecast - by Product Type
- 8.1.1. Atomic Clocks
- 8.1.2. Magnetic Sensors
- 8.1.3. PAR Quantum Sensors
- 8.1.4. Gravity Sensors
- 8.1.5. Other Product Types
- 8.2. Market Analysis, Insights and Forecast - by Application
- 8.2.1. Military and Defense
- 8.2.2. Automotive
- 8.2.3. Oil and Gas
- 8.2.4. Healthcare
- 8.2.5. Other Applications
- 8.1. Market Analysis, Insights and Forecast - by Product Type
- 9. Middle East and Africa Quantum Sensors Industry Analysis, Insights and Forecast, 2019-2031
- 9.1. Market Analysis, Insights and Forecast - by Product Type
- 9.1.1. Atomic Clocks
- 9.1.2. Magnetic Sensors
- 9.1.3. PAR Quantum Sensors
- 9.1.4. Gravity Sensors
- 9.1.5. Other Product Types
- 9.2. Market Analysis, Insights and Forecast - by Application
- 9.2.1. Military and Defense
- 9.2.2. Automotive
- 9.2.3. Oil and Gas
- 9.2.4. Healthcare
- 9.2.5. Other Applications
- 9.1. Market Analysis, Insights and Forecast - by Product Type
- 10. Latin America Quantum Sensors Industry Analysis, Insights and Forecast, 2019-2031
- 10.1. Market Analysis, Insights and Forecast - by Product Type
- 10.1.1. Atomic Clocks
- 10.1.2. Magnetic Sensors
- 10.1.3. PAR Quantum Sensors
- 10.1.4. Gravity Sensors
- 10.1.5. Other Product Types
- 10.2. Market Analysis, Insights and Forecast - by Application
- 10.2.1. Military and Defense
- 10.2.2. Automotive
- 10.2.3. Oil and Gas
- 10.2.4. Healthcare
- 10.2.5. Other Applications
- 10.1. Market Analysis, Insights and Forecast - by Product Type
- 11. North America Quantum Sensors Industry Analysis, Insights and Forecast, 2019-2031
- 11.1. Market Analysis, Insights and Forecast - By Country/Sub-region
- 11.1.1 United States
- 11.1.2 Canada
- 11.1.3 Mexico
- 12. Europe Quantum Sensors Industry Analysis, Insights and Forecast, 2019-2031
- 12.1. Market Analysis, Insights and Forecast - By Country/Sub-region
- 12.1.1 Germany
- 12.1.2 United Kingdom
- 12.1.3 France
- 12.1.4 Spain
- 12.1.5 Italy
- 12.1.6 Spain
- 12.1.7 Belgium
- 12.1.8 Netherland
- 12.1.9 Nordics
- 12.1.10 Rest of Europe
- 13. Asia Pacific Quantum Sensors Industry Analysis, Insights and Forecast, 2019-2031
- 13.1. Market Analysis, Insights and Forecast - By Country/Sub-region
- 13.1.1 China
- 13.1.2 Japan
- 13.1.3 India
- 13.1.4 South Korea
- 13.1.5 Southeast Asia
- 13.1.6 Australia
- 13.1.7 Indonesia
- 13.1.8 Phillipes
- 13.1.9 Singapore
- 13.1.10 Thailandc
- 13.1.11 Rest of Asia Pacific
- 14. South America Quantum Sensors Industry Analysis, Insights and Forecast, 2019-2031
- 14.1. Market Analysis, Insights and Forecast - By Country/Sub-region
- 14.1.1 Brazil
- 14.1.2 Argentina
- 14.1.3 Peru
- 14.1.4 Chile
- 14.1.5 Colombia
- 14.1.6 Ecuador
- 14.1.7 Venezuela
- 14.1.8 Rest of South America
- 15. North America Quantum Sensors Industry Analysis, Insights and Forecast, 2019-2031
- 15.1. Market Analysis, Insights and Forecast - By Country/Sub-region
- 15.1.1 United States
- 15.1.2 Canada
- 15.1.3 Mexico
- 16. MEA Quantum Sensors Industry Analysis, Insights and Forecast, 2019-2031
- 16.1. Market Analysis, Insights and Forecast - By Country/Sub-region
- 16.1.1 United Arab Emirates
- 16.1.2 Saudi Arabia
- 16.1.3 South Africa
- 16.1.4 Rest of Middle East and Africa
- 17. Competitive Analysis
- 17.1. Global Market Share Analysis 2024
- 17.2. Company Profiles
- 17.2.1 Campbell Scientific Ltd
- 17.2.1.1. Overview
- 17.2.1.2. Products
- 17.2.1.3. SWOT Analysis
- 17.2.1.4. Recent Developments
- 17.2.1.5. Financials (Based on Availability)
- 17.2.2 LI-COR Inc
- 17.2.2.1. Overview
- 17.2.2.2. Products
- 17.2.2.3. SWOT Analysis
- 17.2.2.4. Recent Developments
- 17.2.2.5. Financials (Based on Availability)
- 17.2.3 AOSense Inc
- 17.2.3.1. Overview
- 17.2.3.2. Products
- 17.2.3.3. SWOT Analysis
- 17.2.3.4. Recent Developments
- 17.2.3.5. Financials (Based on Availability)
- 17.2.4 Muquans SAS
- 17.2.4.1. Overview
- 17.2.4.2. Products
- 17.2.4.3. SWOT Analysis
- 17.2.4.4. Recent Developments
- 17.2.4.5. Financials (Based on Availability)
- 17.2.5 M Squared Lasers Limited
- 17.2.5.1. Overview
- 17.2.5.2. Products
- 17.2.5.3. SWOT Analysis
- 17.2.5.4. Recent Developments
- 17.2.5.5. Financials (Based on Availability)
- 17.2.6 Skye Instruments Ltd
- 17.2.6.1. Overview
- 17.2.6.2. Products
- 17.2.6.3. SWOT Analysis
- 17.2.6.4. Recent Developments
- 17.2.6.5. Financials (Based on Availability)
- 17.2.7 Robert Bosch GmbH
- 17.2.7.1. Overview
- 17.2.7.2. Products
- 17.2.7.3. SWOT Analysis
- 17.2.7.4. Recent Developments
- 17.2.7.5. Financials (Based on Availability)
- 17.2.8 Apogee Instrument Inc
- 17.2.8.1. Overview
- 17.2.8.2. Products
- 17.2.8.3. SWOT Analysis
- 17.2.8.4. Recent Developments
- 17.2.8.5. Financials (Based on Availability)
- 17.2.1 Campbell Scientific Ltd
List of Figures
- Figure 1: Global Quantum Sensors Industry Revenue Breakdown (Million, %) by Region 2024 & 2032
- Figure 2: Global Quantum Sensors Industry Volume Breakdown (K Unit, %) by Region 2024 & 2032
- Figure 3: North America Quantum Sensors Industry Revenue (Million), by Country 2024 & 2032
- Figure 4: North America Quantum Sensors Industry Volume (K Unit), by Country 2024 & 2032
- Figure 5: North America Quantum Sensors Industry Revenue Share (%), by Country 2024 & 2032
- Figure 6: North America Quantum Sensors Industry Volume Share (%), by Country 2024 & 2032
- Figure 7: Europe Quantum Sensors Industry Revenue (Million), by Country 2024 & 2032
- Figure 8: Europe Quantum Sensors Industry Volume (K Unit), by Country 2024 & 2032
- Figure 9: Europe Quantum Sensors Industry Revenue Share (%), by Country 2024 & 2032
- Figure 10: Europe Quantum Sensors Industry Volume Share (%), by Country 2024 & 2032
- Figure 11: Asia Pacific Quantum Sensors Industry Revenue (Million), by Country 2024 & 2032
- Figure 12: Asia Pacific Quantum Sensors Industry Volume (K Unit), by Country 2024 & 2032
- Figure 13: Asia Pacific Quantum Sensors Industry Revenue Share (%), by Country 2024 & 2032
- Figure 14: Asia Pacific Quantum Sensors Industry Volume Share (%), by Country 2024 & 2032
- Figure 15: South America Quantum Sensors Industry Revenue (Million), by Country 2024 & 2032
- Figure 16: South America Quantum Sensors Industry Volume (K Unit), by Country 2024 & 2032
- Figure 17: South America Quantum Sensors Industry Revenue Share (%), by Country 2024 & 2032
- Figure 18: South America Quantum Sensors Industry Volume Share (%), by Country 2024 & 2032
- Figure 19: North America Quantum Sensors Industry Revenue (Million), by Country 2024 & 2032
- Figure 20: North America Quantum Sensors Industry Volume (K Unit), by Country 2024 & 2032
- Figure 21: North America Quantum Sensors Industry Revenue Share (%), by Country 2024 & 2032
- Figure 22: North America Quantum Sensors Industry Volume Share (%), by Country 2024 & 2032
- Figure 23: MEA Quantum Sensors Industry Revenue (Million), by Country 2024 & 2032
- Figure 24: MEA Quantum Sensors Industry Volume (K Unit), by Country 2024 & 2032
- Figure 25: MEA Quantum Sensors Industry Revenue Share (%), by Country 2024 & 2032
- Figure 26: MEA Quantum Sensors Industry Volume Share (%), by Country 2024 & 2032
- Figure 27: North America Quantum Sensors Industry Revenue (Million), by Product Type 2024 & 2032
- Figure 28: North America Quantum Sensors Industry Volume (K Unit), by Product Type 2024 & 2032
- Figure 29: North America Quantum Sensors Industry Revenue Share (%), by Product Type 2024 & 2032
- Figure 30: North America Quantum Sensors Industry Volume Share (%), by Product Type 2024 & 2032
- Figure 31: North America Quantum Sensors Industry Revenue (Million), by Application 2024 & 2032
- Figure 32: North America Quantum Sensors Industry Volume (K Unit), by Application 2024 & 2032
- Figure 33: North America Quantum Sensors Industry Revenue Share (%), by Application 2024 & 2032
- Figure 34: North America Quantum Sensors Industry Volume Share (%), by Application 2024 & 2032
- Figure 35: North America Quantum Sensors Industry Revenue (Million), by Country 2024 & 2032
- Figure 36: North America Quantum Sensors Industry Volume (K Unit), by Country 2024 & 2032
- Figure 37: North America Quantum Sensors Industry Revenue Share (%), by Country 2024 & 2032
- Figure 38: North America Quantum Sensors Industry Volume Share (%), by Country 2024 & 2032
- Figure 39: Europe Quantum Sensors Industry Revenue (Million), by Product Type 2024 & 2032
- Figure 40: Europe Quantum Sensors Industry Volume (K Unit), by Product Type 2024 & 2032
- Figure 41: Europe Quantum Sensors Industry Revenue Share (%), by Product Type 2024 & 2032
- Figure 42: Europe Quantum Sensors Industry Volume Share (%), by Product Type 2024 & 2032
- Figure 43: Europe Quantum Sensors Industry Revenue (Million), by Application 2024 & 2032
- Figure 44: Europe Quantum Sensors Industry Volume (K Unit), by Application 2024 & 2032
- Figure 45: Europe Quantum Sensors Industry Revenue Share (%), by Application 2024 & 2032
- Figure 46: Europe Quantum Sensors Industry Volume Share (%), by Application 2024 & 2032
- Figure 47: Europe Quantum Sensors Industry Revenue (Million), by Country 2024 & 2032
- Figure 48: Europe Quantum Sensors Industry Volume (K Unit), by Country 2024 & 2032
- Figure 49: Europe Quantum Sensors Industry Revenue Share (%), by Country 2024 & 2032
- Figure 50: Europe Quantum Sensors Industry Volume Share (%), by Country 2024 & 2032
- Figure 51: Asia Quantum Sensors Industry Revenue (Million), by Product Type 2024 & 2032
- Figure 52: Asia Quantum Sensors Industry Volume (K Unit), by Product Type 2024 & 2032
- Figure 53: Asia Quantum Sensors Industry Revenue Share (%), by Product Type 2024 & 2032
- Figure 54: Asia Quantum Sensors Industry Volume Share (%), by Product Type 2024 & 2032
- Figure 55: Asia Quantum Sensors Industry Revenue (Million), by Application 2024 & 2032
- Figure 56: Asia Quantum Sensors Industry Volume (K Unit), by Application 2024 & 2032
- Figure 57: Asia Quantum Sensors Industry Revenue Share (%), by Application 2024 & 2032
- Figure 58: Asia Quantum Sensors Industry Volume Share (%), by Application 2024 & 2032
- Figure 59: Asia Quantum Sensors Industry Revenue (Million), by Country 2024 & 2032
- Figure 60: Asia Quantum Sensors Industry Volume (K Unit), by Country 2024 & 2032
- Figure 61: Asia Quantum Sensors Industry Revenue Share (%), by Country 2024 & 2032
- Figure 62: Asia Quantum Sensors Industry Volume Share (%), by Country 2024 & 2032
- Figure 63: Middle East and Africa Quantum Sensors Industry Revenue (Million), by Product Type 2024 & 2032
- Figure 64: Middle East and Africa Quantum Sensors Industry Volume (K Unit), by Product Type 2024 & 2032
- Figure 65: Middle East and Africa Quantum Sensors Industry Revenue Share (%), by Product Type 2024 & 2032
- Figure 66: Middle East and Africa Quantum Sensors Industry Volume Share (%), by Product Type 2024 & 2032
- Figure 67: Middle East and Africa Quantum Sensors Industry Revenue (Million), by Application 2024 & 2032
- Figure 68: Middle East and Africa Quantum Sensors Industry Volume (K Unit), by Application 2024 & 2032
- Figure 69: Middle East and Africa Quantum Sensors Industry Revenue Share (%), by Application 2024 & 2032
- Figure 70: Middle East and Africa Quantum Sensors Industry Volume Share (%), by Application 2024 & 2032
- Figure 71: Middle East and Africa Quantum Sensors Industry Revenue (Million), by Country 2024 & 2032
- Figure 72: Middle East and Africa Quantum Sensors Industry Volume (K Unit), by Country 2024 & 2032
- Figure 73: Middle East and Africa Quantum Sensors Industry Revenue Share (%), by Country 2024 & 2032
- Figure 74: Middle East and Africa Quantum Sensors Industry Volume Share (%), by Country 2024 & 2032
- Figure 75: Latin America Quantum Sensors Industry Revenue (Million), by Product Type 2024 & 2032
- Figure 76: Latin America Quantum Sensors Industry Volume (K Unit), by Product Type 2024 & 2032
- Figure 77: Latin America Quantum Sensors Industry Revenue Share (%), by Product Type 2024 & 2032
- Figure 78: Latin America Quantum Sensors Industry Volume Share (%), by Product Type 2024 & 2032
- Figure 79: Latin America Quantum Sensors Industry Revenue (Million), by Application 2024 & 2032
- Figure 80: Latin America Quantum Sensors Industry Volume (K Unit), by Application 2024 & 2032
- Figure 81: Latin America Quantum Sensors Industry Revenue Share (%), by Application 2024 & 2032
- Figure 82: Latin America Quantum Sensors Industry Volume Share (%), by Application 2024 & 2032
- Figure 83: Latin America Quantum Sensors Industry Revenue (Million), by Country 2024 & 2032
- Figure 84: Latin America Quantum Sensors Industry Volume (K Unit), by Country 2024 & 2032
- Figure 85: Latin America Quantum Sensors Industry Revenue Share (%), by Country 2024 & 2032
- Figure 86: Latin America Quantum Sensors Industry Volume Share (%), by Country 2024 & 2032
List of Tables
- Table 1: Global Quantum Sensors Industry Revenue Million Forecast, by Region 2019 & 2032
- Table 2: Global Quantum Sensors Industry Volume K Unit Forecast, by Region 2019 & 2032
- Table 3: Global Quantum Sensors Industry Revenue Million Forecast, by Product Type 2019 & 2032
- Table 4: Global Quantum Sensors Industry Volume K Unit Forecast, by Product Type 2019 & 2032
- Table 5: Global Quantum Sensors Industry Revenue Million Forecast, by Application 2019 & 2032
- Table 6: Global Quantum Sensors Industry Volume K Unit Forecast, by Application 2019 & 2032
- Table 7: Global Quantum Sensors Industry Revenue Million Forecast, by Region 2019 & 2032
- Table 8: Global Quantum Sensors Industry Volume K Unit Forecast, by Region 2019 & 2032
- Table 9: Global Quantum Sensors Industry Revenue Million Forecast, by Country 2019 & 2032
- Table 10: Global Quantum Sensors Industry Volume K Unit Forecast, by Country 2019 & 2032
- Table 11: United States Quantum Sensors Industry Revenue (Million) Forecast, by Application 2019 & 2032
- Table 12: United States Quantum Sensors Industry Volume (K Unit) Forecast, by Application 2019 & 2032
- Table 13: Canada Quantum Sensors Industry Revenue (Million) Forecast, by Application 2019 & 2032
- Table 14: Canada Quantum Sensors Industry Volume (K Unit) Forecast, by Application 2019 & 2032
- Table 15: Mexico Quantum Sensors Industry Revenue (Million) Forecast, by Application 2019 & 2032
- Table 16: Mexico Quantum Sensors Industry Volume (K Unit) Forecast, by Application 2019 & 2032
- Table 17: Global Quantum Sensors Industry Revenue Million Forecast, by Country 2019 & 2032
- Table 18: Global Quantum Sensors Industry Volume K Unit Forecast, by Country 2019 & 2032
- Table 19: Germany Quantum Sensors Industry Revenue (Million) Forecast, by Application 2019 & 2032
- Table 20: Germany Quantum Sensors Industry Volume (K Unit) Forecast, by Application 2019 & 2032
- Table 21: United Kingdom Quantum Sensors Industry Revenue (Million) Forecast, by Application 2019 & 2032
- Table 22: United Kingdom Quantum Sensors Industry Volume (K Unit) Forecast, by Application 2019 & 2032
- Table 23: France Quantum Sensors Industry Revenue (Million) Forecast, by Application 2019 & 2032
- Table 24: France Quantum Sensors Industry Volume (K Unit) Forecast, by Application 2019 & 2032
- Table 25: Spain Quantum Sensors Industry Revenue (Million) Forecast, by Application 2019 & 2032
- Table 26: Spain Quantum Sensors Industry Volume (K Unit) Forecast, by Application 2019 & 2032
- Table 27: Italy Quantum Sensors Industry Revenue (Million) Forecast, by Application 2019 & 2032
- Table 28: Italy Quantum Sensors Industry Volume (K Unit) Forecast, by Application 2019 & 2032
- Table 29: Spain Quantum Sensors Industry Revenue (Million) Forecast, by Application 2019 & 2032
- Table 30: Spain Quantum Sensors Industry Volume (K Unit) Forecast, by Application 2019 & 2032
- Table 31: Belgium Quantum Sensors Industry Revenue (Million) Forecast, by Application 2019 & 2032
- Table 32: Belgium Quantum Sensors Industry Volume (K Unit) Forecast, by Application 2019 & 2032
- Table 33: Netherland Quantum Sensors Industry Revenue (Million) Forecast, by Application 2019 & 2032
- Table 34: Netherland Quantum Sensors Industry Volume (K Unit) Forecast, by Application 2019 & 2032
- Table 35: Nordics Quantum Sensors Industry Revenue (Million) Forecast, by Application 2019 & 2032
- Table 36: Nordics Quantum Sensors Industry Volume (K Unit) Forecast, by Application 2019 & 2032
- Table 37: Rest of Europe Quantum Sensors Industry Revenue (Million) Forecast, by Application 2019 & 2032
- Table 38: Rest of Europe Quantum Sensors Industry Volume (K Unit) Forecast, by Application 2019 & 2032
- Table 39: Global Quantum Sensors Industry Revenue Million Forecast, by Country 2019 & 2032
- Table 40: Global Quantum Sensors Industry Volume K Unit Forecast, by Country 2019 & 2032
- Table 41: China Quantum Sensors Industry Revenue (Million) Forecast, by Application 2019 & 2032
- Table 42: China Quantum Sensors Industry Volume (K Unit) Forecast, by Application 2019 & 2032
- Table 43: Japan Quantum Sensors Industry Revenue (Million) Forecast, by Application 2019 & 2032
- Table 44: Japan Quantum Sensors Industry Volume (K Unit) Forecast, by Application 2019 & 2032
- Table 45: India Quantum Sensors Industry Revenue (Million) Forecast, by Application 2019 & 2032
- Table 46: India Quantum Sensors Industry Volume (K Unit) Forecast, by Application 2019 & 2032
- Table 47: South Korea Quantum Sensors Industry Revenue (Million) Forecast, by Application 2019 & 2032
- Table 48: South Korea Quantum Sensors Industry Volume (K Unit) Forecast, by Application 2019 & 2032
- Table 49: Southeast Asia Quantum Sensors Industry Revenue (Million) Forecast, by Application 2019 & 2032
- Table 50: Southeast Asia Quantum Sensors Industry Volume (K Unit) Forecast, by Application 2019 & 2032
- Table 51: Australia Quantum Sensors Industry Revenue (Million) Forecast, by Application 2019 & 2032
- Table 52: Australia Quantum Sensors Industry Volume (K Unit) Forecast, by Application 2019 & 2032
- Table 53: Indonesia Quantum Sensors Industry Revenue (Million) Forecast, by Application 2019 & 2032
- Table 54: Indonesia Quantum Sensors Industry Volume (K Unit) Forecast, by Application 2019 & 2032
- Table 55: Phillipes Quantum Sensors Industry Revenue (Million) Forecast, by Application 2019 & 2032
- Table 56: Phillipes Quantum Sensors Industry Volume (K Unit) Forecast, by Application 2019 & 2032
- Table 57: Singapore Quantum Sensors Industry Revenue (Million) Forecast, by Application 2019 & 2032
- Table 58: Singapore Quantum Sensors Industry Volume (K Unit) Forecast, by Application 2019 & 2032
- Table 59: Thailandc Quantum Sensors Industry Revenue (Million) Forecast, by Application 2019 & 2032
- Table 60: Thailandc Quantum Sensors Industry Volume (K Unit) Forecast, by Application 2019 & 2032
- Table 61: Rest of Asia Pacific Quantum Sensors Industry Revenue (Million) Forecast, by Application 2019 & 2032
- Table 62: Rest of Asia Pacific Quantum Sensors Industry Volume (K Unit) Forecast, by Application 2019 & 2032
- Table 63: Global Quantum Sensors Industry Revenue Million Forecast, by Country 2019 & 2032
- Table 64: Global Quantum Sensors Industry Volume K Unit Forecast, by Country 2019 & 2032
- Table 65: Brazil Quantum Sensors Industry Revenue (Million) Forecast, by Application 2019 & 2032
- Table 66: Brazil Quantum Sensors Industry Volume (K Unit) Forecast, by Application 2019 & 2032
- Table 67: Argentina Quantum Sensors Industry Revenue (Million) Forecast, by Application 2019 & 2032
- Table 68: Argentina Quantum Sensors Industry Volume (K Unit) Forecast, by Application 2019 & 2032
- Table 69: Peru Quantum Sensors Industry Revenue (Million) Forecast, by Application 2019 & 2032
- Table 70: Peru Quantum Sensors Industry Volume (K Unit) Forecast, by Application 2019 & 2032
- Table 71: Chile Quantum Sensors Industry Revenue (Million) Forecast, by Application 2019 & 2032
- Table 72: Chile Quantum Sensors Industry Volume (K Unit) Forecast, by Application 2019 & 2032
- Table 73: Colombia Quantum Sensors Industry Revenue (Million) Forecast, by Application 2019 & 2032
- Table 74: Colombia Quantum Sensors Industry Volume (K Unit) Forecast, by Application 2019 & 2032
- Table 75: Ecuador Quantum Sensors Industry Revenue (Million) Forecast, by Application 2019 & 2032
- Table 76: Ecuador Quantum Sensors Industry Volume (K Unit) Forecast, by Application 2019 & 2032
- Table 77: Venezuela Quantum Sensors Industry Revenue (Million) Forecast, by Application 2019 & 2032
- Table 78: Venezuela Quantum Sensors Industry Volume (K Unit) Forecast, by Application 2019 & 2032
- Table 79: Rest of South America Quantum Sensors Industry Revenue (Million) Forecast, by Application 2019 & 2032
- Table 80: Rest of South America Quantum Sensors Industry Volume (K Unit) Forecast, by Application 2019 & 2032
- Table 81: Global Quantum Sensors Industry Revenue Million Forecast, by Country 2019 & 2032
- Table 82: Global Quantum Sensors Industry Volume K Unit Forecast, by Country 2019 & 2032
- Table 83: United States Quantum Sensors Industry Revenue (Million) Forecast, by Application 2019 & 2032
- Table 84: United States Quantum Sensors Industry Volume (K Unit) Forecast, by Application 2019 & 2032
- Table 85: Canada Quantum Sensors Industry Revenue (Million) Forecast, by Application 2019 & 2032
- Table 86: Canada Quantum Sensors Industry Volume (K Unit) Forecast, by Application 2019 & 2032
- Table 87: Mexico Quantum Sensors Industry Revenue (Million) Forecast, by Application 2019 & 2032
- Table 88: Mexico Quantum Sensors Industry Volume (K Unit) Forecast, by Application 2019 & 2032
- Table 89: Global Quantum Sensors Industry Revenue Million Forecast, by Country 2019 & 2032
- Table 90: Global Quantum Sensors Industry Volume K Unit Forecast, by Country 2019 & 2032
- Table 91: United Arab Emirates Quantum Sensors Industry Revenue (Million) Forecast, by Application 2019 & 2032
- Table 92: United Arab Emirates Quantum Sensors Industry Volume (K Unit) Forecast, by Application 2019 & 2032
- Table 93: Saudi Arabia Quantum Sensors Industry Revenue (Million) Forecast, by Application 2019 & 2032
- Table 94: Saudi Arabia Quantum Sensors Industry Volume (K Unit) Forecast, by Application 2019 & 2032
- Table 95: South Africa Quantum Sensors Industry Revenue (Million) Forecast, by Application 2019 & 2032
- Table 96: South Africa Quantum Sensors Industry Volume (K Unit) Forecast, by Application 2019 & 2032
- Table 97: Rest of Middle East and Africa Quantum Sensors Industry Revenue (Million) Forecast, by Application 2019 & 2032
- Table 98: Rest of Middle East and Africa Quantum Sensors Industry Volume (K Unit) Forecast, by Application 2019 & 2032
- Table 99: Global Quantum Sensors Industry Revenue Million Forecast, by Product Type 2019 & 2032
- Table 100: Global Quantum Sensors Industry Volume K Unit Forecast, by Product Type 2019 & 2032
- Table 101: Global Quantum Sensors Industry Revenue Million Forecast, by Application 2019 & 2032
- Table 102: Global Quantum Sensors Industry Volume K Unit Forecast, by Application 2019 & 2032
- Table 103: Global Quantum Sensors Industry Revenue Million Forecast, by Country 2019 & 2032
- Table 104: Global Quantum Sensors Industry Volume K Unit Forecast, by Country 2019 & 2032
- Table 105: United States Quantum Sensors Industry Revenue (Million) Forecast, by Application 2019 & 2032
- Table 106: United States Quantum Sensors Industry Volume (K Unit) Forecast, by Application 2019 & 2032
- Table 107: Canada Quantum Sensors Industry Revenue (Million) Forecast, by Application 2019 & 2032
- Table 108: Canada Quantum Sensors Industry Volume (K Unit) Forecast, by Application 2019 & 2032
- Table 109: Mexico Quantum Sensors Industry Revenue (Million) Forecast, by Application 2019 & 2032
- Table 110: Mexico Quantum Sensors Industry Volume (K Unit) Forecast, by Application 2019 & 2032
- Table 111: Global Quantum Sensors Industry Revenue Million Forecast, by Product Type 2019 & 2032
- Table 112: Global Quantum Sensors Industry Volume K Unit Forecast, by Product Type 2019 & 2032
- Table 113: Global Quantum Sensors Industry Revenue Million Forecast, by Application 2019 & 2032
- Table 114: Global Quantum Sensors Industry Volume K Unit Forecast, by Application 2019 & 2032
- Table 115: Global Quantum Sensors Industry Revenue Million Forecast, by Country 2019 & 2032
- Table 116: Global Quantum Sensors Industry Volume K Unit Forecast, by Country 2019 & 2032
- Table 117: Germany Quantum Sensors Industry Revenue (Million) Forecast, by Application 2019 & 2032
- Table 118: Germany Quantum Sensors Industry Volume (K Unit) Forecast, by Application 2019 & 2032
- Table 119: United Kingdom Quantum Sensors Industry Revenue (Million) Forecast, by Application 2019 & 2032
- Table 120: United Kingdom Quantum Sensors Industry Volume (K Unit) Forecast, by Application 2019 & 2032
- Table 121: France Quantum Sensors Industry Revenue (Million) Forecast, by Application 2019 & 2032
- Table 122: France Quantum Sensors Industry Volume (K Unit) Forecast, by Application 2019 & 2032
- Table 123: Italy Quantum Sensors Industry Revenue (Million) Forecast, by Application 2019 & 2032
- Table 124: Italy Quantum Sensors Industry Volume (K Unit) Forecast, by Application 2019 & 2032
- Table 125: Spain Quantum Sensors Industry Revenue (Million) Forecast, by Application 2019 & 2032
- Table 126: Spain Quantum Sensors Industry Volume (K Unit) Forecast, by Application 2019 & 2032
- Table 127: Rest of Europe Quantum Sensors Industry Revenue (Million) Forecast, by Application 2019 & 2032
- Table 128: Rest of Europe Quantum Sensors Industry Volume (K Unit) Forecast, by Application 2019 & 2032
- Table 129: Global Quantum Sensors Industry Revenue Million Forecast, by Product Type 2019 & 2032
- Table 130: Global Quantum Sensors Industry Volume K Unit Forecast, by Product Type 2019 & 2032
- Table 131: Global Quantum Sensors Industry Revenue Million Forecast, by Application 2019 & 2032
- Table 132: Global Quantum Sensors Industry Volume K Unit Forecast, by Application 2019 & 2032
- Table 133: Global Quantum Sensors Industry Revenue Million Forecast, by Country 2019 & 2032
- Table 134: Global Quantum Sensors Industry Volume K Unit Forecast, by Country 2019 & 2032
- Table 135: China Quantum Sensors Industry Revenue (Million) Forecast, by Application 2019 & 2032
- Table 136: China Quantum Sensors Industry Volume (K Unit) Forecast, by Application 2019 & 2032
- Table 137: Japan Quantum Sensors Industry Revenue (Million) Forecast, by Application 2019 & 2032
- Table 138: Japan Quantum Sensors Industry Volume (K Unit) Forecast, by Application 2019 & 2032
- Table 139: India Quantum Sensors Industry Revenue (Million) Forecast, by Application 2019 & 2032
- Table 140: India Quantum Sensors Industry Volume (K Unit) Forecast, by Application 2019 & 2032
- Table 141: Australia Quantum Sensors Industry Revenue (Million) Forecast, by Application 2019 & 2032
- Table 142: Australia Quantum Sensors Industry Volume (K Unit) Forecast, by Application 2019 & 2032
- Table 143: South Korea Quantum Sensors Industry Revenue (Million) Forecast, by Application 2019 & 2032
- Table 144: South Korea Quantum Sensors Industry Volume (K Unit) Forecast, by Application 2019 & 2032
- Table 145: Rest of Asia Pacific Quantum Sensors Industry Revenue (Million) Forecast, by Application 2019 & 2032
- Table 146: Rest of Asia Pacific Quantum Sensors Industry Volume (K Unit) Forecast, by Application 2019 & 2032
- Table 147: Global Quantum Sensors Industry Revenue Million Forecast, by Product Type 2019 & 2032
- Table 148: Global Quantum Sensors Industry Volume K Unit Forecast, by Product Type 2019 & 2032
- Table 149: Global Quantum Sensors Industry Revenue Million Forecast, by Application 2019 & 2032
- Table 150: Global Quantum Sensors Industry Volume K Unit Forecast, by Application 2019 & 2032
- Table 151: Global Quantum Sensors Industry Revenue Million Forecast, by Country 2019 & 2032
- Table 152: Global Quantum Sensors Industry Volume K Unit Forecast, by Country 2019 & 2032
- Table 153: UAE Quantum Sensors Industry Revenue (Million) Forecast, by Application 2019 & 2032
- Table 154: UAE Quantum Sensors Industry Volume (K Unit) Forecast, by Application 2019 & 2032
- Table 155: South Africa Quantum Sensors Industry Revenue (Million) Forecast, by Application 2019 & 2032
- Table 156: South Africa Quantum Sensors Industry Volume (K Unit) Forecast, by Application 2019 & 2032
- Table 157: Saudi Arabia Quantum Sensors Industry Revenue (Million) Forecast, by Application 2019 & 2032
- Table 158: Saudi Arabia Quantum Sensors Industry Volume (K Unit) Forecast, by Application 2019 & 2032
- Table 159: Rest Of MEA Quantum Sensors Industry Revenue (Million) Forecast, by Application 2019 & 2032
- Table 160: Rest Of MEA Quantum Sensors Industry Volume (K Unit) Forecast, by Application 2019 & 2032
- Table 161: Global Quantum Sensors Industry Revenue Million Forecast, by Product Type 2019 & 2032
- Table 162: Global Quantum Sensors Industry Volume K Unit Forecast, by Product Type 2019 & 2032
- Table 163: Global Quantum Sensors Industry Revenue Million Forecast, by Application 2019 & 2032
- Table 164: Global Quantum Sensors Industry Volume K Unit Forecast, by Application 2019 & 2032
- Table 165: Global Quantum Sensors Industry Revenue Million Forecast, by Country 2019 & 2032
- Table 166: Global Quantum Sensors Industry Volume K Unit Forecast, by Country 2019 & 2032
- Table 167: Brazil Quantum Sensors Industry Revenue (Million) Forecast, by Application 2019 & 2032
- Table 168: Brazil Quantum Sensors Industry Volume (K Unit) Forecast, by Application 2019 & 2032
- Table 169: Argentina Quantum Sensors Industry Revenue (Million) Forecast, by Application 2019 & 2032
- Table 170: Argentina Quantum Sensors Industry Volume (K Unit) Forecast, by Application 2019 & 2032
- Table 171: Rest of South America Quantum Sensors Industry Revenue (Million) Forecast, by Application 2019 & 2032
- Table 172: Rest of South America Quantum Sensors Industry Volume (K Unit) Forecast, by Application 2019 & 2032
Frequently Asked Questions
1. What is the projected Compound Annual Growth Rate (CAGR) of the Quantum Sensors Industry?
The projected CAGR is approximately 12.95%.
2. Which companies are prominent players in the Quantum Sensors Industry?
Key companies in the market include Campbell Scientific Ltd, LI-COR Inc, AOSense Inc, Muquans SAS, M Squared Lasers Limited, Skye Instruments Ltd, Robert Bosch GmbH, Apogee Instrument Inc.
3. What are the main segments of the Quantum Sensors Industry?
The market segments include Product Type, Application.
4. Can you provide details about the market size?
The market size is estimated to be USD 0.67 Million as of 2022.
5. What are some drivers contributing to market growth?
Increasing Research Activities in the Quantum Field; Increasing Investment in Space Communication.
6. What are the notable trends driving market growth?
Oil and Gas Industry to Grow Significantly.
7. Are there any restraints impacting market growth?
High Deployment and Maintenance Costs.
8. Can you provide examples of recent developments in the market?
April 2024: The US National Science Foundation invested USD 29 million to assist 18 teams of researchers at universities across the United States to explore quantum sensing. Each research team will receive around USD 2 million over four years to research quantum phenomena, such as entanglement, to create sensors to assist in things that would otherwise be impossible. Quantum sensors can enable experts to pinpoint infections inside individual cells and find subterranean mineral deposits.
9. What pricing options are available for accessing the report?
Pricing options include single-user, multi-user, and enterprise licenses priced at USD 4750, USD 5250, and USD 8750 respectively.
10. Is the market size provided in terms of value or volume?
The market size is provided in terms of value, measured in Million and volume, measured in K Unit.
11. Are there any specific market keywords associated with the report?
Yes, the market keyword associated with the report is "Quantum Sensors Industry," which aids in identifying and referencing the specific market segment covered.
12. How do I determine which pricing option suits my needs best?
The pricing options vary based on user requirements and access needs. Individual users may opt for single-user licenses, while businesses requiring broader access may choose multi-user or enterprise licenses for cost-effective access to the report.
13. Are there any additional resources or data provided in the Quantum Sensors Industry report?
While the report offers comprehensive insights, it's advisable to review the specific contents or supplementary materials provided to ascertain if additional resources or data are available.
14. How can I stay updated on further developments or reports in the Quantum Sensors Industry?
To stay informed about further developments, trends, and reports in the Quantum Sensors Industry, consider subscribing to industry newsletters, following relevant companies and organizations, or regularly checking reputable industry news sources and publications.
Methodology
Step 1 - Identification of Relevant Samples Size from Population Database


Step 2 - Approaches for Defining Global Market Size (Value, Volume* & Price*)

Note*: In applicable scenarios
Step 3 - Data Sources
Primary Research
- Web Analytics
- Survey Reports
- Research Institute
- Latest Research Reports
- Opinion Leaders
Secondary Research
- Annual Reports
- White Paper
- Latest Press Release
- Industry Association
- Paid Database
- Investor Presentations

Step 4 - Data Triangulation
Involves using different sources of information in order to increase the validity of a study
These sources are likely to be stakeholders in a program - participants, other researchers, program staff, other community members, and so on.
Then we put all data in single framework & apply various statistical tools to find out the dynamic on the market.
During the analysis stage, feedback from the stakeholder groups would be compared to determine areas of agreement as well as areas of divergence


