
Key Insights
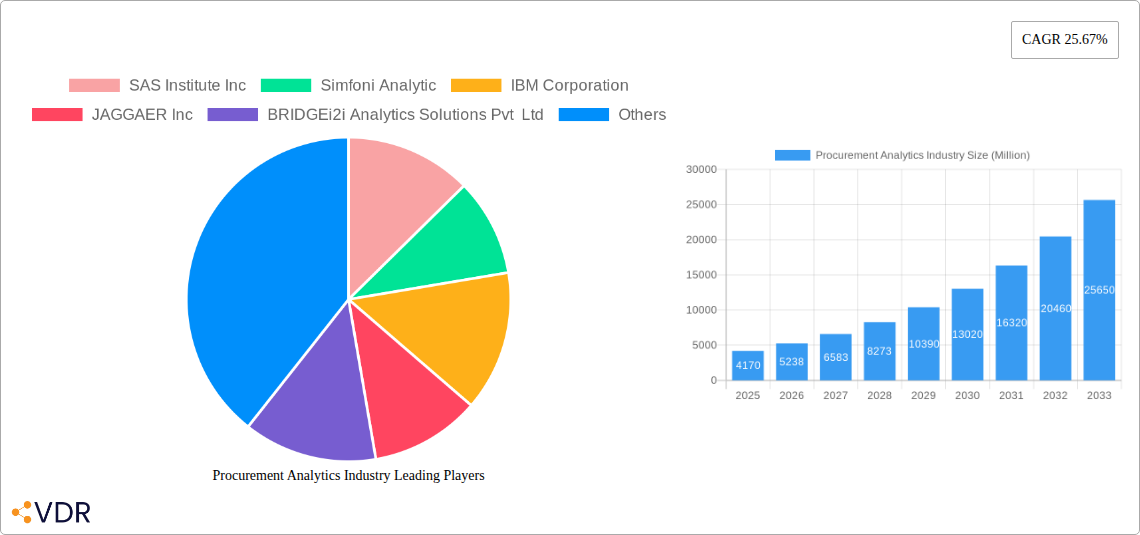
The Procurement Analytics market, valued at $4.17 billion in 2025, is experiencing robust growth, projected to expand at a Compound Annual Growth Rate (CAGR) of 25.67% from 2025 to 2033. This surge is driven by several key factors. Firstly, the increasing need for enhanced supply chain visibility and efficiency, particularly amidst global economic uncertainty and supply chain disruptions, is fueling demand for advanced analytics solutions. Businesses are increasingly leveraging data-driven insights to optimize sourcing, reduce costs, mitigate risks, and improve supplier relationships. Secondly, the adoption of cloud-based procurement analytics platforms is accelerating, offering scalability, flexibility, and reduced IT infrastructure costs. Furthermore, the growing sophistication of analytics techniques, including AI and machine learning, is enabling more precise forecasting, risk assessment, and contract negotiations. The market is segmented across various types (software and services), deployment models (on-premise and cloud), applications (supply chain, risk, spend, demand forecasting, and contract management analytics), and end-user industries (manufacturing, transportation & logistics, retail & e-commerce, BFSI, IT & telecom, and others). The competitive landscape is dynamic, with established players like SAS Institute, IBM, and Oracle competing alongside specialized procurement analytics vendors like Zycus and JAGGAER.
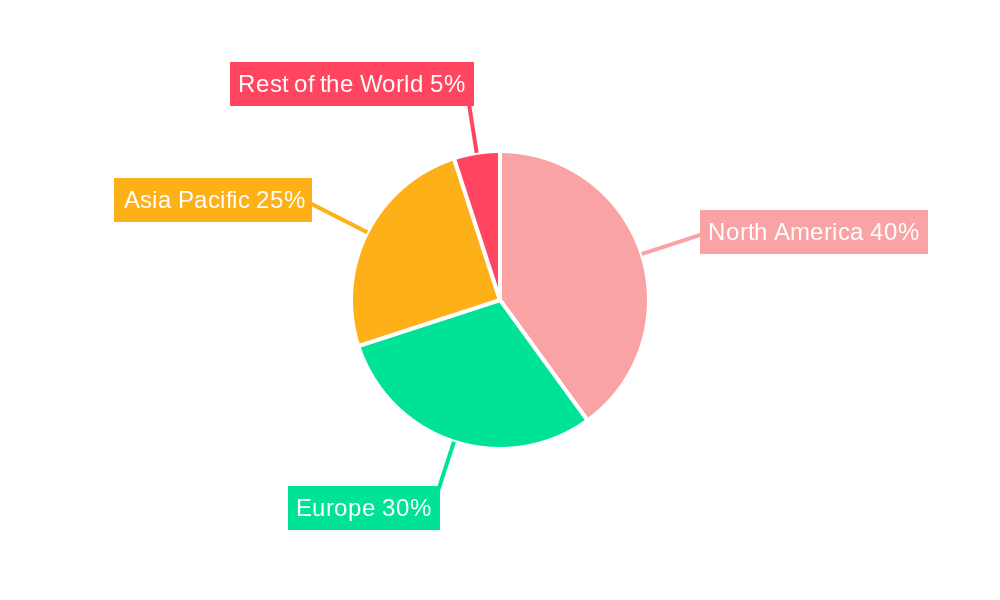
The North American market currently holds a significant share, driven by early adoption and technological advancements. However, the Asia-Pacific region is anticipated to witness substantial growth in the coming years, fueled by rapid industrialization and digital transformation initiatives. European markets are also showing steady expansion, driven by regulatory changes and a focus on operational efficiency. The ongoing digital transformation across various industries, coupled with increasing pressure on businesses to optimize procurement processes and enhance profitability, will continue to propel the growth of the Procurement Analytics market throughout the forecast period. This growth is further supported by the increasing availability of high-quality data, the expanding expertise in data analytics, and the growing recognition of the ROI associated with implementing robust procurement analytics solutions.
Procurement Analytics Market Report: 2019-2033
This comprehensive report provides a detailed analysis of the Procurement Analytics industry, encompassing market dynamics, growth trends, regional dominance, product landscape, key players, and future outlook. The study covers the period 2019-2033, with a focus on 2025 as the base and estimated year. The report segments the market by Type (Software, Services), Deployment Type (On-Premise, Cloud), Application (Supply Chain Analytics, Risk Analytics, Spend Analytics, Demand Forecasting, Contract Management), and End-User (Manufacturing, Transportation & Logistics, Retail & E-commerce, BFSI, IT & Telecommunication, Other End-Users). The total market size is projected to reach xx Million by 2033, exhibiting a CAGR of xx% during the forecast period (2025-2033).
Procurement Analytics Industry Market Dynamics & Structure
The Procurement Analytics market is characterized by moderate concentration, with key players like SAS Institute Inc, IBM Corporation, and SAP SE holding significant market share. However, the market also features several niche players and emerging startups, driving innovation and competition. Technological advancements, particularly in AI and machine learning, are major drivers, while regulatory changes and data privacy concerns pose challenges. The market is witnessing increased M&A activity, with an estimated xx deals occurring between 2019 and 2024, indicating consolidation and expansion strategies among players. Substitute technologies, such as traditional manual procurement processes, still exist, but their adoption is declining due to the increased efficiency offered by procurement analytics solutions. The end-user demographics are diverse, with a growing adoption across various industries.
- Market Concentration: Moderately concentrated, with top 5 players holding xx% market share in 2024.
- Technological Innovation: AI, Machine Learning, and Big Data analytics are key drivers.
- Regulatory Framework: Data privacy regulations (GDPR, CCPA) influence market dynamics.
- Competitive Substitutes: Traditional manual procurement processes are being replaced.
- M&A Trends: xx deals between 2019-2024, indicating market consolidation.
- End-User Demographics: Diverse, with significant growth across Manufacturing, BFSI, and Retail.
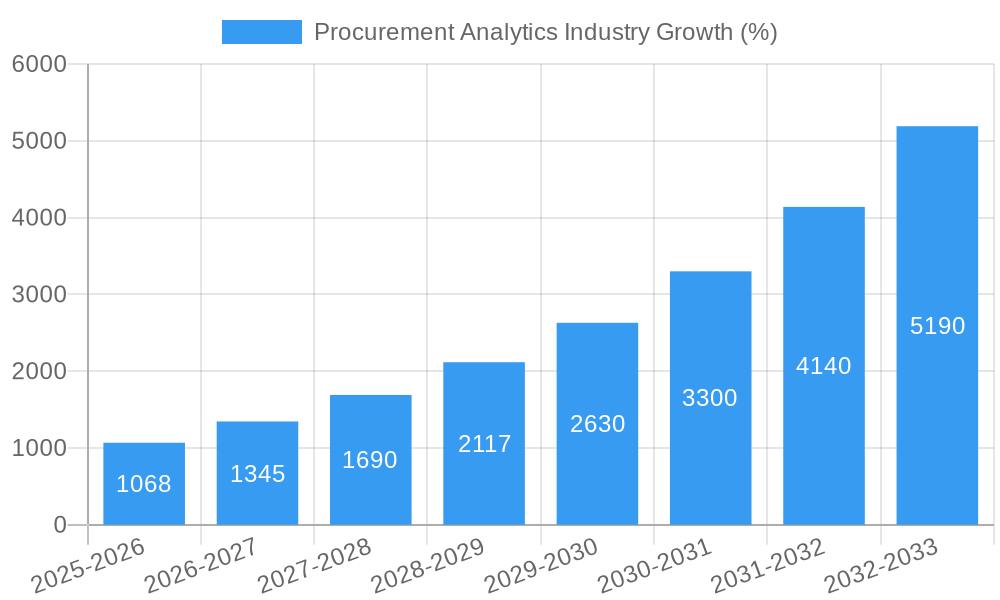
Procurement Analytics Industry Growth Trends & Insights
The Procurement Analytics market experienced significant growth during the historical period (2019-2024), reaching xx Million in 2024. This growth is attributed to the increasing need for efficient and cost-effective procurement processes across various industries. The adoption rate of procurement analytics solutions is rising, driven by factors like improved data visibility, reduced operational costs, and enhanced decision-making capabilities. Technological disruptions, such as the increasing adoption of cloud-based solutions and the integration of AI/ML, are further fueling market expansion. Consumer behavior shifts toward data-driven decision-making in procurement are also contributing to this growth trajectory. The market is expected to maintain a strong growth momentum during the forecast period (2025-2033), driven by continued technological advancements and increasing digital transformation initiatives across industries. Market penetration is expected to increase from xx% in 2024 to xx% by 2033.
- Market Size (2024): xx Million
- CAGR (2019-2024): xx%
- Market Penetration (2024): xx%
- Projected Market Size (2033): xx Million
- CAGR (2025-2033): xx%
Dominant Regions, Countries, or Segments in Procurement Analytics Industry
North America currently holds the largest market share in the Procurement Analytics industry, driven by high technology adoption rates, robust digital infrastructure, and the presence of major market players. However, Asia-Pacific is projected to experience the fastest growth during the forecast period due to increasing digitalization, expanding industrial sectors, and rising government investments in digital infrastructure. Within segments, the Software segment dominates by type, while the Cloud deployment type is experiencing rapid growth. Spend Analytics is the leading application segment, followed closely by Supply Chain Analytics. The Manufacturing sector is the largest end-user, due to its focus on efficiency and cost optimization.
- Leading Region: North America (market share xx% in 2024)
- Fastest-Growing Region: Asia-Pacific (projected CAGR xx% during 2025-2033)
- Dominant Segment (by type): Software
- Dominant Segment (by deployment): Cloud
- Dominant Segment (by application): Spend Analytics
- Dominant Segment (by end-user): Manufacturing
Procurement Analytics Industry Product Landscape
Procurement analytics solutions are increasingly incorporating AI and machine learning capabilities to enhance data analysis, predictive modeling, and automated decision-making. The focus is shifting towards cloud-based solutions, offering scalability, flexibility, and cost-effectiveness. Key features include real-time data visualization, advanced reporting capabilities, and integration with existing ERP systems. Unique selling propositions often center around ease of use, advanced analytics capabilities, and industry-specific customization. Technological advancements are driving the development of more sophisticated solutions with enhanced accuracy, efficiency, and predictive capabilities.
Key Drivers, Barriers & Challenges in Procurement Analytics Industry
Key Drivers:
- Increasing need for cost optimization and efficiency in procurement processes.
- Rise of Big Data and the need for advanced analytics capabilities.
- Growing adoption of cloud-based solutions.
- Increased regulatory compliance requirements.
Key Barriers and Challenges:
- High initial investment costs for software and implementation.
- Lack of skilled professionals to manage and interpret data.
- Data integration challenges across different systems.
- Concerns about data security and privacy.
- Limited awareness of the benefits of procurement analytics in some industries.
Emerging Opportunities in Procurement Analytics Industry
- Expansion into untapped markets, particularly in developing economies.
- Growing adoption of procurement analytics in the public sector.
- Increasing demand for specialized solutions tailored to specific industries.
- Development of innovative applications, such as predictive sourcing and risk management.
- Integration of blockchain technology for improved transparency and security in procurement.
Growth Accelerators in the Procurement Analytics Industry
Technological advancements, including AI and machine learning, are expected to continue driving growth. Strategic partnerships between software providers and consulting firms will play a crucial role in expanding market reach and driving adoption. Market expansion into new geographies and industries, particularly in developing economies, will unlock significant growth potential. The rising adoption of cloud-based solutions will provide increased flexibility and scalability.
Key Players Shaping the Procurement Analytics Market
- SAS Institute Inc
- Simfoni Analytic
- IBM Corporation
- JAGGAER Inc
- BRIDGEi2i Analytics Solutions Pvt Ltd
- Rosslyn Data Technologies PLC
- Zycus Inc
- Oracle Corporation
- SAP SE
- Genpact Limited
Notable Milestones in Procurement Analytics Industry Sector
- October 2023: SAP announced that Tata Projects Limited is leveraging RISE with SAP solutions, accelerating its business transformation. This highlights the increasing adoption of cloud-based procurement analytics solutions by large enterprises.
- August 2022: SAS Institute Inc partnered with SingleStore, enhancing data access and scalability for SAS Viya. This collaboration showcases the importance of data integration and performance optimization in the procurement analytics space.
In-Depth Procurement Analytics Industry Market Outlook
The Procurement Analytics market is poised for sustained growth, driven by technological advancements, increased digital transformation initiatives, and the growing need for efficient procurement processes. Strategic partnerships, expansion into untapped markets, and the development of innovative applications will further accelerate market growth. The market's future potential is significant, offering substantial opportunities for established players and new entrants alike. Focusing on developing user-friendly, scalable, and secure solutions will be crucial for success in this rapidly evolving market.
Procurement Analytics Industry Segmentation
-
1. Type
- 1.1. Software
- 1.2. Services
-
2. Deployment Type
- 2.1. On-Premise
- 2.2. Cloud
-
3. Application
- 3.1. Supply Chain Analytics
- 3.2. Risk Analytics
- 3.3. Spend Analytics
- 3.4. Demand Forecasting
- 3.5. Contract Management
-
4. End-User
- 4.1. Manufacturing
- 4.2. Transportation & Logistic
- 4.3. Retail and E-commerce
- 4.4. BFSI
- 4.5. IT & Telecommunication
- 4.6. Other End-Users (Education, Healthcare)
Procurement Analytics Industry Segmentation By Geography
- 1. North America
- 2. Europe
- 3. Asia Pacific
- 4. Rest of the World
Procurement Analytics Industry REPORT HIGHLIGHTS
| Aspects | Details |
|---|---|
| Study Period | 2019-2033 |
| Base Year | 2024 |
| Estimated Year | 2025 |
| Forecast Period | 2025-2033 |
| Historical Period | 2019-2024 |
| Growth Rate | CAGR of 25.67% from 2019-2033 |
| Segmentation |
|
Table of Contents
- 1. Introduction
- 1.1. Research Scope
- 1.2. Market Segmentation
- 1.3. Research Methodology
- 1.4. Definitions and Assumptions
- 2. Executive Summary
- 2.1. Introduction
- 3. Market Dynamics
- 3.1. Introduction
- 3.2. Market Drivers
- 3.2.1. Rising Adoption in Procurement Process in Industries; Rising Demand for Cloud Based Analytical Solutions
- 3.3. Market Restrains
- 3.3.1. Lack of Trained and Skilled Analytical Professionals; Growing Data Breaches Cases
- 3.4. Market Trends
- 3.4.1. Retail and E-commerce Sector to Witness the Growth
- 4. Market Factor Analysis
- 4.1. Porters Five Forces
- 4.2. Supply/Value Chain
- 4.3. PESTEL analysis
- 4.4. Market Entropy
- 4.5. Patent/Trademark Analysis
- 5. Global Procurement Analytics Industry Analysis, Insights and Forecast, 2019-2031
- 5.1. Market Analysis, Insights and Forecast - by Type
- 5.1.1. Software
- 5.1.2. Services
- 5.2. Market Analysis, Insights and Forecast - by Deployment Type
- 5.2.1. On-Premise
- 5.2.2. Cloud
- 5.3. Market Analysis, Insights and Forecast - by Application
- 5.3.1. Supply Chain Analytics
- 5.3.2. Risk Analytics
- 5.3.3. Spend Analytics
- 5.3.4. Demand Forecasting
- 5.3.5. Contract Management
- 5.4. Market Analysis, Insights and Forecast - by End-User
- 5.4.1. Manufacturing
- 5.4.2. Transportation & Logistic
- 5.4.3. Retail and E-commerce
- 5.4.4. BFSI
- 5.4.5. IT & Telecommunication
- 5.4.6. Other End-Users (Education, Healthcare)
- 5.5. Market Analysis, Insights and Forecast - by Region
- 5.5.1. North America
- 5.5.2. Europe
- 5.5.3. Asia Pacific
- 5.5.4. Rest of the World
- 5.1. Market Analysis, Insights and Forecast - by Type
- 6. North America Procurement Analytics Industry Analysis, Insights and Forecast, 2019-2031
- 6.1. Market Analysis, Insights and Forecast - by Type
- 6.1.1. Software
- 6.1.2. Services
- 6.2. Market Analysis, Insights and Forecast - by Deployment Type
- 6.2.1. On-Premise
- 6.2.2. Cloud
- 6.3. Market Analysis, Insights and Forecast - by Application
- 6.3.1. Supply Chain Analytics
- 6.3.2. Risk Analytics
- 6.3.3. Spend Analytics
- 6.3.4. Demand Forecasting
- 6.3.5. Contract Management
- 6.4. Market Analysis, Insights and Forecast - by End-User
- 6.4.1. Manufacturing
- 6.4.2. Transportation & Logistic
- 6.4.3. Retail and E-commerce
- 6.4.4. BFSI
- 6.4.5. IT & Telecommunication
- 6.4.6. Other End-Users (Education, Healthcare)
- 6.1. Market Analysis, Insights and Forecast - by Type
- 7. Europe Procurement Analytics Industry Analysis, Insights and Forecast, 2019-2031
- 7.1. Market Analysis, Insights and Forecast - by Type
- 7.1.1. Software
- 7.1.2. Services
- 7.2. Market Analysis, Insights and Forecast - by Deployment Type
- 7.2.1. On-Premise
- 7.2.2. Cloud
- 7.3. Market Analysis, Insights and Forecast - by Application
- 7.3.1. Supply Chain Analytics
- 7.3.2. Risk Analytics
- 7.3.3. Spend Analytics
- 7.3.4. Demand Forecasting
- 7.3.5. Contract Management
- 7.4. Market Analysis, Insights and Forecast - by End-User
- 7.4.1. Manufacturing
- 7.4.2. Transportation & Logistic
- 7.4.3. Retail and E-commerce
- 7.4.4. BFSI
- 7.4.5. IT & Telecommunication
- 7.4.6. Other End-Users (Education, Healthcare)
- 7.1. Market Analysis, Insights and Forecast - by Type
- 8. Asia Pacific Procurement Analytics Industry Analysis, Insights and Forecast, 2019-2031
- 8.1. Market Analysis, Insights and Forecast - by Type
- 8.1.1. Software
- 8.1.2. Services
- 8.2. Market Analysis, Insights and Forecast - by Deployment Type
- 8.2.1. On-Premise
- 8.2.2. Cloud
- 8.3. Market Analysis, Insights and Forecast - by Application
- 8.3.1. Supply Chain Analytics
- 8.3.2. Risk Analytics
- 8.3.3. Spend Analytics
- 8.3.4. Demand Forecasting
- 8.3.5. Contract Management
- 8.4. Market Analysis, Insights and Forecast - by End-User
- 8.4.1. Manufacturing
- 8.4.2. Transportation & Logistic
- 8.4.3. Retail and E-commerce
- 8.4.4. BFSI
- 8.4.5. IT & Telecommunication
- 8.4.6. Other End-Users (Education, Healthcare)
- 8.1. Market Analysis, Insights and Forecast - by Type
- 9. Rest of the World Procurement Analytics Industry Analysis, Insights and Forecast, 2019-2031
- 9.1. Market Analysis, Insights and Forecast - by Type
- 9.1.1. Software
- 9.1.2. Services
- 9.2. Market Analysis, Insights and Forecast - by Deployment Type
- 9.2.1. On-Premise
- 9.2.2. Cloud
- 9.3. Market Analysis, Insights and Forecast - by Application
- 9.3.1. Supply Chain Analytics
- 9.3.2. Risk Analytics
- 9.3.3. Spend Analytics
- 9.3.4. Demand Forecasting
- 9.3.5. Contract Management
- 9.4. Market Analysis, Insights and Forecast - by End-User
- 9.4.1. Manufacturing
- 9.4.2. Transportation & Logistic
- 9.4.3. Retail and E-commerce
- 9.4.4. BFSI
- 9.4.5. IT & Telecommunication
- 9.4.6. Other End-Users (Education, Healthcare)
- 9.1. Market Analysis, Insights and Forecast - by Type
- 10. North America Procurement Analytics Industry Analysis, Insights and Forecast, 2019-2031
- 10.1. Market Analysis, Insights and Forecast - By Country/Sub-region
- 10.1.1.
- 11. Europe Procurement Analytics Industry Analysis, Insights and Forecast, 2019-2031
- 11.1. Market Analysis, Insights and Forecast - By Country/Sub-region
- 11.1.1.
- 12. Asia Pacific Procurement Analytics Industry Analysis, Insights and Forecast, 2019-2031
- 12.1. Market Analysis, Insights and Forecast - By Country/Sub-region
- 12.1.1.
- 13. Rest of the World Procurement Analytics Industry Analysis, Insights and Forecast, 2019-2031
- 13.1. Market Analysis, Insights and Forecast - By Country/Sub-region
- 13.1.1.
- 14. Competitive Analysis
- 14.1. Global Market Share Analysis 2024
- 14.2. Company Profiles
- 14.2.1 SAS Institute Inc
- 14.2.1.1. Overview
- 14.2.1.2. Products
- 14.2.1.3. SWOT Analysis
- 14.2.1.4. Recent Developments
- 14.2.1.5. Financials (Based on Availability)
- 14.2.2 Simfoni Analytic
- 14.2.2.1. Overview
- 14.2.2.2. Products
- 14.2.2.3. SWOT Analysis
- 14.2.2.4. Recent Developments
- 14.2.2.5. Financials (Based on Availability)
- 14.2.3 IBM Corporation
- 14.2.3.1. Overview
- 14.2.3.2. Products
- 14.2.3.3. SWOT Analysis
- 14.2.3.4. Recent Developments
- 14.2.3.5. Financials (Based on Availability)
- 14.2.4 JAGGAER Inc
- 14.2.4.1. Overview
- 14.2.4.2. Products
- 14.2.4.3. SWOT Analysis
- 14.2.4.4. Recent Developments
- 14.2.4.5. Financials (Based on Availability)
- 14.2.5 BRIDGEi2i Analytics Solutions Pvt Ltd
- 14.2.5.1. Overview
- 14.2.5.2. Products
- 14.2.5.3. SWOT Analysis
- 14.2.5.4. Recent Developments
- 14.2.5.5. Financials (Based on Availability)
- 14.2.6 Rosslyn Data Technologies PLC
- 14.2.6.1. Overview
- 14.2.6.2. Products
- 14.2.6.3. SWOT Analysis
- 14.2.6.4. Recent Developments
- 14.2.6.5. Financials (Based on Availability)
- 14.2.7 Zycus Inc
- 14.2.7.1. Overview
- 14.2.7.2. Products
- 14.2.7.3. SWOT Analysis
- 14.2.7.4. Recent Developments
- 14.2.7.5. Financials (Based on Availability)
- 14.2.8 Oracle Corporation
- 14.2.8.1. Overview
- 14.2.8.2. Products
- 14.2.8.3. SWOT Analysis
- 14.2.8.4. Recent Developments
- 14.2.8.5. Financials (Based on Availability)
- 14.2.9 SAP SE
- 14.2.9.1. Overview
- 14.2.9.2. Products
- 14.2.9.3. SWOT Analysis
- 14.2.9.4. Recent Developments
- 14.2.9.5. Financials (Based on Availability)
- 14.2.10 Genpact Limited
- 14.2.10.1. Overview
- 14.2.10.2. Products
- 14.2.10.3. SWOT Analysis
- 14.2.10.4. Recent Developments
- 14.2.10.5. Financials (Based on Availability)
- 14.2.1 SAS Institute Inc
List of Figures
- Figure 1: Global Procurement Analytics Industry Revenue Breakdown (Million, %) by Region 2024 & 2032
- Figure 2: North America Procurement Analytics Industry Revenue (Million), by Country 2024 & 2032
- Figure 3: North America Procurement Analytics Industry Revenue Share (%), by Country 2024 & 2032
- Figure 4: Europe Procurement Analytics Industry Revenue (Million), by Country 2024 & 2032
- Figure 5: Europe Procurement Analytics Industry Revenue Share (%), by Country 2024 & 2032
- Figure 6: Asia Pacific Procurement Analytics Industry Revenue (Million), by Country 2024 & 2032
- Figure 7: Asia Pacific Procurement Analytics Industry Revenue Share (%), by Country 2024 & 2032
- Figure 8: Rest of the World Procurement Analytics Industry Revenue (Million), by Country 2024 & 2032
- Figure 9: Rest of the World Procurement Analytics Industry Revenue Share (%), by Country 2024 & 2032
- Figure 10: North America Procurement Analytics Industry Revenue (Million), by Type 2024 & 2032
- Figure 11: North America Procurement Analytics Industry Revenue Share (%), by Type 2024 & 2032
- Figure 12: North America Procurement Analytics Industry Revenue (Million), by Deployment Type 2024 & 2032
- Figure 13: North America Procurement Analytics Industry Revenue Share (%), by Deployment Type 2024 & 2032
- Figure 14: North America Procurement Analytics Industry Revenue (Million), by Application 2024 & 2032
- Figure 15: North America Procurement Analytics Industry Revenue Share (%), by Application 2024 & 2032
- Figure 16: North America Procurement Analytics Industry Revenue (Million), by End-User 2024 & 2032
- Figure 17: North America Procurement Analytics Industry Revenue Share (%), by End-User 2024 & 2032
- Figure 18: North America Procurement Analytics Industry Revenue (Million), by Country 2024 & 2032
- Figure 19: North America Procurement Analytics Industry Revenue Share (%), by Country 2024 & 2032
- Figure 20: Europe Procurement Analytics Industry Revenue (Million), by Type 2024 & 2032
- Figure 21: Europe Procurement Analytics Industry Revenue Share (%), by Type 2024 & 2032
- Figure 22: Europe Procurement Analytics Industry Revenue (Million), by Deployment Type 2024 & 2032
- Figure 23: Europe Procurement Analytics Industry Revenue Share (%), by Deployment Type 2024 & 2032
- Figure 24: Europe Procurement Analytics Industry Revenue (Million), by Application 2024 & 2032
- Figure 25: Europe Procurement Analytics Industry Revenue Share (%), by Application 2024 & 2032
- Figure 26: Europe Procurement Analytics Industry Revenue (Million), by End-User 2024 & 2032
- Figure 27: Europe Procurement Analytics Industry Revenue Share (%), by End-User 2024 & 2032
- Figure 28: Europe Procurement Analytics Industry Revenue (Million), by Country 2024 & 2032
- Figure 29: Europe Procurement Analytics Industry Revenue Share (%), by Country 2024 & 2032
- Figure 30: Asia Pacific Procurement Analytics Industry Revenue (Million), by Type 2024 & 2032
- Figure 31: Asia Pacific Procurement Analytics Industry Revenue Share (%), by Type 2024 & 2032
- Figure 32: Asia Pacific Procurement Analytics Industry Revenue (Million), by Deployment Type 2024 & 2032
- Figure 33: Asia Pacific Procurement Analytics Industry Revenue Share (%), by Deployment Type 2024 & 2032
- Figure 34: Asia Pacific Procurement Analytics Industry Revenue (Million), by Application 2024 & 2032
- Figure 35: Asia Pacific Procurement Analytics Industry Revenue Share (%), by Application 2024 & 2032
- Figure 36: Asia Pacific Procurement Analytics Industry Revenue (Million), by End-User 2024 & 2032
- Figure 37: Asia Pacific Procurement Analytics Industry Revenue Share (%), by End-User 2024 & 2032
- Figure 38: Asia Pacific Procurement Analytics Industry Revenue (Million), by Country 2024 & 2032
- Figure 39: Asia Pacific Procurement Analytics Industry Revenue Share (%), by Country 2024 & 2032
- Figure 40: Rest of the World Procurement Analytics Industry Revenue (Million), by Type 2024 & 2032
- Figure 41: Rest of the World Procurement Analytics Industry Revenue Share (%), by Type 2024 & 2032
- Figure 42: Rest of the World Procurement Analytics Industry Revenue (Million), by Deployment Type 2024 & 2032
- Figure 43: Rest of the World Procurement Analytics Industry Revenue Share (%), by Deployment Type 2024 & 2032
- Figure 44: Rest of the World Procurement Analytics Industry Revenue (Million), by Application 2024 & 2032
- Figure 45: Rest of the World Procurement Analytics Industry Revenue Share (%), by Application 2024 & 2032
- Figure 46: Rest of the World Procurement Analytics Industry Revenue (Million), by End-User 2024 & 2032
- Figure 47: Rest of the World Procurement Analytics Industry Revenue Share (%), by End-User 2024 & 2032
- Figure 48: Rest of the World Procurement Analytics Industry Revenue (Million), by Country 2024 & 2032
- Figure 49: Rest of the World Procurement Analytics Industry Revenue Share (%), by Country 2024 & 2032
List of Tables
- Table 1: Global Procurement Analytics Industry Revenue Million Forecast, by Region 2019 & 2032
- Table 2: Global Procurement Analytics Industry Revenue Million Forecast, by Type 2019 & 2032
- Table 3: Global Procurement Analytics Industry Revenue Million Forecast, by Deployment Type 2019 & 2032
- Table 4: Global Procurement Analytics Industry Revenue Million Forecast, by Application 2019 & 2032
- Table 5: Global Procurement Analytics Industry Revenue Million Forecast, by End-User 2019 & 2032
- Table 6: Global Procurement Analytics Industry Revenue Million Forecast, by Region 2019 & 2032
- Table 7: Global Procurement Analytics Industry Revenue Million Forecast, by Country 2019 & 2032
- Table 8: Procurement Analytics Industry Revenue (Million) Forecast, by Application 2019 & 2032
- Table 9: Global Procurement Analytics Industry Revenue Million Forecast, by Country 2019 & 2032
- Table 10: Procurement Analytics Industry Revenue (Million) Forecast, by Application 2019 & 2032
- Table 11: Global Procurement Analytics Industry Revenue Million Forecast, by Country 2019 & 2032
- Table 12: Procurement Analytics Industry Revenue (Million) Forecast, by Application 2019 & 2032
- Table 13: Global Procurement Analytics Industry Revenue Million Forecast, by Country 2019 & 2032
- Table 14: Procurement Analytics Industry Revenue (Million) Forecast, by Application 2019 & 2032
- Table 15: Global Procurement Analytics Industry Revenue Million Forecast, by Type 2019 & 2032
- Table 16: Global Procurement Analytics Industry Revenue Million Forecast, by Deployment Type 2019 & 2032
- Table 17: Global Procurement Analytics Industry Revenue Million Forecast, by Application 2019 & 2032
- Table 18: Global Procurement Analytics Industry Revenue Million Forecast, by End-User 2019 & 2032
- Table 19: Global Procurement Analytics Industry Revenue Million Forecast, by Country 2019 & 2032
- Table 20: Global Procurement Analytics Industry Revenue Million Forecast, by Type 2019 & 2032
- Table 21: Global Procurement Analytics Industry Revenue Million Forecast, by Deployment Type 2019 & 2032
- Table 22: Global Procurement Analytics Industry Revenue Million Forecast, by Application 2019 & 2032
- Table 23: Global Procurement Analytics Industry Revenue Million Forecast, by End-User 2019 & 2032
- Table 24: Global Procurement Analytics Industry Revenue Million Forecast, by Country 2019 & 2032
- Table 25: Global Procurement Analytics Industry Revenue Million Forecast, by Type 2019 & 2032
- Table 26: Global Procurement Analytics Industry Revenue Million Forecast, by Deployment Type 2019 & 2032
- Table 27: Global Procurement Analytics Industry Revenue Million Forecast, by Application 2019 & 2032
- Table 28: Global Procurement Analytics Industry Revenue Million Forecast, by End-User 2019 & 2032
- Table 29: Global Procurement Analytics Industry Revenue Million Forecast, by Country 2019 & 2032
- Table 30: Global Procurement Analytics Industry Revenue Million Forecast, by Type 2019 & 2032
- Table 31: Global Procurement Analytics Industry Revenue Million Forecast, by Deployment Type 2019 & 2032
- Table 32: Global Procurement Analytics Industry Revenue Million Forecast, by Application 2019 & 2032
- Table 33: Global Procurement Analytics Industry Revenue Million Forecast, by End-User 2019 & 2032
- Table 34: Global Procurement Analytics Industry Revenue Million Forecast, by Country 2019 & 2032
Frequently Asked Questions
1. What is the projected Compound Annual Growth Rate (CAGR) of the Procurement Analytics Industry?
The projected CAGR is approximately 25.67%.
2. Which companies are prominent players in the Procurement Analytics Industry?
Key companies in the market include SAS Institute Inc, Simfoni Analytic, IBM Corporation, JAGGAER Inc, BRIDGEi2i Analytics Solutions Pvt Ltd, Rosslyn Data Technologies PLC, Zycus Inc, Oracle Corporation, SAP SE, Genpact Limited.
3. What are the main segments of the Procurement Analytics Industry?
The market segments include Type, Deployment Type, Application, End-User.
4. Can you provide details about the market size?
The market size is estimated to be USD 4.17 Million as of 2022.
5. What are some drivers contributing to market growth?
Rising Adoption in Procurement Process in Industries; Rising Demand for Cloud Based Analytical Solutions.
6. What are the notable trends driving market growth?
Retail and E-commerce Sector to Witness the Growth.
7. Are there any restraints impacting market growth?
Lack of Trained and Skilled Analytical Professionals; Growing Data Breaches Cases.
8. Can you provide examples of recent developments in the market?
October 2023: SAP announced that Tata Projects Limited, one of India's fastest-growing technology, engineering, procurement, and construction companies, is accelerating its business transformation journey by leveraging the RISE with SAP solutions and surrounding cloud solutions.
9. What pricing options are available for accessing the report?
Pricing options include single-user, multi-user, and enterprise licenses priced at USD 4750, USD 5250, and USD 8750 respectively.
10. Is the market size provided in terms of value or volume?
The market size is provided in terms of value, measured in Million.
11. Are there any specific market keywords associated with the report?
Yes, the market keyword associated with the report is "Procurement Analytics Industry," which aids in identifying and referencing the specific market segment covered.
12. How do I determine which pricing option suits my needs best?
The pricing options vary based on user requirements and access needs. Individual users may opt for single-user licenses, while businesses requiring broader access may choose multi-user or enterprise licenses for cost-effective access to the report.
13. Are there any additional resources or data provided in the Procurement Analytics Industry report?
While the report offers comprehensive insights, it's advisable to review the specific contents or supplementary materials provided to ascertain if additional resources or data are available.
14. How can I stay updated on further developments or reports in the Procurement Analytics Industry?
To stay informed about further developments, trends, and reports in the Procurement Analytics Industry, consider subscribing to industry newsletters, following relevant companies and organizations, or regularly checking reputable industry news sources and publications.
Methodology
Step 1 - Identification of Relevant Samples Size from Population Database


Step 2 - Approaches for Defining Global Market Size (Value, Volume* & Price*)

Note*: In applicable scenarios
Step 3 - Data Sources
Primary Research
- Web Analytics
- Survey Reports
- Research Institute
- Latest Research Reports
- Opinion Leaders
Secondary Research
- Annual Reports
- White Paper
- Latest Press Release
- Industry Association
- Paid Database
- Investor Presentations

Step 4 - Data Triangulation
Involves using different sources of information in order to increase the validity of a study
These sources are likely to be stakeholders in a program - participants, other researchers, program staff, other community members, and so on.
Then we put all data in single framework & apply various statistical tools to find out the dynamic on the market.
During the analysis stage, feedback from the stakeholder groups would be compared to determine areas of agreement as well as areas of divergence


