
Key Insights
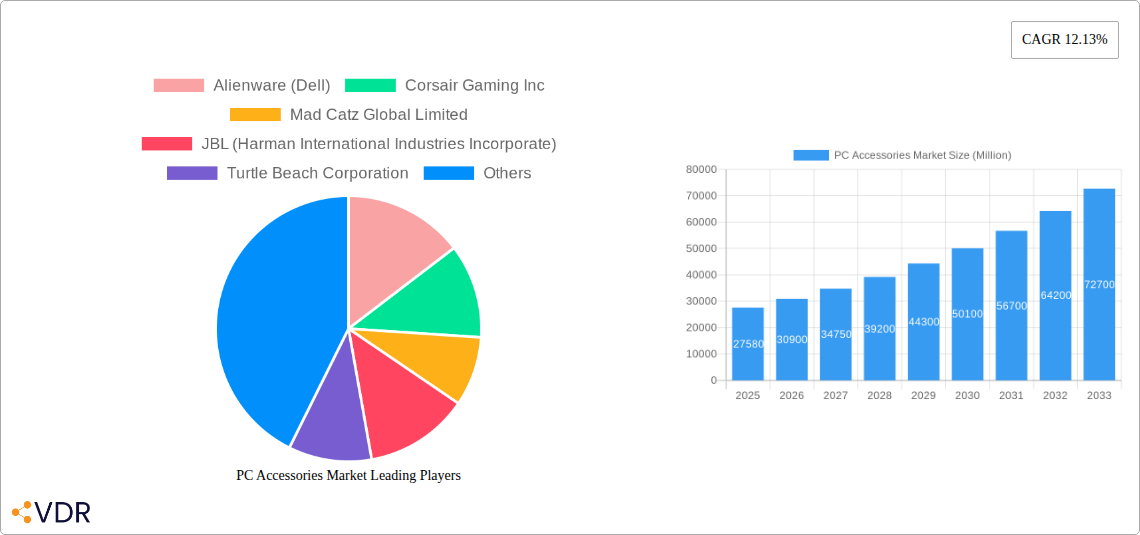
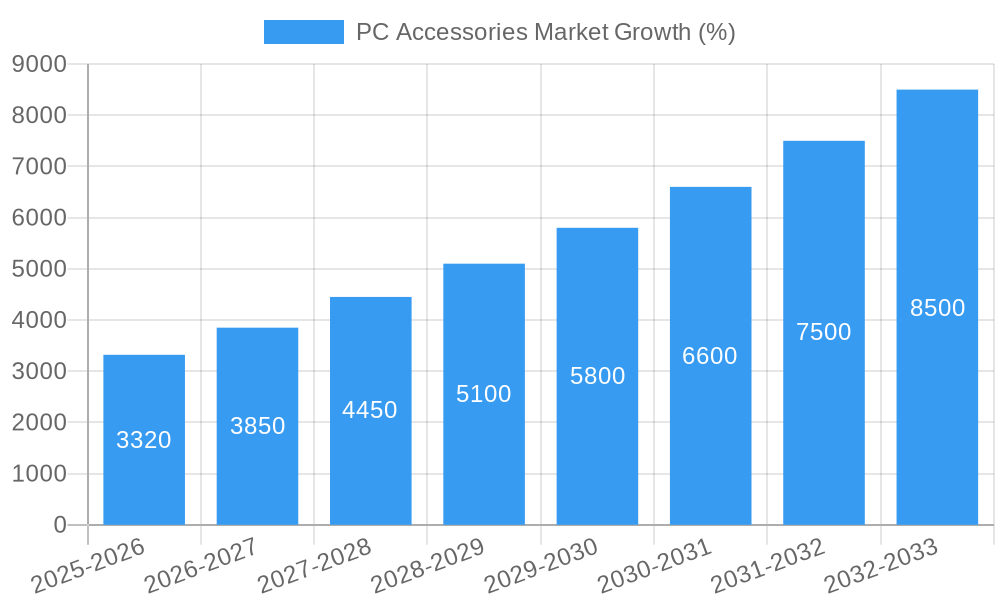
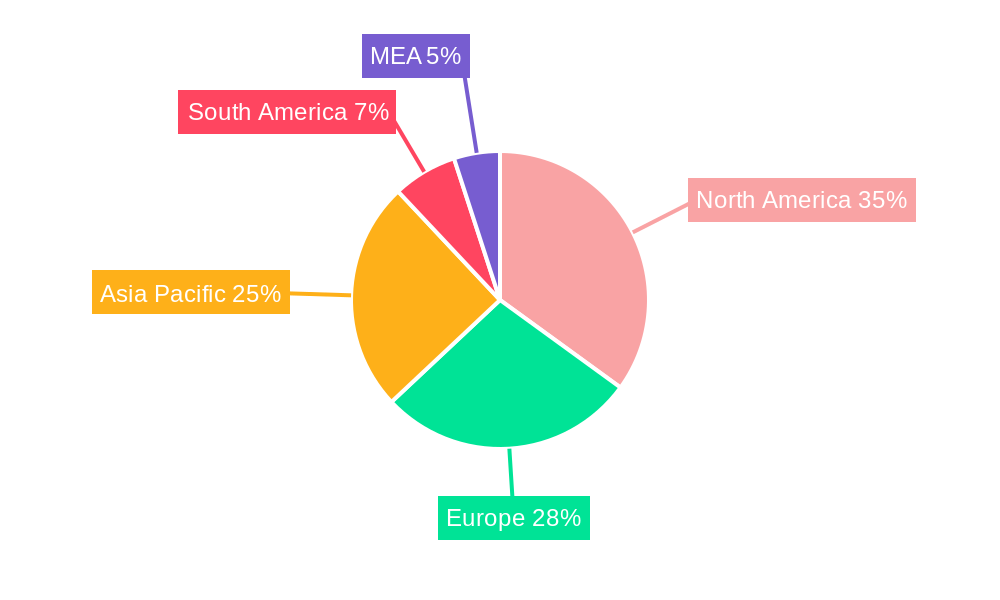
The global PC accessories market, valued at $27.58 billion in 2025, is projected to experience robust growth, driven by a compound annual growth rate (CAGR) of 12.13% from 2025 to 2033. This expansion is fueled by several key factors. The increasing popularity of gaming, both professionally and casually, significantly boosts demand for high-performance gaming peripherals like headsets, keyboards, and mice. Simultaneously, the rise of remote work and hybrid work models fuels the demand for ergonomic accessories such as monitor arms and comfortable gaming chairs, even within non-gaming contexts. Technological advancements, including the integration of advanced features in peripherals like RGB lighting, customizable macros, and improved audio quality, further enhance consumer appeal and drive market growth. Furthermore, the increasing adoption of advanced technologies in enterprise settings, such as virtual and augmented reality solutions, creates demand for specialized PC accessories, supporting market expansion. The market is segmented by product type (mice, keyboards, headsets, monitor arms, gaming chairs, webcams), encompassing both gaming and non-gaming (consumer and commercial) segments. Major players like Logitech, Razer, Corsair, and Dell dominate the market, constantly innovating to cater to evolving consumer preferences and technological advancements. Regional variations exist, with North America and Asia Pacific expected to hold significant market share due to higher PC penetration and consumer spending on electronics.
The competitive landscape is marked by intense rivalry among established players and emerging brands. Companies are focusing on strategic partnerships, product diversification, and technological advancements to maintain their market position. Marketing strategies emphasizing product features, brand building, and online sales channels play a significant role in market penetration. While the market faces potential restraints such as economic fluctuations and component shortages, the long-term growth trajectory remains positive, driven by the continuous demand for improved computing experiences across gaming, professional, and personal use cases. The forecast period (2025-2033) anticipates substantial market expansion, making it an attractive sector for investment and innovation. Continued growth hinges on the development of innovative and user-friendly accessories catering to a wider range of user needs and preferences.
PC Accessories Market: A Comprehensive Market Research Report (2019-2033)
This comprehensive report provides a detailed analysis of the PC Accessories market, encompassing its current state, future trends, and key players. With a focus on both gaming and non-gaming segments, this report offers invaluable insights for industry professionals, investors, and strategic decision-makers. The study period covers 2019-2033, with 2025 as the base year and a forecast period of 2025-2033. The report segments the market by product categories including Mice, Keyboards, Headsets, Monitor Arms, Gaming Chairs, and Webcams, examining both gaming and non-gaming (enterprise, consumer, and commercial) applications. Expected market value in Million units is provided throughout.
PC Accessories Market Dynamics & Structure
This section analyzes the market concentration, technological innovation drivers, regulatory frameworks, competitive product substitutes, end-user demographics, and M&A trends within the PC accessories market. The PC accessories market is characterized by a moderately concentrated landscape with a few major players holding significant market share. However, the presence of numerous smaller niche players contributes to intense competition.
- Market Concentration: The top 5 players hold approximately xx% of the market share in 2025, with a predicted xx% increase by 2033.
- Technological Innovation: Advancements in ergonomics, materials, and connectivity (e.g., wireless, Bluetooth 5.0) are key drivers. Innovation barriers include high R&D costs and the need for compatibility across diverse operating systems.
- Regulatory Frameworks: Compliance with safety and environmental regulations (e.g., RoHS, REACH) impacts production and pricing.
- Competitive Product Substitutes: The rise of mobile devices and cloud computing poses a challenge, while the growing popularity of gaming and remote work creates opportunities.
- End-User Demographics: The market caters to a broad demographic, including gamers, professionals, students, and home users, with varying needs and preferences.
- M&A Trends: The number of M&A deals in the PC accessories sector averaged xx per year during the historical period (2019-2024), driven by expansion strategies and technological integration.
PC Accessories Market Growth Trends & Insights
The PC accessories market experienced substantial growth during the historical period (2019-2024), driven by factors including the increased adoption of PCs for work and leisure, the rise of e-sports, and ongoing technological advancements. The market is projected to maintain a strong growth trajectory during the forecast period (2025-2033), with a Compound Annual Growth Rate (CAGR) of xx%. Market penetration in key segments like gaming headsets and gaming chairs is expected to increase significantly. Technological disruptions, such as the integration of AI and advanced sensors into PC accessories, are further fueling market expansion. Consumer behavior shifts towards premium products with enhanced features and personalized experiences are also influencing growth.
Dominant Regions, Countries, or Segments in PC Accessories Market
North America currently dominates the PC accessories market, driven by high PC penetration rates and a strong gaming culture. However, the Asia-Pacific region is projected to witness the fastest growth in the coming years, fueled by rising disposable incomes and increasing internet and smartphone penetration. Within product segments, the gaming headset market shows particularly strong growth potential, followed by gaming mice and keyboards.
- Key Drivers:
- North America: High disposable income, strong gaming community, early adoption of new technologies.
- Asia-Pacific: Rapid economic growth, increasing urbanization, rising internet penetration.
- Dominant Segments:
- Gaming Headsets: Projected CAGR of xx% driven by the immersive experience and rising popularity of esports.
- Gaming Mice: Strong demand due to the need for precision and customization in gaming.
- Gaming Keyboards: Growth fueled by preferences for mechanical keyboards and RGB lighting features.
PC Accessories Market Product Landscape
The PC accessories market offers a diverse range of products catering to varied user needs. Recent innovations focus on improved ergonomics, advanced connectivity, customization options, and integration with smart home ecosystems. For instance, advanced gaming mice feature high DPI sensors and programmable buttons, while high-end headsets provide superior audio quality and noise cancellation. Many manufacturers are incorporating RGB lighting and software customization for enhanced user experiences.
Key Drivers, Barriers & Challenges in PC Accessories Market
Key Drivers:
The rising popularity of gaming and esports, increased remote work and online learning, advancements in PC technology and connectivity, and growing consumer demand for ergonomic and aesthetically pleasing accessories are major driving forces.
Key Challenges:
Intense competition from numerous players, fluctuating raw material prices, supply chain disruptions, and evolving consumer preferences pose significant challenges. The impact of these challenges on market growth is estimated at xx% in 2025, but strategic management of supply chains and product innovation can mitigate these risks.
Emerging Opportunities in PC Accessories Market
Emerging opportunities lie in the integration of AI and IoT technologies, the development of sustainable and eco-friendly products, the expansion into untapped markets (e.g., emerging economies), and the creation of personalized accessories tailored to specific user profiles. The untapped potential in the metaverse and virtual reality (VR) gaming accessories market presents a significant opportunity for growth.
Growth Accelerators in the PC Accessories Market Industry
Technological advancements, strategic partnerships to expand distribution channels, and the launch of innovative products with unique features are key accelerators of long-term growth. The strategic expansion of e-commerce channels and direct-to-consumer sales models, along with the exploration of new and niche markets, is also predicted to fuel future growth.
Key Players Shaping the PC Accessories Market Market
- Alienware (Dell)
- Corsair Gaming Inc
- Mad Catz Global Limited
- JBL (Harman International Industries Incorporate)
- Turtle Beach Corporation
- Microsoft Corporation
- Nintendo Co Ltd
- Koninklijke Philips NV
- Cooler Master Co Ltd (CMC)
- Sennheiser Electronic GmbH & Co KG
- AOC Internationa
- Razer Inc
- Reddragon (Eastern Times Technology Co Ltd)
- Logitech International SA
- Sony Corporation
Notable Milestones in PC Accessories Market Sector
- April 2024: Qualcomm Technologies, Inc. launches Snapdragon X Plus, delivering up to 37% faster CPU performance and 54% less power consumption, impacting the performance of PC accessories with integrated processors.
- January 2024: Lenovo launches over 40 new AI-powered devices, influencing the design and features of future PC accessories.
In-Depth PC Accessories Market Market Outlook
The PC accessories market holds immense future potential, driven by continuous technological advancements, evolving consumer preferences, and the expansion into new applications. Strategic partnerships, targeted product development focusing on niche segments, and a focus on customer experience are key aspects for continued growth and success in this dynamic market. The predicted increase in market value combined with innovative applications will solidify the importance of this market into the future.
PC Accessories Market Segmentation
-
1. Product
-
1.1. Mice
- 1.1.1. Gaming
- 1.1.2. Non-gaming (Enterprise and Consumer)
- 1.2. Keyboard
-
1.3. Headset
- 1.3.1. Gaming and Personal
- 1.3.2. Non-gaming (Commercial)
- 1.4. Monitor Arms
- 1.5. Gaming Chairs
- 1.6. Webcams
-
1.1. Mice
PC Accessories Market Segmentation By Geography
-
1. North America
- 1.1. United States
- 1.2. Canada
-
2. Europe
- 2.1. Germany
- 2.2. United Kingdom
- 2.3. France
- 2.4. Italy
- 2.5. Russia
- 2.6. Switzerland
-
3. Asia Pacific
- 3.1. China
- 3.2. Japan
- 3.3. South Korea
- 3.4. Australia and New Zealand
-
4. Latin America
- 4.1. Brazil
- 4.2. Mexico
-
5. Middle East and Africa
- 5.1. United Arab Emirates
- 5.2. Saudi Arabia
- 5.3. South Africa
PC Accessories Market REPORT HIGHLIGHTS
| Aspects | Details |
|---|---|
| Study Period | 2019-2033 |
| Base Year | 2024 |
| Estimated Year | 2025 |
| Forecast Period | 2025-2033 |
| Historical Period | 2019-2024 |
| Growth Rate | CAGR of 12.13% from 2019-2033 |
| Segmentation |
|
Table of Contents
- 1. Introduction
- 1.1. Research Scope
- 1.2. Market Segmentation
- 1.3. Research Methodology
- 1.4. Definitions and Assumptions
- 2. Executive Summary
- 2.1. Introduction
- 3. Market Dynamics
- 3.1. Introduction
- 3.2. Market Drivers
- 3.2.1 Rising Adoption of Wireless Technologies; Emergence of Technologies Such as AR
- 3.2.2 VR
- 3.2.3 and AI; Adoption of Gaming Platforms Such as E-sports
- 3.3. Market Restrains
- 3.3.1. Fluctuation in the Production of Silicon Chips is Leading to a Shortage in the Demand for Gaming Accessories
- 3.4. Market Trends
- 3.4.1 Emergence of Technologies such as AR
- 3.4.2 VR
- 3.4.3 and AI to Drive the Market
- 4. Market Factor Analysis
- 4.1. Porters Five Forces
- 4.2. Supply/Value Chain
- 4.3. PESTEL analysis
- 4.4. Market Entropy
- 4.5. Patent/Trademark Analysis
- 5. Global PC Accessories Market Analysis, Insights and Forecast, 2019-2031
- 5.1. Market Analysis, Insights and Forecast - by Product
- 5.1.1. Mice
- 5.1.1.1. Gaming
- 5.1.1.2. Non-gaming (Enterprise and Consumer)
- 5.1.2. Keyboard
- 5.1.3. Headset
- 5.1.3.1. Gaming and Personal
- 5.1.3.2. Non-gaming (Commercial)
- 5.1.4. Monitor Arms
- 5.1.5. Gaming Chairs
- 5.1.6. Webcams
- 5.1.1. Mice
- 5.2. Market Analysis, Insights and Forecast - by Region
- 5.2.1. North America
- 5.2.2. Europe
- 5.2.3. Asia Pacific
- 5.2.4. Latin America
- 5.2.5. Middle East and Africa
- 5.1. Market Analysis, Insights and Forecast - by Product
- 6. North America PC Accessories Market Analysis, Insights and Forecast, 2019-2031
- 6.1. Market Analysis, Insights and Forecast - by Product
- 6.1.1. Mice
- 6.1.1.1. Gaming
- 6.1.1.2. Non-gaming (Enterprise and Consumer)
- 6.1.2. Keyboard
- 6.1.3. Headset
- 6.1.3.1. Gaming and Personal
- 6.1.3.2. Non-gaming (Commercial)
- 6.1.4. Monitor Arms
- 6.1.5. Gaming Chairs
- 6.1.6. Webcams
- 6.1.1. Mice
- 6.1. Market Analysis, Insights and Forecast - by Product
- 7. Europe PC Accessories Market Analysis, Insights and Forecast, 2019-2031
- 7.1. Market Analysis, Insights and Forecast - by Product
- 7.1.1. Mice
- 7.1.1.1. Gaming
- 7.1.1.2. Non-gaming (Enterprise and Consumer)
- 7.1.2. Keyboard
- 7.1.3. Headset
- 7.1.3.1. Gaming and Personal
- 7.1.3.2. Non-gaming (Commercial)
- 7.1.4. Monitor Arms
- 7.1.5. Gaming Chairs
- 7.1.6. Webcams
- 7.1.1. Mice
- 7.1. Market Analysis, Insights and Forecast - by Product
- 8. Asia Pacific PC Accessories Market Analysis, Insights and Forecast, 2019-2031
- 8.1. Market Analysis, Insights and Forecast - by Product
- 8.1.1. Mice
- 8.1.1.1. Gaming
- 8.1.1.2. Non-gaming (Enterprise and Consumer)
- 8.1.2. Keyboard
- 8.1.3. Headset
- 8.1.3.1. Gaming and Personal
- 8.1.3.2. Non-gaming (Commercial)
- 8.1.4. Monitor Arms
- 8.1.5. Gaming Chairs
- 8.1.6. Webcams
- 8.1.1. Mice
- 8.1. Market Analysis, Insights and Forecast - by Product
- 9. Latin America PC Accessories Market Analysis, Insights and Forecast, 2019-2031
- 9.1. Market Analysis, Insights and Forecast - by Product
- 9.1.1. Mice
- 9.1.1.1. Gaming
- 9.1.1.2. Non-gaming (Enterprise and Consumer)
- 9.1.2. Keyboard
- 9.1.3. Headset
- 9.1.3.1. Gaming and Personal
- 9.1.3.2. Non-gaming (Commercial)
- 9.1.4. Monitor Arms
- 9.1.5. Gaming Chairs
- 9.1.6. Webcams
- 9.1.1. Mice
- 9.1. Market Analysis, Insights and Forecast - by Product
- 10. Middle East and Africa PC Accessories Market Analysis, Insights and Forecast, 2019-2031
- 10.1. Market Analysis, Insights and Forecast - by Product
- 10.1.1. Mice
- 10.1.1.1. Gaming
- 10.1.1.2. Non-gaming (Enterprise and Consumer)
- 10.1.2. Keyboard
- 10.1.3. Headset
- 10.1.3.1. Gaming and Personal
- 10.1.3.2. Non-gaming (Commercial)
- 10.1.4. Monitor Arms
- 10.1.5. Gaming Chairs
- 10.1.6. Webcams
- 10.1.1. Mice
- 10.1. Market Analysis, Insights and Forecast - by Product
- 11. North America PC Accessories Market Analysis, Insights and Forecast, 2019-2031
- 11.1. Market Analysis, Insights and Forecast - By Country/Sub-region
- 11.1.1 United States
- 11.1.2 Canada
- 11.1.3 Mexico
- 12. Europe PC Accessories Market Analysis, Insights and Forecast, 2019-2031
- 12.1. Market Analysis, Insights and Forecast - By Country/Sub-region
- 12.1.1 Germany
- 12.1.2 United Kingdom
- 12.1.3 France
- 12.1.4 Spain
- 12.1.5 Italy
- 12.1.6 Spain
- 12.1.7 Belgium
- 12.1.8 Netherland
- 12.1.9 Nordics
- 12.1.10 Rest of Europe
- 13. Asia Pacific PC Accessories Market Analysis, Insights and Forecast, 2019-2031
- 13.1. Market Analysis, Insights and Forecast - By Country/Sub-region
- 13.1.1 China
- 13.1.2 Japan
- 13.1.3 India
- 13.1.4 South Korea
- 13.1.5 Southeast Asia
- 13.1.6 Australia
- 13.1.7 Indonesia
- 13.1.8 Phillipes
- 13.1.9 Singapore
- 13.1.10 Thailandc
- 13.1.11 Rest of Asia Pacific
- 14. South America PC Accessories Market Analysis, Insights and Forecast, 2019-2031
- 14.1. Market Analysis, Insights and Forecast - By Country/Sub-region
- 14.1.1 Brazil
- 14.1.2 Argentina
- 14.1.3 Peru
- 14.1.4 Chile
- 14.1.5 Colombia
- 14.1.6 Ecuador
- 14.1.7 Venezuela
- 14.1.8 Rest of South America
- 15. North America PC Accessories Market Analysis, Insights and Forecast, 2019-2031
- 15.1. Market Analysis, Insights and Forecast - By Country/Sub-region
- 15.1.1 United States
- 15.1.2 Canada
- 15.1.3 Mexico
- 16. MEA PC Accessories Market Analysis, Insights and Forecast, 2019-2031
- 16.1. Market Analysis, Insights and Forecast - By Country/Sub-region
- 16.1.1 United Arab Emirates
- 16.1.2 Saudi Arabia
- 16.1.3 South Africa
- 16.1.4 Rest of Middle East and Africa
- 17. Competitive Analysis
- 17.1. Global Market Share Analysis 2024
- 17.2. Company Profiles
- 17.2.1 Alienware (Dell)
- 17.2.1.1. Overview
- 17.2.1.2. Products
- 17.2.1.3. SWOT Analysis
- 17.2.1.4. Recent Developments
- 17.2.1.5. Financials (Based on Availability)
- 17.2.2 Corsair Gaming Inc
- 17.2.2.1. Overview
- 17.2.2.2. Products
- 17.2.2.3. SWOT Analysis
- 17.2.2.4. Recent Developments
- 17.2.2.5. Financials (Based on Availability)
- 17.2.3 Mad Catz Global Limited
- 17.2.3.1. Overview
- 17.2.3.2. Products
- 17.2.3.3. SWOT Analysis
- 17.2.3.4. Recent Developments
- 17.2.3.5. Financials (Based on Availability)
- 17.2.4 JBL (Harman International Industries Incorporate)
- 17.2.4.1. Overview
- 17.2.4.2. Products
- 17.2.4.3. SWOT Analysis
- 17.2.4.4. Recent Developments
- 17.2.4.5. Financials (Based on Availability)
- 17.2.5 Turtle Beach Corporation
- 17.2.5.1. Overview
- 17.2.5.2. Products
- 17.2.5.3. SWOT Analysis
- 17.2.5.4. Recent Developments
- 17.2.5.5. Financials (Based on Availability)
- 17.2.6 Microsoft Corporation
- 17.2.6.1. Overview
- 17.2.6.2. Products
- 17.2.6.3. SWOT Analysis
- 17.2.6.4. Recent Developments
- 17.2.6.5. Financials (Based on Availability)
- 17.2.7 Nintendo Co Ltd
- 17.2.7.1. Overview
- 17.2.7.2. Products
- 17.2.7.3. SWOT Analysis
- 17.2.7.4. Recent Developments
- 17.2.7.5. Financials (Based on Availability)
- 17.2.8 Koninklijke Philips NV
- 17.2.8.1. Overview
- 17.2.8.2. Products
- 17.2.8.3. SWOT Analysis
- 17.2.8.4. Recent Developments
- 17.2.8.5. Financials (Based on Availability)
- 17.2.9 Cooler Master Co Ltd (CMC)
- 17.2.9.1. Overview
- 17.2.9.2. Products
- 17.2.9.3. SWOT Analysis
- 17.2.9.4. Recent Developments
- 17.2.9.5. Financials (Based on Availability)
- 17.2.10 Sennheiser Electronic GmbH & Co KG
- 17.2.10.1. Overview
- 17.2.10.2. Products
- 17.2.10.3. SWOT Analysis
- 17.2.10.4. Recent Developments
- 17.2.10.5. Financials (Based on Availability)
- 17.2.11 AOC Internationa
- 17.2.11.1. Overview
- 17.2.11.2. Products
- 17.2.11.3. SWOT Analysis
- 17.2.11.4. Recent Developments
- 17.2.11.5. Financials (Based on Availability)
- 17.2.12 Razer Inc
- 17.2.12.1. Overview
- 17.2.12.2. Products
- 17.2.12.3. SWOT Analysis
- 17.2.12.4. Recent Developments
- 17.2.12.5. Financials (Based on Availability)
- 17.2.13 Reddragon (Eastern Times Technology Co Ltd)
- 17.2.13.1. Overview
- 17.2.13.2. Products
- 17.2.13.3. SWOT Analysis
- 17.2.13.4. Recent Developments
- 17.2.13.5. Financials (Based on Availability)
- 17.2.14 Logitech International SA
- 17.2.14.1. Overview
- 17.2.14.2. Products
- 17.2.14.3. SWOT Analysis
- 17.2.14.4. Recent Developments
- 17.2.14.5. Financials (Based on Availability)
- 17.2.15 Sony Corporation
- 17.2.15.1. Overview
- 17.2.15.2. Products
- 17.2.15.3. SWOT Analysis
- 17.2.15.4. Recent Developments
- 17.2.15.5. Financials (Based on Availability)
- 17.2.1 Alienware (Dell)
List of Figures
- Figure 1: Global PC Accessories Market Revenue Breakdown (Million, %) by Region 2024 & 2032
- Figure 2: Global PC Accessories Market Volume Breakdown (K Unit, %) by Region 2024 & 2032
- Figure 3: North America PC Accessories Market Revenue (Million), by Country 2024 & 2032
- Figure 4: North America PC Accessories Market Volume (K Unit), by Country 2024 & 2032
- Figure 5: North America PC Accessories Market Revenue Share (%), by Country 2024 & 2032
- Figure 6: North America PC Accessories Market Volume Share (%), by Country 2024 & 2032
- Figure 7: Europe PC Accessories Market Revenue (Million), by Country 2024 & 2032
- Figure 8: Europe PC Accessories Market Volume (K Unit), by Country 2024 & 2032
- Figure 9: Europe PC Accessories Market Revenue Share (%), by Country 2024 & 2032
- Figure 10: Europe PC Accessories Market Volume Share (%), by Country 2024 & 2032
- Figure 11: Asia Pacific PC Accessories Market Revenue (Million), by Country 2024 & 2032
- Figure 12: Asia Pacific PC Accessories Market Volume (K Unit), by Country 2024 & 2032
- Figure 13: Asia Pacific PC Accessories Market Revenue Share (%), by Country 2024 & 2032
- Figure 14: Asia Pacific PC Accessories Market Volume Share (%), by Country 2024 & 2032
- Figure 15: South America PC Accessories Market Revenue (Million), by Country 2024 & 2032
- Figure 16: South America PC Accessories Market Volume (K Unit), by Country 2024 & 2032
- Figure 17: South America PC Accessories Market Revenue Share (%), by Country 2024 & 2032
- Figure 18: South America PC Accessories Market Volume Share (%), by Country 2024 & 2032
- Figure 19: North America PC Accessories Market Revenue (Million), by Country 2024 & 2032
- Figure 20: North America PC Accessories Market Volume (K Unit), by Country 2024 & 2032
- Figure 21: North America PC Accessories Market Revenue Share (%), by Country 2024 & 2032
- Figure 22: North America PC Accessories Market Volume Share (%), by Country 2024 & 2032
- Figure 23: MEA PC Accessories Market Revenue (Million), by Country 2024 & 2032
- Figure 24: MEA PC Accessories Market Volume (K Unit), by Country 2024 & 2032
- Figure 25: MEA PC Accessories Market Revenue Share (%), by Country 2024 & 2032
- Figure 26: MEA PC Accessories Market Volume Share (%), by Country 2024 & 2032
- Figure 27: North America PC Accessories Market Revenue (Million), by Product 2024 & 2032
- Figure 28: North America PC Accessories Market Volume (K Unit), by Product 2024 & 2032
- Figure 29: North America PC Accessories Market Revenue Share (%), by Product 2024 & 2032
- Figure 30: North America PC Accessories Market Volume Share (%), by Product 2024 & 2032
- Figure 31: North America PC Accessories Market Revenue (Million), by Country 2024 & 2032
- Figure 32: North America PC Accessories Market Volume (K Unit), by Country 2024 & 2032
- Figure 33: North America PC Accessories Market Revenue Share (%), by Country 2024 & 2032
- Figure 34: North America PC Accessories Market Volume Share (%), by Country 2024 & 2032
- Figure 35: Europe PC Accessories Market Revenue (Million), by Product 2024 & 2032
- Figure 36: Europe PC Accessories Market Volume (K Unit), by Product 2024 & 2032
- Figure 37: Europe PC Accessories Market Revenue Share (%), by Product 2024 & 2032
- Figure 38: Europe PC Accessories Market Volume Share (%), by Product 2024 & 2032
- Figure 39: Europe PC Accessories Market Revenue (Million), by Country 2024 & 2032
- Figure 40: Europe PC Accessories Market Volume (K Unit), by Country 2024 & 2032
- Figure 41: Europe PC Accessories Market Revenue Share (%), by Country 2024 & 2032
- Figure 42: Europe PC Accessories Market Volume Share (%), by Country 2024 & 2032
- Figure 43: Asia Pacific PC Accessories Market Revenue (Million), by Product 2024 & 2032
- Figure 44: Asia Pacific PC Accessories Market Volume (K Unit), by Product 2024 & 2032
- Figure 45: Asia Pacific PC Accessories Market Revenue Share (%), by Product 2024 & 2032
- Figure 46: Asia Pacific PC Accessories Market Volume Share (%), by Product 2024 & 2032
- Figure 47: Asia Pacific PC Accessories Market Revenue (Million), by Country 2024 & 2032
- Figure 48: Asia Pacific PC Accessories Market Volume (K Unit), by Country 2024 & 2032
- Figure 49: Asia Pacific PC Accessories Market Revenue Share (%), by Country 2024 & 2032
- Figure 50: Asia Pacific PC Accessories Market Volume Share (%), by Country 2024 & 2032
- Figure 51: Latin America PC Accessories Market Revenue (Million), by Product 2024 & 2032
- Figure 52: Latin America PC Accessories Market Volume (K Unit), by Product 2024 & 2032
- Figure 53: Latin America PC Accessories Market Revenue Share (%), by Product 2024 & 2032
- Figure 54: Latin America PC Accessories Market Volume Share (%), by Product 2024 & 2032
- Figure 55: Latin America PC Accessories Market Revenue (Million), by Country 2024 & 2032
- Figure 56: Latin America PC Accessories Market Volume (K Unit), by Country 2024 & 2032
- Figure 57: Latin America PC Accessories Market Revenue Share (%), by Country 2024 & 2032
- Figure 58: Latin America PC Accessories Market Volume Share (%), by Country 2024 & 2032
- Figure 59: Middle East and Africa PC Accessories Market Revenue (Million), by Product 2024 & 2032
- Figure 60: Middle East and Africa PC Accessories Market Volume (K Unit), by Product 2024 & 2032
- Figure 61: Middle East and Africa PC Accessories Market Revenue Share (%), by Product 2024 & 2032
- Figure 62: Middle East and Africa PC Accessories Market Volume Share (%), by Product 2024 & 2032
- Figure 63: Middle East and Africa PC Accessories Market Revenue (Million), by Country 2024 & 2032
- Figure 64: Middle East and Africa PC Accessories Market Volume (K Unit), by Country 2024 & 2032
- Figure 65: Middle East and Africa PC Accessories Market Revenue Share (%), by Country 2024 & 2032
- Figure 66: Middle East and Africa PC Accessories Market Volume Share (%), by Country 2024 & 2032
List of Tables
- Table 1: Global PC Accessories Market Revenue Million Forecast, by Region 2019 & 2032
- Table 2: Global PC Accessories Market Volume K Unit Forecast, by Region 2019 & 2032
- Table 3: Global PC Accessories Market Revenue Million Forecast, by Product 2019 & 2032
- Table 4: Global PC Accessories Market Volume K Unit Forecast, by Product 2019 & 2032
- Table 5: Global PC Accessories Market Revenue Million Forecast, by Region 2019 & 2032
- Table 6: Global PC Accessories Market Volume K Unit Forecast, by Region 2019 & 2032
- Table 7: Global PC Accessories Market Revenue Million Forecast, by Country 2019 & 2032
- Table 8: Global PC Accessories Market Volume K Unit Forecast, by Country 2019 & 2032
- Table 9: United States PC Accessories Market Revenue (Million) Forecast, by Application 2019 & 2032
- Table 10: United States PC Accessories Market Volume (K Unit) Forecast, by Application 2019 & 2032
- Table 11: Canada PC Accessories Market Revenue (Million) Forecast, by Application 2019 & 2032
- Table 12: Canada PC Accessories Market Volume (K Unit) Forecast, by Application 2019 & 2032
- Table 13: Mexico PC Accessories Market Revenue (Million) Forecast, by Application 2019 & 2032
- Table 14: Mexico PC Accessories Market Volume (K Unit) Forecast, by Application 2019 & 2032
- Table 15: Global PC Accessories Market Revenue Million Forecast, by Country 2019 & 2032
- Table 16: Global PC Accessories Market Volume K Unit Forecast, by Country 2019 & 2032
- Table 17: Germany PC Accessories Market Revenue (Million) Forecast, by Application 2019 & 2032
- Table 18: Germany PC Accessories Market Volume (K Unit) Forecast, by Application 2019 & 2032
- Table 19: United Kingdom PC Accessories Market Revenue (Million) Forecast, by Application 2019 & 2032
- Table 20: United Kingdom PC Accessories Market Volume (K Unit) Forecast, by Application 2019 & 2032
- Table 21: France PC Accessories Market Revenue (Million) Forecast, by Application 2019 & 2032
- Table 22: France PC Accessories Market Volume (K Unit) Forecast, by Application 2019 & 2032
- Table 23: Spain PC Accessories Market Revenue (Million) Forecast, by Application 2019 & 2032
- Table 24: Spain PC Accessories Market Volume (K Unit) Forecast, by Application 2019 & 2032
- Table 25: Italy PC Accessories Market Revenue (Million) Forecast, by Application 2019 & 2032
- Table 26: Italy PC Accessories Market Volume (K Unit) Forecast, by Application 2019 & 2032
- Table 27: Spain PC Accessories Market Revenue (Million) Forecast, by Application 2019 & 2032
- Table 28: Spain PC Accessories Market Volume (K Unit) Forecast, by Application 2019 & 2032
- Table 29: Belgium PC Accessories Market Revenue (Million) Forecast, by Application 2019 & 2032
- Table 30: Belgium PC Accessories Market Volume (K Unit) Forecast, by Application 2019 & 2032
- Table 31: Netherland PC Accessories Market Revenue (Million) Forecast, by Application 2019 & 2032
- Table 32: Netherland PC Accessories Market Volume (K Unit) Forecast, by Application 2019 & 2032
- Table 33: Nordics PC Accessories Market Revenue (Million) Forecast, by Application 2019 & 2032
- Table 34: Nordics PC Accessories Market Volume (K Unit) Forecast, by Application 2019 & 2032
- Table 35: Rest of Europe PC Accessories Market Revenue (Million) Forecast, by Application 2019 & 2032
- Table 36: Rest of Europe PC Accessories Market Volume (K Unit) Forecast, by Application 2019 & 2032
- Table 37: Global PC Accessories Market Revenue Million Forecast, by Country 2019 & 2032
- Table 38: Global PC Accessories Market Volume K Unit Forecast, by Country 2019 & 2032
- Table 39: China PC Accessories Market Revenue (Million) Forecast, by Application 2019 & 2032
- Table 40: China PC Accessories Market Volume (K Unit) Forecast, by Application 2019 & 2032
- Table 41: Japan PC Accessories Market Revenue (Million) Forecast, by Application 2019 & 2032
- Table 42: Japan PC Accessories Market Volume (K Unit) Forecast, by Application 2019 & 2032
- Table 43: India PC Accessories Market Revenue (Million) Forecast, by Application 2019 & 2032
- Table 44: India PC Accessories Market Volume (K Unit) Forecast, by Application 2019 & 2032
- Table 45: South Korea PC Accessories Market Revenue (Million) Forecast, by Application 2019 & 2032
- Table 46: South Korea PC Accessories Market Volume (K Unit) Forecast, by Application 2019 & 2032
- Table 47: Southeast Asia PC Accessories Market Revenue (Million) Forecast, by Application 2019 & 2032
- Table 48: Southeast Asia PC Accessories Market Volume (K Unit) Forecast, by Application 2019 & 2032
- Table 49: Australia PC Accessories Market Revenue (Million) Forecast, by Application 2019 & 2032
- Table 50: Australia PC Accessories Market Volume (K Unit) Forecast, by Application 2019 & 2032
- Table 51: Indonesia PC Accessories Market Revenue (Million) Forecast, by Application 2019 & 2032
- Table 52: Indonesia PC Accessories Market Volume (K Unit) Forecast, by Application 2019 & 2032
- Table 53: Phillipes PC Accessories Market Revenue (Million) Forecast, by Application 2019 & 2032
- Table 54: Phillipes PC Accessories Market Volume (K Unit) Forecast, by Application 2019 & 2032
- Table 55: Singapore PC Accessories Market Revenue (Million) Forecast, by Application 2019 & 2032
- Table 56: Singapore PC Accessories Market Volume (K Unit) Forecast, by Application 2019 & 2032
- Table 57: Thailandc PC Accessories Market Revenue (Million) Forecast, by Application 2019 & 2032
- Table 58: Thailandc PC Accessories Market Volume (K Unit) Forecast, by Application 2019 & 2032
- Table 59: Rest of Asia Pacific PC Accessories Market Revenue (Million) Forecast, by Application 2019 & 2032
- Table 60: Rest of Asia Pacific PC Accessories Market Volume (K Unit) Forecast, by Application 2019 & 2032
- Table 61: Global PC Accessories Market Revenue Million Forecast, by Country 2019 & 2032
- Table 62: Global PC Accessories Market Volume K Unit Forecast, by Country 2019 & 2032
- Table 63: Brazil PC Accessories Market Revenue (Million) Forecast, by Application 2019 & 2032
- Table 64: Brazil PC Accessories Market Volume (K Unit) Forecast, by Application 2019 & 2032
- Table 65: Argentina PC Accessories Market Revenue (Million) Forecast, by Application 2019 & 2032
- Table 66: Argentina PC Accessories Market Volume (K Unit) Forecast, by Application 2019 & 2032
- Table 67: Peru PC Accessories Market Revenue (Million) Forecast, by Application 2019 & 2032
- Table 68: Peru PC Accessories Market Volume (K Unit) Forecast, by Application 2019 & 2032
- Table 69: Chile PC Accessories Market Revenue (Million) Forecast, by Application 2019 & 2032
- Table 70: Chile PC Accessories Market Volume (K Unit) Forecast, by Application 2019 & 2032
- Table 71: Colombia PC Accessories Market Revenue (Million) Forecast, by Application 2019 & 2032
- Table 72: Colombia PC Accessories Market Volume (K Unit) Forecast, by Application 2019 & 2032
- Table 73: Ecuador PC Accessories Market Revenue (Million) Forecast, by Application 2019 & 2032
- Table 74: Ecuador PC Accessories Market Volume (K Unit) Forecast, by Application 2019 & 2032
- Table 75: Venezuela PC Accessories Market Revenue (Million) Forecast, by Application 2019 & 2032
- Table 76: Venezuela PC Accessories Market Volume (K Unit) Forecast, by Application 2019 & 2032
- Table 77: Rest of South America PC Accessories Market Revenue (Million) Forecast, by Application 2019 & 2032
- Table 78: Rest of South America PC Accessories Market Volume (K Unit) Forecast, by Application 2019 & 2032
- Table 79: Global PC Accessories Market Revenue Million Forecast, by Country 2019 & 2032
- Table 80: Global PC Accessories Market Volume K Unit Forecast, by Country 2019 & 2032
- Table 81: United States PC Accessories Market Revenue (Million) Forecast, by Application 2019 & 2032
- Table 82: United States PC Accessories Market Volume (K Unit) Forecast, by Application 2019 & 2032
- Table 83: Canada PC Accessories Market Revenue (Million) Forecast, by Application 2019 & 2032
- Table 84: Canada PC Accessories Market Volume (K Unit) Forecast, by Application 2019 & 2032
- Table 85: Mexico PC Accessories Market Revenue (Million) Forecast, by Application 2019 & 2032
- Table 86: Mexico PC Accessories Market Volume (K Unit) Forecast, by Application 2019 & 2032
- Table 87: Global PC Accessories Market Revenue Million Forecast, by Country 2019 & 2032
- Table 88: Global PC Accessories Market Volume K Unit Forecast, by Country 2019 & 2032
- Table 89: United Arab Emirates PC Accessories Market Revenue (Million) Forecast, by Application 2019 & 2032
- Table 90: United Arab Emirates PC Accessories Market Volume (K Unit) Forecast, by Application 2019 & 2032
- Table 91: Saudi Arabia PC Accessories Market Revenue (Million) Forecast, by Application 2019 & 2032
- Table 92: Saudi Arabia PC Accessories Market Volume (K Unit) Forecast, by Application 2019 & 2032
- Table 93: South Africa PC Accessories Market Revenue (Million) Forecast, by Application 2019 & 2032
- Table 94: South Africa PC Accessories Market Volume (K Unit) Forecast, by Application 2019 & 2032
- Table 95: Rest of Middle East and Africa PC Accessories Market Revenue (Million) Forecast, by Application 2019 & 2032
- Table 96: Rest of Middle East and Africa PC Accessories Market Volume (K Unit) Forecast, by Application 2019 & 2032
- Table 97: Global PC Accessories Market Revenue Million Forecast, by Product 2019 & 2032
- Table 98: Global PC Accessories Market Volume K Unit Forecast, by Product 2019 & 2032
- Table 99: Global PC Accessories Market Revenue Million Forecast, by Country 2019 & 2032
- Table 100: Global PC Accessories Market Volume K Unit Forecast, by Country 2019 & 2032
- Table 101: United States PC Accessories Market Revenue (Million) Forecast, by Application 2019 & 2032
- Table 102: United States PC Accessories Market Volume (K Unit) Forecast, by Application 2019 & 2032
- Table 103: Canada PC Accessories Market Revenue (Million) Forecast, by Application 2019 & 2032
- Table 104: Canada PC Accessories Market Volume (K Unit) Forecast, by Application 2019 & 2032
- Table 105: Global PC Accessories Market Revenue Million Forecast, by Product 2019 & 2032
- Table 106: Global PC Accessories Market Volume K Unit Forecast, by Product 2019 & 2032
- Table 107: Global PC Accessories Market Revenue Million Forecast, by Country 2019 & 2032
- Table 108: Global PC Accessories Market Volume K Unit Forecast, by Country 2019 & 2032
- Table 109: Germany PC Accessories Market Revenue (Million) Forecast, by Application 2019 & 2032
- Table 110: Germany PC Accessories Market Volume (K Unit) Forecast, by Application 2019 & 2032
- Table 111: United Kingdom PC Accessories Market Revenue (Million) Forecast, by Application 2019 & 2032
- Table 112: United Kingdom PC Accessories Market Volume (K Unit) Forecast, by Application 2019 & 2032
- Table 113: France PC Accessories Market Revenue (Million) Forecast, by Application 2019 & 2032
- Table 114: France PC Accessories Market Volume (K Unit) Forecast, by Application 2019 & 2032
- Table 115: Italy PC Accessories Market Revenue (Million) Forecast, by Application 2019 & 2032
- Table 116: Italy PC Accessories Market Volume (K Unit) Forecast, by Application 2019 & 2032
- Table 117: Russia PC Accessories Market Revenue (Million) Forecast, by Application 2019 & 2032
- Table 118: Russia PC Accessories Market Volume (K Unit) Forecast, by Application 2019 & 2032
- Table 119: Switzerland PC Accessories Market Revenue (Million) Forecast, by Application 2019 & 2032
- Table 120: Switzerland PC Accessories Market Volume (K Unit) Forecast, by Application 2019 & 2032
- Table 121: Global PC Accessories Market Revenue Million Forecast, by Product 2019 & 2032
- Table 122: Global PC Accessories Market Volume K Unit Forecast, by Product 2019 & 2032
- Table 123: Global PC Accessories Market Revenue Million Forecast, by Country 2019 & 2032
- Table 124: Global PC Accessories Market Volume K Unit Forecast, by Country 2019 & 2032
- Table 125: China PC Accessories Market Revenue (Million) Forecast, by Application 2019 & 2032
- Table 126: China PC Accessories Market Volume (K Unit) Forecast, by Application 2019 & 2032
- Table 127: Japan PC Accessories Market Revenue (Million) Forecast, by Application 2019 & 2032
- Table 128: Japan PC Accessories Market Volume (K Unit) Forecast, by Application 2019 & 2032
- Table 129: South Korea PC Accessories Market Revenue (Million) Forecast, by Application 2019 & 2032
- Table 130: South Korea PC Accessories Market Volume (K Unit) Forecast, by Application 2019 & 2032
- Table 131: Australia and New Zealand PC Accessories Market Revenue (Million) Forecast, by Application 2019 & 2032
- Table 132: Australia and New Zealand PC Accessories Market Volume (K Unit) Forecast, by Application 2019 & 2032
- Table 133: Global PC Accessories Market Revenue Million Forecast, by Product 2019 & 2032
- Table 134: Global PC Accessories Market Volume K Unit Forecast, by Product 2019 & 2032
- Table 135: Global PC Accessories Market Revenue Million Forecast, by Country 2019 & 2032
- Table 136: Global PC Accessories Market Volume K Unit Forecast, by Country 2019 & 2032
- Table 137: Brazil PC Accessories Market Revenue (Million) Forecast, by Application 2019 & 2032
- Table 138: Brazil PC Accessories Market Volume (K Unit) Forecast, by Application 2019 & 2032
- Table 139: Mexico PC Accessories Market Revenue (Million) Forecast, by Application 2019 & 2032
- Table 140: Mexico PC Accessories Market Volume (K Unit) Forecast, by Application 2019 & 2032
- Table 141: Global PC Accessories Market Revenue Million Forecast, by Product 2019 & 2032
- Table 142: Global PC Accessories Market Volume K Unit Forecast, by Product 2019 & 2032
- Table 143: Global PC Accessories Market Revenue Million Forecast, by Country 2019 & 2032
- Table 144: Global PC Accessories Market Volume K Unit Forecast, by Country 2019 & 2032
- Table 145: United Arab Emirates PC Accessories Market Revenue (Million) Forecast, by Application 2019 & 2032
- Table 146: United Arab Emirates PC Accessories Market Volume (K Unit) Forecast, by Application 2019 & 2032
- Table 147: Saudi Arabia PC Accessories Market Revenue (Million) Forecast, by Application 2019 & 2032
- Table 148: Saudi Arabia PC Accessories Market Volume (K Unit) Forecast, by Application 2019 & 2032
- Table 149: South Africa PC Accessories Market Revenue (Million) Forecast, by Application 2019 & 2032
- Table 150: South Africa PC Accessories Market Volume (K Unit) Forecast, by Application 2019 & 2032
Frequently Asked Questions
1. What is the projected Compound Annual Growth Rate (CAGR) of the PC Accessories Market?
The projected CAGR is approximately 12.13%.
2. Which companies are prominent players in the PC Accessories Market?
Key companies in the market include Alienware (Dell), Corsair Gaming Inc, Mad Catz Global Limited, JBL (Harman International Industries Incorporate), Turtle Beach Corporation, Microsoft Corporation, Nintendo Co Ltd, Koninklijke Philips NV, Cooler Master Co Ltd (CMC), Sennheiser Electronic GmbH & Co KG, AOC Internationa, Razer Inc, Reddragon (Eastern Times Technology Co Ltd), Logitech International SA, Sony Corporation.
3. What are the main segments of the PC Accessories Market?
The market segments include Product.
4. Can you provide details about the market size?
The market size is estimated to be USD 27.58 Million as of 2022.
5. What are some drivers contributing to market growth?
Rising Adoption of Wireless Technologies; Emergence of Technologies Such as AR. VR. and AI; Adoption of Gaming Platforms Such as E-sports.
6. What are the notable trends driving market growth?
Emergence of Technologies such as AR. VR. and AI to Drive the Market.
7. Are there any restraints impacting market growth?
Fluctuation in the Production of Silicon Chips is Leading to a Shortage in the Demand for Gaming Accessories.
8. Can you provide examples of recent developments in the market?
April 2024 - Qualcomm Technologies, Inc. expands the leading Snapdragon X Series platform portfolio with Snapdragon X Plus. Snapdragon X Plus features the advanced Qualcomm Oryon CPU, a custom-integrated processor that delivers up to 37% faster CPU performance than competitors while consuming up to 54% less power.
9. What pricing options are available for accessing the report?
Pricing options include single-user, multi-user, and enterprise licenses priced at USD 4750, USD 5250, and USD 8750 respectively.
10. Is the market size provided in terms of value or volume?
The market size is provided in terms of value, measured in Million and volume, measured in K Unit.
11. Are there any specific market keywords associated with the report?
Yes, the market keyword associated with the report is "PC Accessories Market," which aids in identifying and referencing the specific market segment covered.
12. How do I determine which pricing option suits my needs best?
The pricing options vary based on user requirements and access needs. Individual users may opt for single-user licenses, while businesses requiring broader access may choose multi-user or enterprise licenses for cost-effective access to the report.
13. Are there any additional resources or data provided in the PC Accessories Market report?
While the report offers comprehensive insights, it's advisable to review the specific contents or supplementary materials provided to ascertain if additional resources or data are available.
14. How can I stay updated on further developments or reports in the PC Accessories Market?
To stay informed about further developments, trends, and reports in the PC Accessories Market, consider subscribing to industry newsletters, following relevant companies and organizations, or regularly checking reputable industry news sources and publications.
Methodology
Step 1 - Identification of Relevant Samples Size from Population Database


Step 2 - Approaches for Defining Global Market Size (Value, Volume* & Price*)

Note*: In applicable scenarios
Step 3 - Data Sources
Primary Research
- Web Analytics
- Survey Reports
- Research Institute
- Latest Research Reports
- Opinion Leaders
Secondary Research
- Annual Reports
- White Paper
- Latest Press Release
- Industry Association
- Paid Database
- Investor Presentations

Step 4 - Data Triangulation
Involves using different sources of information in order to increase the validity of a study
These sources are likely to be stakeholders in a program - participants, other researchers, program staff, other community members, and so on.
Then we put all data in single framework & apply various statistical tools to find out the dynamic on the market.
During the analysis stage, feedback from the stakeholder groups would be compared to determine areas of agreement as well as areas of divergence


