

Key Insights
The global GNSS-Enabled Consumer Device market is poised for substantial expansion, projecting a market size of $335.04 billion by 2025, growing at a compound annual growth rate (CAGR) of 11.17%. This robust growth is underpinned by the increasing integration and affordability of GNSS technology in consumer electronics, including smartphones, wearables, and personal trackers. Surging demand for location-based services, fitness tracking, and asset management solutions is a primary market driver. The market is predominantly segmented by device type, with smartphones and wearables leading adoption due to the proliferation of location-aware applications. Key industry players such as Apple, Samsung, and Garmin are actively innovating, releasing advanced GNSS-enabled devices. Geographically, North America and Asia Pacific exhibit significant market presence, driven by high consumer electronics adoption and developed location-based service infrastructure. Emerging economies represent substantial future growth opportunities.
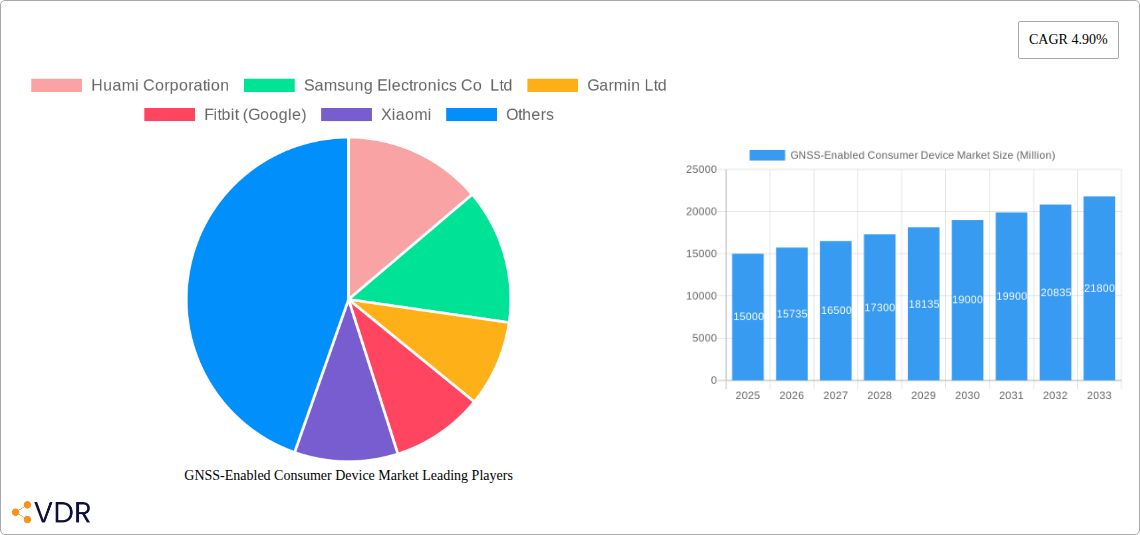
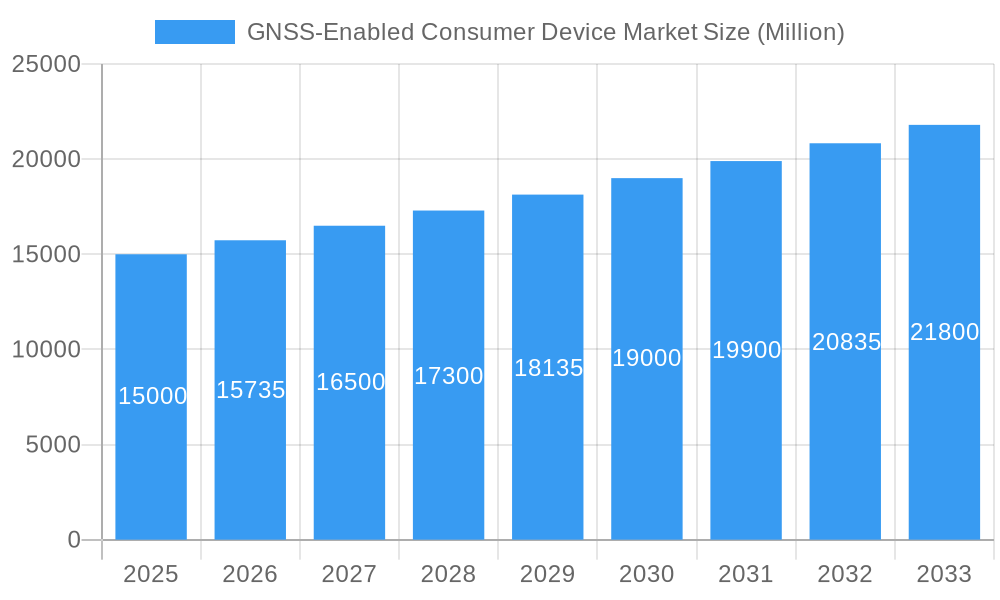
GNSS-Enabled Consumer Device Market Market Size (In Billion)
Despite a favorable outlook, the market encounters challenges including GNSS signal accuracy limitations due to environmental factors, intense competition impacting pricing, and potential data privacy concerns. Nevertheless, advancements in satellite constellations and power-efficient GNSS chips are set to mitigate these challenges. The convergence of GNSS with AI and IoT technologies will unlock new application avenues, driving future market evolution. Continued growth is anticipated, fueled by these technological synergies and persistent demand for location-centric services.
GNSS-Enabled Consumer Device Market Company Market Share
GNSS-Enabled Consumer Device Market: A Comprehensive Report (2019-2033)
This comprehensive report offers an in-depth analysis of the GNSS-Enabled Consumer Device market, encompassing its dynamics, growth trends, regional dominance, product landscape, challenges, and future outlook. The study period covers 2019-2033, with 2025 as the base and estimated year. The forecast period spans 2025-2033, and the historical period includes 2019-2024. This report is invaluable for industry professionals, investors, and strategists seeking to understand and capitalize on opportunities within this rapidly evolving market. The parent market is the broader consumer electronics market, while the child markets include smartphones, wearables, and tracking devices.
GNSS-Enabled Consumer Device Market Dynamics & Structure
This section analyzes the market's competitive landscape, technological advancements, regulatory influences, and market trends. We delve into market concentration, identifying key players and their market shares. The report also examines the impact of mergers and acquisitions (M&A) activity, quantifying deal volumes and assessing their influence on market structure. Technological innovation drivers, including advancements in GNSS technology and miniaturization, are explored, along with their implications for product development and market growth. Regulatory frameworks and their effects on market access and product compliance are also assessed. Finally, the report analyzes competitive product substitutes, consumer demographics, and future market dynamics.
- Market Concentration: The market is characterized by xx% concentration in the hands of top 5 players in 2025.
- M&A Activity: A total of xx M&A deals were recorded between 2019 and 2024, with an estimated xx deals predicted for 2025-2033.
- Technological Innovation: Key drivers include improvements in GNSS accuracy, power efficiency, and integration with other technologies like AI and IoT.
- Regulatory Landscape: Varying regional regulations regarding data privacy and spectrum allocation impact market dynamics.
- Competitive Substitutes: Alternative positioning technologies and services present competition.
GNSS-Enabled Consumer Device Market Growth Trends & Insights
This section provides a detailed analysis of market size evolution from 2019 to 2033, incorporating historical data and forecasting future growth. We examine adoption rates across various segments and geographical regions, analyzing factors influencing market penetration. The impact of technological disruptions, such as the introduction of new GNSS technologies and improved processing capabilities, is thoroughly examined. Furthermore, we explore shifts in consumer behavior, including evolving preferences for specific device types and functionalities. The analysis employs quantitative metrics, such as Compound Annual Growth Rate (CAGR) and market penetration rates, to provide a comprehensive understanding of the market's growth trajectory. The report leverages a combination of primary and secondary research methodologies (XXX) to ensure the accuracy and robustness of the analysis. This section also highlights the increasing demand for precise location services across different applications.
- Market Size: The global GNSS-Enabled Consumer Device market was valued at xx million units in 2024, and it is projected to reach xx million units by 2033, growing at a CAGR of xx%.
- Adoption Rates: The adoption rate of GNSS-enabled devices is expected to increase significantly in emerging markets due to rising smartphone penetration.
- Technological Disruptions: Advancements in 5G technology are expected to significantly boost the adoption of GNSS-enabled devices.
Dominant Regions, Countries, or Segments in GNSS-Enabled Consumer Device Market
This section identifies the leading geographical regions and market segments driving market growth within the GNSS-Enabled Consumer Device market. We analyze the factors contributing to their dominance, including market share, growth potential, economic policies, and infrastructure development. The analysis focuses on Device Types: Smartphones, Tablets & Wearables, Personal Tracking Devices, Low-Power Asset Trackers, and Other Device Types, highlighting the leading segment and the reasons behind its success. A detailed breakdown of regional performance and segment-specific growth drivers is presented.
- Leading Region: North America is projected to maintain its dominance until 2033, followed by Asia Pacific.
- Leading Segment: Smartphones are anticipated to dominate the market throughout the forecast period due to high penetration rates and diverse applications.
- Key Growth Drivers: Factors such as increased consumer disposable income and rising demand for location-based services are driving market growth.
GNSS-Enabled Consumer Device Market Product Landscape
This section describes the range of GNSS-enabled consumer devices available in the market. It highlights notable product innovations, detailing their unique selling propositions and technological advancements. The analysis covers various applications of these devices, encompassing navigation, fitness tracking, asset management, and more. Key performance metrics, such as accuracy, power consumption, and integration capabilities, are also discussed.
Key Drivers, Barriers & Challenges in GNSS-Enabled Consumer Device Market
This section identifies the key factors driving market growth, including technological advancements, economic factors, and supportive government policies. Examples include improvements in GNSS technology, the growing demand for location-based services, and government initiatives promoting the adoption of smart technologies. The analysis also outlines key barriers and challenges, encompassing supply chain disruptions, regulatory hurdles, and competitive pressures. The report quantifies the impact of these challenges on market growth.
- Key Drivers: Technological advancements, increasing demand for location-based services, and supportive government policies.
- Key Challenges: Supply chain disruptions, regulatory hurdles (e.g., data privacy), and intense competition.
Emerging Opportunities in GNSS-Enabled Consumer Device Market
This section highlights emerging trends and untapped market opportunities in the GNSS-Enabled Consumer Device market. It explores innovative applications, such as the integration of GNSS technology with augmented reality (AR) and virtual reality (VR), and evolving consumer preferences, such as the demand for more energy-efficient and precise location tracking. The identification of new markets and niches presents significant growth potential for industry players.
Growth Accelerators in the GNSS-Enabled Consumer Device Market Industry
This section discusses the catalysts that are poised to accelerate long-term market growth. It focuses on significant technological breakthroughs, such as advancements in multi-GNSS technology and the development of low-power consumption devices, strategic partnerships between technology providers and device manufacturers, and market expansion strategies targeting emerging markets. These elements collectively contribute to sustainable growth in the coming years.
Key Players Shaping the GNSS-Enabled Consumer Device Market Market
Notable Milestones in GNSS-Enabled Consumer Device Market Sector
- 2020, Q4: Launch of the first mass-market smartphone with integrated multi-GNSS capabilities.
- 2022, Q2: Major chipset manufacturer announces a new GNSS chip with improved power efficiency.
- 2023, Q3: A significant merger between two key players in the personal tracking device segment.
In-Depth GNSS-Enabled Consumer Device Market Market Outlook
The future of the GNSS-Enabled Consumer Device market is exceptionally promising, driven by sustained technological advancements, increasing consumer demand for location-based services, and the expansion of the market into new geographical regions. The report highlights significant strategic opportunities for businesses to capitalize on this growth, particularly through the development of innovative products and services that address evolving consumer needs. The market is ripe for further integration with emerging technologies, creating a plethora of new applications and possibilities.
GNSS-Enabled Consumer Device Market Segmentation
-
1. Device Type
- 1.1. Smartphones
- 1.2. Tablets & Wearables
- 1.3. Personal Tracking Devices
- 1.4. Low-Power Asset Trackers
- 1.5. Other Device Types
GNSS-Enabled Consumer Device Market Segmentation By Geography
- 1. North America
- 2. Europe
- 3. Asia Pacific
- 4. Latin America
- 5. Middle East and Africa
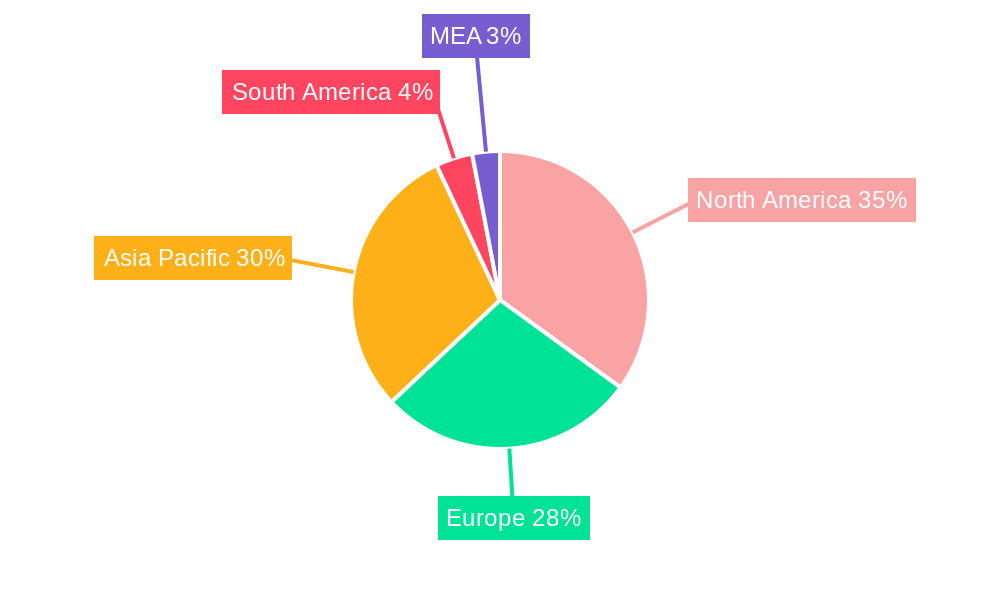
GNSS-Enabled Consumer Device Market Regional Market Share
Geographic Coverage of GNSS-Enabled Consumer Device Market
GNSS-Enabled Consumer Device Market REPORT HIGHLIGHTS
| Aspects | Details |
|---|---|
| Study Period | 2020-2034 |
| Base Year | 2025 |
| Estimated Year | 2026 |
| Forecast Period | 2026-2034 |
| Historical Period | 2020-2025 |
| Growth Rate | CAGR of 11.17% from 2020-2034 |
| Segmentation |
|
Table of Contents
- 1. Introduction
- 1.1. Research Scope
- 1.2. Market Segmentation
- 1.3. Research Methodology
- 1.4. Definitions and Assumptions
- 2. Executive Summary
- 2.1. Introduction
- 3. Market Dynamics
- 3.1. Introduction
- 3.2. Market Drivers
- 3.2.1 Wearables and tracking devices are boosting the GNSS market
- 3.2.2 whilst smartphone shipments are maturing
- 3.3. Market Restrains
- 3.3.1 Algorithms
- 3.3.2 Mathematical and Other Complexities Associated with the Gesture Recognition Technology
- 3.4. Market Trends
- 3.4.1. The Smartphones Segment is Expected to Considerably Drive the Market's Growth
- 4. Market Factor Analysis
- 4.1. Porters Five Forces
- 4.2. Supply/Value Chain
- 4.3. PESTEL analysis
- 4.4. Market Entropy
- 4.5. Patent/Trademark Analysis
- 5. Global GNSS-Enabled Consumer Device Market Analysis, Insights and Forecast, 2020-2032
- 5.1. Market Analysis, Insights and Forecast - by Device Type
- 5.1.1. Smartphones
- 5.1.2. Tablets & Wearables
- 5.1.3. Personal Tracking Devices
- 5.1.4. Low-Power Asset Trackers
- 5.1.5. Other Device Types
- 5.2. Market Analysis, Insights and Forecast - by Region
- 5.2.1. North America
- 5.2.2. Europe
- 5.2.3. Asia Pacific
- 5.2.4. Latin America
- 5.2.5. Middle East and Africa
- 5.1. Market Analysis, Insights and Forecast - by Device Type
- 6. North America GNSS-Enabled Consumer Device Market Analysis, Insights and Forecast, 2020-2032
- 6.1. Market Analysis, Insights and Forecast - by Device Type
- 6.1.1. Smartphones
- 6.1.2. Tablets & Wearables
- 6.1.3. Personal Tracking Devices
- 6.1.4. Low-Power Asset Trackers
- 6.1.5. Other Device Types
- 6.1. Market Analysis, Insights and Forecast - by Device Type
- 7. Europe GNSS-Enabled Consumer Device Market Analysis, Insights and Forecast, 2020-2032
- 7.1. Market Analysis, Insights and Forecast - by Device Type
- 7.1.1. Smartphones
- 7.1.2. Tablets & Wearables
- 7.1.3. Personal Tracking Devices
- 7.1.4. Low-Power Asset Trackers
- 7.1.5. Other Device Types
- 7.1. Market Analysis, Insights and Forecast - by Device Type
- 8. Asia Pacific GNSS-Enabled Consumer Device Market Analysis, Insights and Forecast, 2020-2032
- 8.1. Market Analysis, Insights and Forecast - by Device Type
- 8.1.1. Smartphones
- 8.1.2. Tablets & Wearables
- 8.1.3. Personal Tracking Devices
- 8.1.4. Low-Power Asset Trackers
- 8.1.5. Other Device Types
- 8.1. Market Analysis, Insights and Forecast - by Device Type
- 9. Latin America GNSS-Enabled Consumer Device Market Analysis, Insights and Forecast, 2020-2032
- 9.1. Market Analysis, Insights and Forecast - by Device Type
- 9.1.1. Smartphones
- 9.1.2. Tablets & Wearables
- 9.1.3. Personal Tracking Devices
- 9.1.4. Low-Power Asset Trackers
- 9.1.5. Other Device Types
- 9.1. Market Analysis, Insights and Forecast - by Device Type
- 10. Middle East and Africa GNSS-Enabled Consumer Device Market Analysis, Insights and Forecast, 2020-2032
- 10.1. Market Analysis, Insights and Forecast - by Device Type
- 10.1.1. Smartphones
- 10.1.2. Tablets & Wearables
- 10.1.3. Personal Tracking Devices
- 10.1.4. Low-Power Asset Trackers
- 10.1.5. Other Device Types
- 10.1. Market Analysis, Insights and Forecast - by Device Type
- 11. Competitive Analysis
- 11.1. Global Market Share Analysis 2025
- 11.2. Company Profiles
- 11.2.1 Huami Corporation
- 11.2.1.1. Overview
- 11.2.1.2. Products
- 11.2.1.3. SWOT Analysis
- 11.2.1.4. Recent Developments
- 11.2.1.5. Financials (Based on Availability)
- 11.2.2 Samsung Electronics Co Ltd
- 11.2.2.1. Overview
- 11.2.2.2. Products
- 11.2.2.3. SWOT Analysis
- 11.2.2.4. Recent Developments
- 11.2.2.5. Financials (Based on Availability)
- 11.2.3 Garmin Ltd
- 11.2.3.1. Overview
- 11.2.3.2. Products
- 11.2.3.3. SWOT Analysis
- 11.2.3.4. Recent Developments
- 11.2.3.5. Financials (Based on Availability)
- 11.2.4 Fitbit (Google)
- 11.2.4.1. Overview
- 11.2.4.2. Products
- 11.2.4.3. SWOT Analysis
- 11.2.4.4. Recent Developments
- 11.2.4.5. Financials (Based on Availability)
- 11.2.5 Xiaomi
- 11.2.5.1. Overview
- 11.2.5.2. Products
- 11.2.5.3. SWOT Analysis
- 11.2.5.4. Recent Developments
- 11.2.5.5. Financials (Based on Availability)
- 11.2.6 Huawei Technologies Co Ltd
- 11.2.6.1. Overview
- 11.2.6.2. Products
- 11.2.6.3. SWOT Analysis
- 11.2.6.4. Recent Developments
- 11.2.6.5. Financials (Based on Availability)
- 11.2.7 Fossil Group Inc
- 11.2.7.1. Overview
- 11.2.7.2. Products
- 11.2.7.3. SWOT Analysis
- 11.2.7.4. Recent Developments
- 11.2.7.5. Financials (Based on Availability)
- 11.2.8 Apple Inc
- 11.2.8.1. Overview
- 11.2.8.2. Products
- 11.2.8.3. SWOT Analysis
- 11.2.8.4. Recent Developments
- 11.2.8.5. Financials (Based on Availability)
- 11.2.9 Samsung
- 11.2.9.1. Overview
- 11.2.9.2. Products
- 11.2.9.3. SWOT Analysis
- 11.2.9.4. Recent Developments
- 11.2.9.5. Financials (Based on Availability)
- 11.2.1 Huami Corporation
List of Figures
- Figure 1: Global GNSS-Enabled Consumer Device Market Revenue Breakdown (billion, %) by Region 2025 & 2033
- Figure 2: Global GNSS-Enabled Consumer Device Market Volume Breakdown (K Unit, %) by Region 2025 & 2033
- Figure 3: North America GNSS-Enabled Consumer Device Market Revenue (billion), by Device Type 2025 & 2033
- Figure 4: North America GNSS-Enabled Consumer Device Market Volume (K Unit), by Device Type 2025 & 2033
- Figure 5: North America GNSS-Enabled Consumer Device Market Revenue Share (%), by Device Type 2025 & 2033
- Figure 6: North America GNSS-Enabled Consumer Device Market Volume Share (%), by Device Type 2025 & 2033
- Figure 7: North America GNSS-Enabled Consumer Device Market Revenue (billion), by Country 2025 & 2033
- Figure 8: North America GNSS-Enabled Consumer Device Market Volume (K Unit), by Country 2025 & 2033
- Figure 9: North America GNSS-Enabled Consumer Device Market Revenue Share (%), by Country 2025 & 2033
- Figure 10: North America GNSS-Enabled Consumer Device Market Volume Share (%), by Country 2025 & 2033
- Figure 11: Europe GNSS-Enabled Consumer Device Market Revenue (billion), by Device Type 2025 & 2033
- Figure 12: Europe GNSS-Enabled Consumer Device Market Volume (K Unit), by Device Type 2025 & 2033
- Figure 13: Europe GNSS-Enabled Consumer Device Market Revenue Share (%), by Device Type 2025 & 2033
- Figure 14: Europe GNSS-Enabled Consumer Device Market Volume Share (%), by Device Type 2025 & 2033
- Figure 15: Europe GNSS-Enabled Consumer Device Market Revenue (billion), by Country 2025 & 2033
- Figure 16: Europe GNSS-Enabled Consumer Device Market Volume (K Unit), by Country 2025 & 2033
- Figure 17: Europe GNSS-Enabled Consumer Device Market Revenue Share (%), by Country 2025 & 2033
- Figure 18: Europe GNSS-Enabled Consumer Device Market Volume Share (%), by Country 2025 & 2033
- Figure 19: Asia Pacific GNSS-Enabled Consumer Device Market Revenue (billion), by Device Type 2025 & 2033
- Figure 20: Asia Pacific GNSS-Enabled Consumer Device Market Volume (K Unit), by Device Type 2025 & 2033
- Figure 21: Asia Pacific GNSS-Enabled Consumer Device Market Revenue Share (%), by Device Type 2025 & 2033
- Figure 22: Asia Pacific GNSS-Enabled Consumer Device Market Volume Share (%), by Device Type 2025 & 2033
- Figure 23: Asia Pacific GNSS-Enabled Consumer Device Market Revenue (billion), by Country 2025 & 2033
- Figure 24: Asia Pacific GNSS-Enabled Consumer Device Market Volume (K Unit), by Country 2025 & 2033
- Figure 25: Asia Pacific GNSS-Enabled Consumer Device Market Revenue Share (%), by Country 2025 & 2033
- Figure 26: Asia Pacific GNSS-Enabled Consumer Device Market Volume Share (%), by Country 2025 & 2033
- Figure 27: Latin America GNSS-Enabled Consumer Device Market Revenue (billion), by Device Type 2025 & 2033
- Figure 28: Latin America GNSS-Enabled Consumer Device Market Volume (K Unit), by Device Type 2025 & 2033
- Figure 29: Latin America GNSS-Enabled Consumer Device Market Revenue Share (%), by Device Type 2025 & 2033
- Figure 30: Latin America GNSS-Enabled Consumer Device Market Volume Share (%), by Device Type 2025 & 2033
- Figure 31: Latin America GNSS-Enabled Consumer Device Market Revenue (billion), by Country 2025 & 2033
- Figure 32: Latin America GNSS-Enabled Consumer Device Market Volume (K Unit), by Country 2025 & 2033
- Figure 33: Latin America GNSS-Enabled Consumer Device Market Revenue Share (%), by Country 2025 & 2033
- Figure 34: Latin America GNSS-Enabled Consumer Device Market Volume Share (%), by Country 2025 & 2033
- Figure 35: Middle East and Africa GNSS-Enabled Consumer Device Market Revenue (billion), by Device Type 2025 & 2033
- Figure 36: Middle East and Africa GNSS-Enabled Consumer Device Market Volume (K Unit), by Device Type 2025 & 2033
- Figure 37: Middle East and Africa GNSS-Enabled Consumer Device Market Revenue Share (%), by Device Type 2025 & 2033
- Figure 38: Middle East and Africa GNSS-Enabled Consumer Device Market Volume Share (%), by Device Type 2025 & 2033
- Figure 39: Middle East and Africa GNSS-Enabled Consumer Device Market Revenue (billion), by Country 2025 & 2033
- Figure 40: Middle East and Africa GNSS-Enabled Consumer Device Market Volume (K Unit), by Country 2025 & 2033
- Figure 41: Middle East and Africa GNSS-Enabled Consumer Device Market Revenue Share (%), by Country 2025 & 2033
- Figure 42: Middle East and Africa GNSS-Enabled Consumer Device Market Volume Share (%), by Country 2025 & 2033
List of Tables
- Table 1: Global GNSS-Enabled Consumer Device Market Revenue billion Forecast, by Device Type 2020 & 2033
- Table 2: Global GNSS-Enabled Consumer Device Market Volume K Unit Forecast, by Device Type 2020 & 2033
- Table 3: Global GNSS-Enabled Consumer Device Market Revenue billion Forecast, by Region 2020 & 2033
- Table 4: Global GNSS-Enabled Consumer Device Market Volume K Unit Forecast, by Region 2020 & 2033
- Table 5: Global GNSS-Enabled Consumer Device Market Revenue billion Forecast, by Device Type 2020 & 2033
- Table 6: Global GNSS-Enabled Consumer Device Market Volume K Unit Forecast, by Device Type 2020 & 2033
- Table 7: Global GNSS-Enabled Consumer Device Market Revenue billion Forecast, by Country 2020 & 2033
- Table 8: Global GNSS-Enabled Consumer Device Market Volume K Unit Forecast, by Country 2020 & 2033
- Table 9: Global GNSS-Enabled Consumer Device Market Revenue billion Forecast, by Device Type 2020 & 2033
- Table 10: Global GNSS-Enabled Consumer Device Market Volume K Unit Forecast, by Device Type 2020 & 2033
- Table 11: Global GNSS-Enabled Consumer Device Market Revenue billion Forecast, by Country 2020 & 2033
- Table 12: Global GNSS-Enabled Consumer Device Market Volume K Unit Forecast, by Country 2020 & 2033
- Table 13: Global GNSS-Enabled Consumer Device Market Revenue billion Forecast, by Device Type 2020 & 2033
- Table 14: Global GNSS-Enabled Consumer Device Market Volume K Unit Forecast, by Device Type 2020 & 2033
- Table 15: Global GNSS-Enabled Consumer Device Market Revenue billion Forecast, by Country 2020 & 2033
- Table 16: Global GNSS-Enabled Consumer Device Market Volume K Unit Forecast, by Country 2020 & 2033
- Table 17: Global GNSS-Enabled Consumer Device Market Revenue billion Forecast, by Device Type 2020 & 2033
- Table 18: Global GNSS-Enabled Consumer Device Market Volume K Unit Forecast, by Device Type 2020 & 2033
- Table 19: Global GNSS-Enabled Consumer Device Market Revenue billion Forecast, by Country 2020 & 2033
- Table 20: Global GNSS-Enabled Consumer Device Market Volume K Unit Forecast, by Country 2020 & 2033
- Table 21: Global GNSS-Enabled Consumer Device Market Revenue billion Forecast, by Device Type 2020 & 2033
- Table 22: Global GNSS-Enabled Consumer Device Market Volume K Unit Forecast, by Device Type 2020 & 2033
- Table 23: Global GNSS-Enabled Consumer Device Market Revenue billion Forecast, by Country 2020 & 2033
- Table 24: Global GNSS-Enabled Consumer Device Market Volume K Unit Forecast, by Country 2020 & 2033
Frequently Asked Questions
1. What is the projected Compound Annual Growth Rate (CAGR) of the GNSS-Enabled Consumer Device Market?
The projected CAGR is approximately 11.17%.
2. Which companies are prominent players in the GNSS-Enabled Consumer Device Market?
Key companies in the market include Huami Corporation, Samsung Electronics Co Ltd, Garmin Ltd, Fitbit (Google), Xiaomi, Huawei Technologies Co Ltd, Fossil Group Inc, Apple Inc, Samsung.
3. What are the main segments of the GNSS-Enabled Consumer Device Market?
The market segments include Device Type.
4. Can you provide details about the market size?
The market size is estimated to be USD 335.04 billion as of 2022.
5. What are some drivers contributing to market growth?
Wearables and tracking devices are boosting the GNSS market. whilst smartphone shipments are maturing.
6. What are the notable trends driving market growth?
The Smartphones Segment is Expected to Considerably Drive the Market's Growth.
7. Are there any restraints impacting market growth?
Algorithms. Mathematical and Other Complexities Associated with the Gesture Recognition Technology.
8. Can you provide examples of recent developments in the market?
N/A
9. What pricing options are available for accessing the report?
Pricing options include single-user, multi-user, and enterprise licenses priced at USD 4750, USD 5250, and USD 8750 respectively.
10. Is the market size provided in terms of value or volume?
The market size is provided in terms of value, measured in billion and volume, measured in K Unit.
11. Are there any specific market keywords associated with the report?
Yes, the market keyword associated with the report is "GNSS-Enabled Consumer Device Market," which aids in identifying and referencing the specific market segment covered.
12. How do I determine which pricing option suits my needs best?
The pricing options vary based on user requirements and access needs. Individual users may opt for single-user licenses, while businesses requiring broader access may choose multi-user or enterprise licenses for cost-effective access to the report.
13. Are there any additional resources or data provided in the GNSS-Enabled Consumer Device Market report?
While the report offers comprehensive insights, it's advisable to review the specific contents or supplementary materials provided to ascertain if additional resources or data are available.
14. How can I stay updated on further developments or reports in the GNSS-Enabled Consumer Device Market?
To stay informed about further developments, trends, and reports in the GNSS-Enabled Consumer Device Market, consider subscribing to industry newsletters, following relevant companies and organizations, or regularly checking reputable industry news sources and publications.
Methodology
Step 1 - Identification of Relevant Samples Size from Population Database


Step 2 - Approaches for Defining Global Market Size (Value, Volume* & Price*)

Note*: In applicable scenarios
Step 3 - Data Sources
Primary Research
- Web Analytics
- Survey Reports
- Research Institute
- Latest Research Reports
- Opinion Leaders
Secondary Research
- Annual Reports
- White Paper
- Latest Press Release
- Industry Association
- Paid Database
- Investor Presentations

Step 4 - Data Triangulation
Involves using different sources of information in order to increase the validity of a study
These sources are likely to be stakeholders in a program - participants, other researchers, program staff, other community members, and so on.
Then we put all data in single framework & apply various statistical tools to find out the dynamic on the market.
During the analysis stage, feedback from the stakeholder groups would be compared to determine areas of agreement as well as areas of divergence