
Key Insights
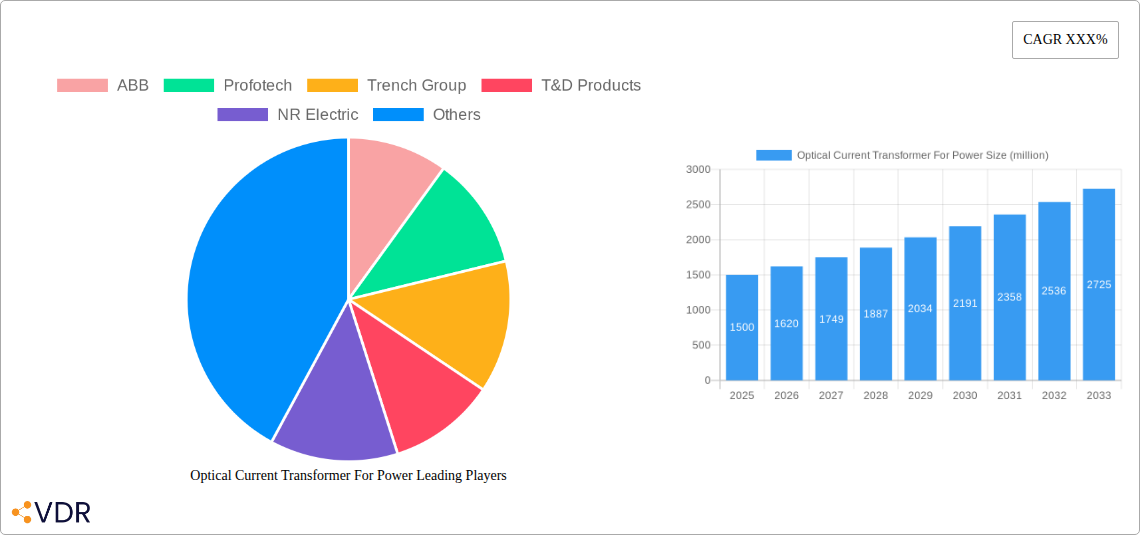
The global market for Optical Current Transformers (OCTs) for power applications is experiencing robust growth, driven by the increasing demand for advanced grid monitoring and protection systems. The transition towards smart grids, coupled with the need for enhanced grid stability and reliability, is a primary catalyst. OCTs offer significant advantages over conventional current transformers, including improved accuracy, immunity to electromagnetic interference, and enhanced safety due to their optical isolation. This is fueling adoption across various segments, including substations, renewable energy integration points, and transmission lines. The market is witnessing a shift towards higher-capacity OCTs to accommodate the increasing power transmission requirements. Furthermore, technological advancements in optical fiber technology and sensor integration are further boosting the market's growth trajectory. We project a healthy Compound Annual Growth Rate (CAGR) of approximately 8% during the forecast period (2025-2033). Major players like ABB, GE, and others are heavily investing in research and development to enhance the performance and capabilities of OCTs, driving innovation and competitiveness within the market.
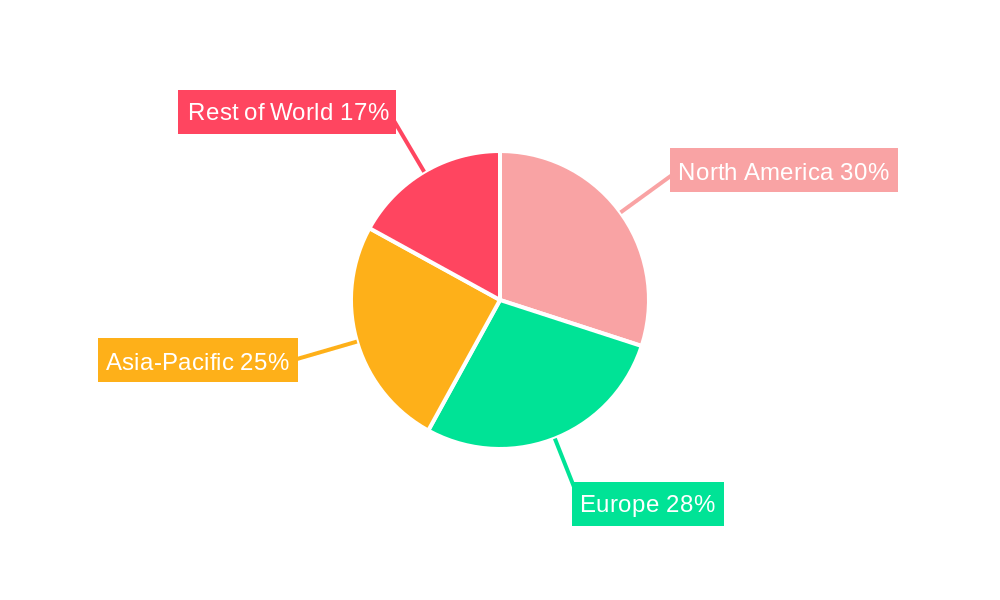
The market segmentation reveals strong demand across various geographic regions, with North America and Europe currently holding significant market shares. However, the Asia-Pacific region is expected to witness substantial growth due to rapid infrastructure development and rising energy consumption. While regulatory compliance and initial investment costs pose some challenges, the long-term benefits of enhanced grid security and efficiency significantly outweigh these limitations. The continuous advancements in sensor technology, coupled with declining manufacturing costs, are expected to make OCTs more accessible and further accelerate market penetration in the coming years. This will lead to increased competition among existing players and attract new entrants into this lucrative and rapidly expanding market.
Optical Current Transformer For Power Market Report: 2019-2033
This comprehensive report provides an in-depth analysis of the Optical Current Transformer (OCT) for Power market, encompassing market dynamics, growth trends, regional dominance, product landscape, key players, and future outlook. The study period covers 2019-2033, with 2025 as the base and estimated year. The forecast period extends from 2025 to 2033, and the historical period analyzed is 2019-2024. The report segments the market by [Insert Specific Segments Here, e.g., Voltage Level, Application (Transmission, Distribution, Substation), Technology] and analyzes key players like ABB, Profotech, Trench Group, T&D Products, NR Electric, Arteche, GE, Yangtze Optical Electronic, and Comcore Optical Intelligence Technologies. The parent market is the Power Transmission and Distribution market, with the child market being current transformers specifically. This report is valued at xx million units.
Optical Current Transformer For Power Market Dynamics & Structure
The Optical Current Transformer (OCT) for Power market is experiencing moderate consolidation, with a few major players holding significant market share. Technological innovation, driven by the need for improved accuracy, higher bandwidth, and immunity to electromagnetic interference, is a key growth driver. Stringent regulatory frameworks concerning grid modernization and smart grid initiatives further propel market expansion. While traditional current transformers remain prevalent, OCTs are increasingly favored due to their superior performance characteristics. The market witnesses consistent M&A activity, with larger players acquiring smaller companies to expand their product portfolios and geographical reach.
- Market Concentration: The top 5 players account for approximately xx% of the global market share in 2025.
- Technological Innovation Drivers: Advancements in optical fiber technology, signal processing, and sensor integration are key drivers.
- Regulatory Frameworks: Government initiatives promoting smart grids and grid modernization are creating significant demand.
- Competitive Product Substitutes: Traditional current transformers pose competition, but OCTs offer advantages in performance and safety.
- End-User Demographics: Major end-users include power utilities, grid operators, and industrial facilities.
- M&A Trends: An average of xx M&A deals related to OCT technology occurred annually during 2019-2024. The deal value is estimated at xx million USD annually. This includes both acquisitions of OCT companies and acquisitions of companies with OCT technology integration.
Optical Current Transformer For Power Growth Trends & Insights
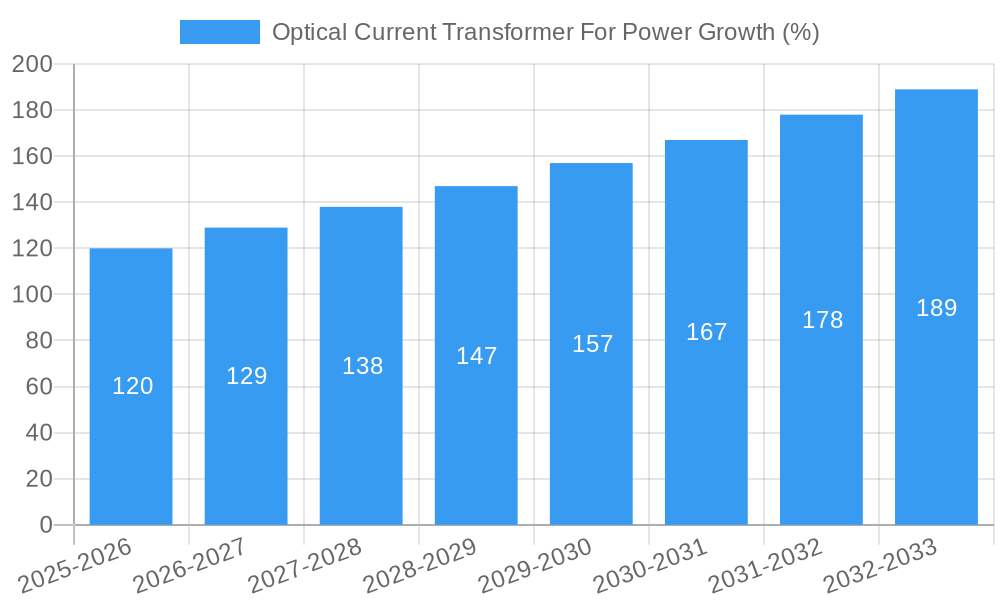
The global OCT for Power market is projected to witness robust growth, with a Compound Annual Growth Rate (CAGR) of xx% during the forecast period (2025-2033). Market size is estimated at xx million units in 2025 and is projected to reach xx million units by 2033. This growth is fueled by increasing investments in smart grid infrastructure, the growing demand for improved grid monitoring and control, and the rising adoption of renewable energy sources. Technological advancements such as miniaturization, improved signal processing, and the development of cost-effective OCTs contribute to increased market penetration. Shifting consumer preferences toward higher accuracy and enhanced safety features are also key drivers. The market penetration rate is expected to increase from xx% in 2025 to xx% in 2033.
Dominant Regions, Countries, or Segments in Optical Current Transformer For Power
The [Insert Dominant Region, e.g., North America] region dominates the global OCT for Power market, driven by robust investments in grid modernization and the presence of major power utilities and technology providers. [Insert Dominant Country, e.g., United States] holds a significant market share within this region. However, regions like [Insert Other High-Growth Region, e.g., Asia-Pacific] are expected to witness significant growth, fueled by rapid economic development and expanding power infrastructure.
- Key Drivers in North America:
- Robust investment in smart grid infrastructure.
- Stringent grid modernization policies.
- Presence of major power utilities and technology providers.
- Key Drivers in Asia-Pacific:
- Rapid economic growth and industrialization.
- Increasing demand for reliable and efficient power supply.
- Government initiatives supporting renewable energy integration.
The [Insert Dominant Segment, e.g., High-Voltage Transmission] segment holds the largest market share due to its higher accuracy requirements and complexity compared to lower-voltage applications. This segment is also experiencing a faster growth rate compared to other segments.
Optical Current Transformer For Power Product Landscape
OCTs for power applications boast a range of innovative features including improved accuracy, increased bandwidth, and superior immunity to electromagnetic interference. These advancements, facilitated by technological progress in fiber optics and signal processing, enable improved grid monitoring and control systems. Unique selling propositions include enhanced safety due to electrical isolation and reduced installation costs compared to traditional alternatives. Various designs cater to different voltage levels and specific application requirements.
Key Drivers, Barriers & Challenges in Optical Current Transformer For Power
Key Drivers: The primary drivers are the growing demand for improved grid monitoring and control, increasing adoption of renewable energy, stringent regulations concerning grid safety and reliability, and the need for advanced metering infrastructure (AMI). Technological advancements, such as miniaturization and improved signal processing, are crucial drivers. Government incentives and supportive policies further propel market growth.
Key Challenges: High initial investment costs compared to traditional current transformers, the need for specialized installation expertise, and potential supply chain disruptions related to critical components can hinder market penetration. Competition from established players and the development of alternative technologies also pose challenges.
Emerging Opportunities in Optical Current Transformer For Power
Emerging opportunities arise from untapped markets in developing countries, the integration of OCTs with advanced analytics platforms, the demand for highly reliable monitoring solutions in renewable energy installations, and the development of novel applications in smart grids. The integration of OCT technology with IoT and AI for predictive maintenance offers promising avenues for growth.
Growth Accelerators in the Optical Current Transformer For Power Industry
Technological breakthroughs in fiber optics and signal processing, strategic partnerships between technology providers and power utilities, and the expansion of OCT applications into new markets (e.g., microgrids) are key growth accelerators. Government support through research grants and policy initiatives further strengthens market expansion.
Key Players Shaping the Optical Current Transformer For Power Market
- ABB
- Profotech
- Trench Group
- T&D Products
- NR Electric
- Arteche
- GE
- Yangtze Optical Electronic
- Comcore Optical Intelligence Technologies
Notable Milestones in Optical Current Transformer For Power Sector
- 2020: ABB launches a new line of high-accuracy OCTs for HVDC applications.
- 2021: Profotech and GE announce a strategic partnership to develop next-generation OCT technology.
- 2022: NR Electric introduces a compact OCT designed for smart grid applications.
- 2023: Yangtze Optical Electronic expands its manufacturing capacity to meet the growing demand for OCTs.
- [Insert more milestones with dates and descriptions]
In-Depth Optical Current Transformer For Power Market Outlook
The OCT for Power market is poised for significant growth in the coming years. Technological advancements, coupled with increasing investments in smart grid infrastructure and renewable energy integration, will drive market expansion. Strategic partnerships and the exploration of new applications will unlock further growth opportunities. The market is expected to continue its upward trajectory, exceeding xx million units by 2033.
Optical Current Transformer For Power Segmentation
-
1. Application
- 1.1. Power Transmission Line
- 1.2. Electric Power System
- 1.3. Substation
- 1.4. Others
-
2. Type
- 2.1. Fiber Optical Current Transformer (FOCT)
- 2.2. Hybrid Optical Current Transformer (HOCT)
Optical Current Transformer For Power Segmentation By Geography
-
1. North America
- 1.1. United States
- 1.2. Canada
- 1.3. Mexico
-
2. South America
- 2.1. Brazil
- 2.2. Argentina
- 2.3. Rest of South America
-
3. Europe
- 3.1. United Kingdom
- 3.2. Germany
- 3.3. France
- 3.4. Italy
- 3.5. Spain
- 3.6. Russia
- 3.7. Benelux
- 3.8. Nordics
- 3.9. Rest of Europe
-
4. Middle East & Africa
- 4.1. Turkey
- 4.2. Israel
- 4.3. GCC
- 4.4. North Africa
- 4.5. South Africa
- 4.6. Rest of Middle East & Africa
-
5. Asia Pacific
- 5.1. China
- 5.2. India
- 5.3. Japan
- 5.4. South Korea
- 5.5. ASEAN
- 5.6. Oceania
- 5.7. Rest of Asia Pacific
Optical Current Transformer For Power REPORT HIGHLIGHTS
| Aspects | Details |
|---|---|
| Study Period | 2019-2033 |
| Base Year | 2024 |
| Estimated Year | 2025 |
| Forecast Period | 2025-2033 |
| Historical Period | 2019-2024 |
| Growth Rate | CAGR of XXX% from 2019-2033 |
| Segmentation |
|
Table of Contents
- 1. Introduction
- 1.1. Research Scope
- 1.2. Market Segmentation
- 1.3. Research Methodology
- 1.4. Definitions and Assumptions
- 2. Executive Summary
- 2.1. Introduction
- 3. Market Dynamics
- 3.1. Introduction
- 3.2. Market Drivers
- 3.3. Market Restrains
- 3.4. Market Trends
- 4. Market Factor Analysis
- 4.1. Porters Five Forces
- 4.2. Supply/Value Chain
- 4.3. PESTEL analysis
- 4.4. Market Entropy
- 4.5. Patent/Trademark Analysis
- 5. Global Optical Current Transformer For Power Analysis, Insights and Forecast, 2019-2031
- 5.1. Market Analysis, Insights and Forecast - by Application
- 5.1.1. Power Transmission Line
- 5.1.2. Electric Power System
- 5.1.3. Substation
- 5.1.4. Others
- 5.2. Market Analysis, Insights and Forecast - by Type
- 5.2.1. Fiber Optical Current Transformer (FOCT)
- 5.2.2. Hybrid Optical Current Transformer (HOCT)
- 5.3. Market Analysis, Insights and Forecast - by Region
- 5.3.1. North America
- 5.3.2. South America
- 5.3.3. Europe
- 5.3.4. Middle East & Africa
- 5.3.5. Asia Pacific
- 5.1. Market Analysis, Insights and Forecast - by Application
- 6. North America Optical Current Transformer For Power Analysis, Insights and Forecast, 2019-2031
- 6.1. Market Analysis, Insights and Forecast - by Application
- 6.1.1. Power Transmission Line
- 6.1.2. Electric Power System
- 6.1.3. Substation
- 6.1.4. Others
- 6.2. Market Analysis, Insights and Forecast - by Type
- 6.2.1. Fiber Optical Current Transformer (FOCT)
- 6.2.2. Hybrid Optical Current Transformer (HOCT)
- 6.1. Market Analysis, Insights and Forecast - by Application
- 7. South America Optical Current Transformer For Power Analysis, Insights and Forecast, 2019-2031
- 7.1. Market Analysis, Insights and Forecast - by Application
- 7.1.1. Power Transmission Line
- 7.1.2. Electric Power System
- 7.1.3. Substation
- 7.1.4. Others
- 7.2. Market Analysis, Insights and Forecast - by Type
- 7.2.1. Fiber Optical Current Transformer (FOCT)
- 7.2.2. Hybrid Optical Current Transformer (HOCT)
- 7.1. Market Analysis, Insights and Forecast - by Application
- 8. Europe Optical Current Transformer For Power Analysis, Insights and Forecast, 2019-2031
- 8.1. Market Analysis, Insights and Forecast - by Application
- 8.1.1. Power Transmission Line
- 8.1.2. Electric Power System
- 8.1.3. Substation
- 8.1.4. Others
- 8.2. Market Analysis, Insights and Forecast - by Type
- 8.2.1. Fiber Optical Current Transformer (FOCT)
- 8.2.2. Hybrid Optical Current Transformer (HOCT)
- 8.1. Market Analysis, Insights and Forecast - by Application
- 9. Middle East & Africa Optical Current Transformer For Power Analysis, Insights and Forecast, 2019-2031
- 9.1. Market Analysis, Insights and Forecast - by Application
- 9.1.1. Power Transmission Line
- 9.1.2. Electric Power System
- 9.1.3. Substation
- 9.1.4. Others
- 9.2. Market Analysis, Insights and Forecast - by Type
- 9.2.1. Fiber Optical Current Transformer (FOCT)
- 9.2.2. Hybrid Optical Current Transformer (HOCT)
- 9.1. Market Analysis, Insights and Forecast - by Application
- 10. Asia Pacific Optical Current Transformer For Power Analysis, Insights and Forecast, 2019-2031
- 10.1. Market Analysis, Insights and Forecast - by Application
- 10.1.1. Power Transmission Line
- 10.1.2. Electric Power System
- 10.1.3. Substation
- 10.1.4. Others
- 10.2. Market Analysis, Insights and Forecast - by Type
- 10.2.1. Fiber Optical Current Transformer (FOCT)
- 10.2.2. Hybrid Optical Current Transformer (HOCT)
- 10.1. Market Analysis, Insights and Forecast - by Application
- 11. Competitive Analysis
- 11.1. Global Market Share Analysis 2024
- 11.2. Company Profiles
- 11.2.1 ABB
- 11.2.1.1. Overview
- 11.2.1.2. Products
- 11.2.1.3. SWOT Analysis
- 11.2.1.4. Recent Developments
- 11.2.1.5. Financials (Based on Availability)
- 11.2.2 Profotech
- 11.2.2.1. Overview
- 11.2.2.2. Products
- 11.2.2.3. SWOT Analysis
- 11.2.2.4. Recent Developments
- 11.2.2.5. Financials (Based on Availability)
- 11.2.3 Trench Group
- 11.2.3.1. Overview
- 11.2.3.2. Products
- 11.2.3.3. SWOT Analysis
- 11.2.3.4. Recent Developments
- 11.2.3.5. Financials (Based on Availability)
- 11.2.4 T&D Products
- 11.2.4.1. Overview
- 11.2.4.2. Products
- 11.2.4.3. SWOT Analysis
- 11.2.4.4. Recent Developments
- 11.2.4.5. Financials (Based on Availability)
- 11.2.5 NR Electric
- 11.2.5.1. Overview
- 11.2.5.2. Products
- 11.2.5.3. SWOT Analysis
- 11.2.5.4. Recent Developments
- 11.2.5.5. Financials (Based on Availability)
- 11.2.6 Arteche
- 11.2.6.1. Overview
- 11.2.6.2. Products
- 11.2.6.3. SWOT Analysis
- 11.2.6.4. Recent Developments
- 11.2.6.5. Financials (Based on Availability)
- 11.2.7 GE
- 11.2.7.1. Overview
- 11.2.7.2. Products
- 11.2.7.3. SWOT Analysis
- 11.2.7.4. Recent Developments
- 11.2.7.5. Financials (Based on Availability)
- 11.2.8 Yangtze Optical Electronic
- 11.2.8.1. Overview
- 11.2.8.2. Products
- 11.2.8.3. SWOT Analysis
- 11.2.8.4. Recent Developments
- 11.2.8.5. Financials (Based on Availability)
- 11.2.9 Comcore Optical Intelligence Technologies
- 11.2.9.1. Overview
- 11.2.9.2. Products
- 11.2.9.3. SWOT Analysis
- 11.2.9.4. Recent Developments
- 11.2.9.5. Financials (Based on Availability)
- 11.2.1 ABB
List of Figures
- Figure 1: Global Optical Current Transformer For Power Revenue Breakdown (million, %) by Region 2024 & 2032
- Figure 2: Global Optical Current Transformer For Power Volume Breakdown (K, %) by Region 2024 & 2032
- Figure 3: North America Optical Current Transformer For Power Revenue (million), by Application 2024 & 2032
- Figure 4: North America Optical Current Transformer For Power Volume (K), by Application 2024 & 2032
- Figure 5: North America Optical Current Transformer For Power Revenue Share (%), by Application 2024 & 2032
- Figure 6: North America Optical Current Transformer For Power Volume Share (%), by Application 2024 & 2032
- Figure 7: North America Optical Current Transformer For Power Revenue (million), by Type 2024 & 2032
- Figure 8: North America Optical Current Transformer For Power Volume (K), by Type 2024 & 2032
- Figure 9: North America Optical Current Transformer For Power Revenue Share (%), by Type 2024 & 2032
- Figure 10: North America Optical Current Transformer For Power Volume Share (%), by Type 2024 & 2032
- Figure 11: North America Optical Current Transformer For Power Revenue (million), by Country 2024 & 2032
- Figure 12: North America Optical Current Transformer For Power Volume (K), by Country 2024 & 2032
- Figure 13: North America Optical Current Transformer For Power Revenue Share (%), by Country 2024 & 2032
- Figure 14: North America Optical Current Transformer For Power Volume Share (%), by Country 2024 & 2032
- Figure 15: South America Optical Current Transformer For Power Revenue (million), by Application 2024 & 2032
- Figure 16: South America Optical Current Transformer For Power Volume (K), by Application 2024 & 2032
- Figure 17: South America Optical Current Transformer For Power Revenue Share (%), by Application 2024 & 2032
- Figure 18: South America Optical Current Transformer For Power Volume Share (%), by Application 2024 & 2032
- Figure 19: South America Optical Current Transformer For Power Revenue (million), by Type 2024 & 2032
- Figure 20: South America Optical Current Transformer For Power Volume (K), by Type 2024 & 2032
- Figure 21: South America Optical Current Transformer For Power Revenue Share (%), by Type 2024 & 2032
- Figure 22: South America Optical Current Transformer For Power Volume Share (%), by Type 2024 & 2032
- Figure 23: South America Optical Current Transformer For Power Revenue (million), by Country 2024 & 2032
- Figure 24: South America Optical Current Transformer For Power Volume (K), by Country 2024 & 2032
- Figure 25: South America Optical Current Transformer For Power Revenue Share (%), by Country 2024 & 2032
- Figure 26: South America Optical Current Transformer For Power Volume Share (%), by Country 2024 & 2032
- Figure 27: Europe Optical Current Transformer For Power Revenue (million), by Application 2024 & 2032
- Figure 28: Europe Optical Current Transformer For Power Volume (K), by Application 2024 & 2032
- Figure 29: Europe Optical Current Transformer For Power Revenue Share (%), by Application 2024 & 2032
- Figure 30: Europe Optical Current Transformer For Power Volume Share (%), by Application 2024 & 2032
- Figure 31: Europe Optical Current Transformer For Power Revenue (million), by Type 2024 & 2032
- Figure 32: Europe Optical Current Transformer For Power Volume (K), by Type 2024 & 2032
- Figure 33: Europe Optical Current Transformer For Power Revenue Share (%), by Type 2024 & 2032
- Figure 34: Europe Optical Current Transformer For Power Volume Share (%), by Type 2024 & 2032
- Figure 35: Europe Optical Current Transformer For Power Revenue (million), by Country 2024 & 2032
- Figure 36: Europe Optical Current Transformer For Power Volume (K), by Country 2024 & 2032
- Figure 37: Europe Optical Current Transformer For Power Revenue Share (%), by Country 2024 & 2032
- Figure 38: Europe Optical Current Transformer For Power Volume Share (%), by Country 2024 & 2032
- Figure 39: Middle East & Africa Optical Current Transformer For Power Revenue (million), by Application 2024 & 2032
- Figure 40: Middle East & Africa Optical Current Transformer For Power Volume (K), by Application 2024 & 2032
- Figure 41: Middle East & Africa Optical Current Transformer For Power Revenue Share (%), by Application 2024 & 2032
- Figure 42: Middle East & Africa Optical Current Transformer For Power Volume Share (%), by Application 2024 & 2032
- Figure 43: Middle East & Africa Optical Current Transformer For Power Revenue (million), by Type 2024 & 2032
- Figure 44: Middle East & Africa Optical Current Transformer For Power Volume (K), by Type 2024 & 2032
- Figure 45: Middle East & Africa Optical Current Transformer For Power Revenue Share (%), by Type 2024 & 2032
- Figure 46: Middle East & Africa Optical Current Transformer For Power Volume Share (%), by Type 2024 & 2032
- Figure 47: Middle East & Africa Optical Current Transformer For Power Revenue (million), by Country 2024 & 2032
- Figure 48: Middle East & Africa Optical Current Transformer For Power Volume (K), by Country 2024 & 2032
- Figure 49: Middle East & Africa Optical Current Transformer For Power Revenue Share (%), by Country 2024 & 2032
- Figure 50: Middle East & Africa Optical Current Transformer For Power Volume Share (%), by Country 2024 & 2032
- Figure 51: Asia Pacific Optical Current Transformer For Power Revenue (million), by Application 2024 & 2032
- Figure 52: Asia Pacific Optical Current Transformer For Power Volume (K), by Application 2024 & 2032
- Figure 53: Asia Pacific Optical Current Transformer For Power Revenue Share (%), by Application 2024 & 2032
- Figure 54: Asia Pacific Optical Current Transformer For Power Volume Share (%), by Application 2024 & 2032
- Figure 55: Asia Pacific Optical Current Transformer For Power Revenue (million), by Type 2024 & 2032
- Figure 56: Asia Pacific Optical Current Transformer For Power Volume (K), by Type 2024 & 2032
- Figure 57: Asia Pacific Optical Current Transformer For Power Revenue Share (%), by Type 2024 & 2032
- Figure 58: Asia Pacific Optical Current Transformer For Power Volume Share (%), by Type 2024 & 2032
- Figure 59: Asia Pacific Optical Current Transformer For Power Revenue (million), by Country 2024 & 2032
- Figure 60: Asia Pacific Optical Current Transformer For Power Volume (K), by Country 2024 & 2032
- Figure 61: Asia Pacific Optical Current Transformer For Power Revenue Share (%), by Country 2024 & 2032
- Figure 62: Asia Pacific Optical Current Transformer For Power Volume Share (%), by Country 2024 & 2032
List of Tables
- Table 1: Global Optical Current Transformer For Power Revenue million Forecast, by Region 2019 & 2032
- Table 2: Global Optical Current Transformer For Power Volume K Forecast, by Region 2019 & 2032
- Table 3: Global Optical Current Transformer For Power Revenue million Forecast, by Application 2019 & 2032
- Table 4: Global Optical Current Transformer For Power Volume K Forecast, by Application 2019 & 2032
- Table 5: Global Optical Current Transformer For Power Revenue million Forecast, by Type 2019 & 2032
- Table 6: Global Optical Current Transformer For Power Volume K Forecast, by Type 2019 & 2032
- Table 7: Global Optical Current Transformer For Power Revenue million Forecast, by Region 2019 & 2032
- Table 8: Global Optical Current Transformer For Power Volume K Forecast, by Region 2019 & 2032
- Table 9: Global Optical Current Transformer For Power Revenue million Forecast, by Application 2019 & 2032
- Table 10: Global Optical Current Transformer For Power Volume K Forecast, by Application 2019 & 2032
- Table 11: Global Optical Current Transformer For Power Revenue million Forecast, by Type 2019 & 2032
- Table 12: Global Optical Current Transformer For Power Volume K Forecast, by Type 2019 & 2032
- Table 13: Global Optical Current Transformer For Power Revenue million Forecast, by Country 2019 & 2032
- Table 14: Global Optical Current Transformer For Power Volume K Forecast, by Country 2019 & 2032
- Table 15: United States Optical Current Transformer For Power Revenue (million) Forecast, by Application 2019 & 2032
- Table 16: United States Optical Current Transformer For Power Volume (K) Forecast, by Application 2019 & 2032
- Table 17: Canada Optical Current Transformer For Power Revenue (million) Forecast, by Application 2019 & 2032
- Table 18: Canada Optical Current Transformer For Power Volume (K) Forecast, by Application 2019 & 2032
- Table 19: Mexico Optical Current Transformer For Power Revenue (million) Forecast, by Application 2019 & 2032
- Table 20: Mexico Optical Current Transformer For Power Volume (K) Forecast, by Application 2019 & 2032
- Table 21: Global Optical Current Transformer For Power Revenue million Forecast, by Application 2019 & 2032
- Table 22: Global Optical Current Transformer For Power Volume K Forecast, by Application 2019 & 2032
- Table 23: Global Optical Current Transformer For Power Revenue million Forecast, by Type 2019 & 2032
- Table 24: Global Optical Current Transformer For Power Volume K Forecast, by Type 2019 & 2032
- Table 25: Global Optical Current Transformer For Power Revenue million Forecast, by Country 2019 & 2032
- Table 26: Global Optical Current Transformer For Power Volume K Forecast, by Country 2019 & 2032
- Table 27: Brazil Optical Current Transformer For Power Revenue (million) Forecast, by Application 2019 & 2032
- Table 28: Brazil Optical Current Transformer For Power Volume (K) Forecast, by Application 2019 & 2032
- Table 29: Argentina Optical Current Transformer For Power Revenue (million) Forecast, by Application 2019 & 2032
- Table 30: Argentina Optical Current Transformer For Power Volume (K) Forecast, by Application 2019 & 2032
- Table 31: Rest of South America Optical Current Transformer For Power Revenue (million) Forecast, by Application 2019 & 2032
- Table 32: Rest of South America Optical Current Transformer For Power Volume (K) Forecast, by Application 2019 & 2032
- Table 33: Global Optical Current Transformer For Power Revenue million Forecast, by Application 2019 & 2032
- Table 34: Global Optical Current Transformer For Power Volume K Forecast, by Application 2019 & 2032
- Table 35: Global Optical Current Transformer For Power Revenue million Forecast, by Type 2019 & 2032
- Table 36: Global Optical Current Transformer For Power Volume K Forecast, by Type 2019 & 2032
- Table 37: Global Optical Current Transformer For Power Revenue million Forecast, by Country 2019 & 2032
- Table 38: Global Optical Current Transformer For Power Volume K Forecast, by Country 2019 & 2032
- Table 39: United Kingdom Optical Current Transformer For Power Revenue (million) Forecast, by Application 2019 & 2032
- Table 40: United Kingdom Optical Current Transformer For Power Volume (K) Forecast, by Application 2019 & 2032
- Table 41: Germany Optical Current Transformer For Power Revenue (million) Forecast, by Application 2019 & 2032
- Table 42: Germany Optical Current Transformer For Power Volume (K) Forecast, by Application 2019 & 2032
- Table 43: France Optical Current Transformer For Power Revenue (million) Forecast, by Application 2019 & 2032
- Table 44: France Optical Current Transformer For Power Volume (K) Forecast, by Application 2019 & 2032
- Table 45: Italy Optical Current Transformer For Power Revenue (million) Forecast, by Application 2019 & 2032
- Table 46: Italy Optical Current Transformer For Power Volume (K) Forecast, by Application 2019 & 2032
- Table 47: Spain Optical Current Transformer For Power Revenue (million) Forecast, by Application 2019 & 2032
- Table 48: Spain Optical Current Transformer For Power Volume (K) Forecast, by Application 2019 & 2032
- Table 49: Russia Optical Current Transformer For Power Revenue (million) Forecast, by Application 2019 & 2032
- Table 50: Russia Optical Current Transformer For Power Volume (K) Forecast, by Application 2019 & 2032
- Table 51: Benelux Optical Current Transformer For Power Revenue (million) Forecast, by Application 2019 & 2032
- Table 52: Benelux Optical Current Transformer For Power Volume (K) Forecast, by Application 2019 & 2032
- Table 53: Nordics Optical Current Transformer For Power Revenue (million) Forecast, by Application 2019 & 2032
- Table 54: Nordics Optical Current Transformer For Power Volume (K) Forecast, by Application 2019 & 2032
- Table 55: Rest of Europe Optical Current Transformer For Power Revenue (million) Forecast, by Application 2019 & 2032
- Table 56: Rest of Europe Optical Current Transformer For Power Volume (K) Forecast, by Application 2019 & 2032
- Table 57: Global Optical Current Transformer For Power Revenue million Forecast, by Application 2019 & 2032
- Table 58: Global Optical Current Transformer For Power Volume K Forecast, by Application 2019 & 2032
- Table 59: Global Optical Current Transformer For Power Revenue million Forecast, by Type 2019 & 2032
- Table 60: Global Optical Current Transformer For Power Volume K Forecast, by Type 2019 & 2032
- Table 61: Global Optical Current Transformer For Power Revenue million Forecast, by Country 2019 & 2032
- Table 62: Global Optical Current Transformer For Power Volume K Forecast, by Country 2019 & 2032
- Table 63: Turkey Optical Current Transformer For Power Revenue (million) Forecast, by Application 2019 & 2032
- Table 64: Turkey Optical Current Transformer For Power Volume (K) Forecast, by Application 2019 & 2032
- Table 65: Israel Optical Current Transformer For Power Revenue (million) Forecast, by Application 2019 & 2032
- Table 66: Israel Optical Current Transformer For Power Volume (K) Forecast, by Application 2019 & 2032
- Table 67: GCC Optical Current Transformer For Power Revenue (million) Forecast, by Application 2019 & 2032
- Table 68: GCC Optical Current Transformer For Power Volume (K) Forecast, by Application 2019 & 2032
- Table 69: North Africa Optical Current Transformer For Power Revenue (million) Forecast, by Application 2019 & 2032
- Table 70: North Africa Optical Current Transformer For Power Volume (K) Forecast, by Application 2019 & 2032
- Table 71: South Africa Optical Current Transformer For Power Revenue (million) Forecast, by Application 2019 & 2032
- Table 72: South Africa Optical Current Transformer For Power Volume (K) Forecast, by Application 2019 & 2032
- Table 73: Rest of Middle East & Africa Optical Current Transformer For Power Revenue (million) Forecast, by Application 2019 & 2032
- Table 74: Rest of Middle East & Africa Optical Current Transformer For Power Volume (K) Forecast, by Application 2019 & 2032
- Table 75: Global Optical Current Transformer For Power Revenue million Forecast, by Application 2019 & 2032
- Table 76: Global Optical Current Transformer For Power Volume K Forecast, by Application 2019 & 2032
- Table 77: Global Optical Current Transformer For Power Revenue million Forecast, by Type 2019 & 2032
- Table 78: Global Optical Current Transformer For Power Volume K Forecast, by Type 2019 & 2032
- Table 79: Global Optical Current Transformer For Power Revenue million Forecast, by Country 2019 & 2032
- Table 80: Global Optical Current Transformer For Power Volume K Forecast, by Country 2019 & 2032
- Table 81: China Optical Current Transformer For Power Revenue (million) Forecast, by Application 2019 & 2032
- Table 82: China Optical Current Transformer For Power Volume (K) Forecast, by Application 2019 & 2032
- Table 83: India Optical Current Transformer For Power Revenue (million) Forecast, by Application 2019 & 2032
- Table 84: India Optical Current Transformer For Power Volume (K) Forecast, by Application 2019 & 2032
- Table 85: Japan Optical Current Transformer For Power Revenue (million) Forecast, by Application 2019 & 2032
- Table 86: Japan Optical Current Transformer For Power Volume (K) Forecast, by Application 2019 & 2032
- Table 87: South Korea Optical Current Transformer For Power Revenue (million) Forecast, by Application 2019 & 2032
- Table 88: South Korea Optical Current Transformer For Power Volume (K) Forecast, by Application 2019 & 2032
- Table 89: ASEAN Optical Current Transformer For Power Revenue (million) Forecast, by Application 2019 & 2032
- Table 90: ASEAN Optical Current Transformer For Power Volume (K) Forecast, by Application 2019 & 2032
- Table 91: Oceania Optical Current Transformer For Power Revenue (million) Forecast, by Application 2019 & 2032
- Table 92: Oceania Optical Current Transformer For Power Volume (K) Forecast, by Application 2019 & 2032
- Table 93: Rest of Asia Pacific Optical Current Transformer For Power Revenue (million) Forecast, by Application 2019 & 2032
- Table 94: Rest of Asia Pacific Optical Current Transformer For Power Volume (K) Forecast, by Application 2019 & 2032
Frequently Asked Questions
1. What is the projected Compound Annual Growth Rate (CAGR) of the Optical Current Transformer For Power?
The projected CAGR is approximately XXX%.
2. Which companies are prominent players in the Optical Current Transformer For Power?
Key companies in the market include ABB, Profotech, Trench Group, T&D Products, NR Electric, Arteche, GE, Yangtze Optical Electronic, Comcore Optical Intelligence Technologies.
3. What are the main segments of the Optical Current Transformer For Power?
The market segments include Application, Type.
4. Can you provide details about the market size?
The market size is estimated to be USD XXX million as of 2022.
5. What are some drivers contributing to market growth?
N/A
6. What are the notable trends driving market growth?
N/A
7. Are there any restraints impacting market growth?
N/A
8. Can you provide examples of recent developments in the market?
N/A
9. What pricing options are available for accessing the report?
Pricing options include single-user, multi-user, and enterprise licenses priced at USD 3950.00, USD 5925.00, and USD 7900.00 respectively.
10. Is the market size provided in terms of value or volume?
The market size is provided in terms of value, measured in million and volume, measured in K.
11. Are there any specific market keywords associated with the report?
Yes, the market keyword associated with the report is "Optical Current Transformer For Power," which aids in identifying and referencing the specific market segment covered.
12. How do I determine which pricing option suits my needs best?
The pricing options vary based on user requirements and access needs. Individual users may opt for single-user licenses, while businesses requiring broader access may choose multi-user or enterprise licenses for cost-effective access to the report.
13. Are there any additional resources or data provided in the Optical Current Transformer For Power report?
While the report offers comprehensive insights, it's advisable to review the specific contents or supplementary materials provided to ascertain if additional resources or data are available.
14. How can I stay updated on further developments or reports in the Optical Current Transformer For Power?
To stay informed about further developments, trends, and reports in the Optical Current Transformer For Power, consider subscribing to industry newsletters, following relevant companies and organizations, or regularly checking reputable industry news sources and publications.
Methodology
Step 1 - Identification of Relevant Samples Size from Population Database


Step 2 - Approaches for Defining Global Market Size (Value, Volume* & Price*)

Note*: In applicable scenarios
Step 3 - Data Sources
Primary Research
- Web Analytics
- Survey Reports
- Research Institute
- Latest Research Reports
- Opinion Leaders
Secondary Research
- Annual Reports
- White Paper
- Latest Press Release
- Industry Association
- Paid Database
- Investor Presentations

Step 4 - Data Triangulation
Involves using different sources of information in order to increase the validity of a study
These sources are likely to be stakeholders in a program - participants, other researchers, program staff, other community members, and so on.
Then we put all data in single framework & apply various statistical tools to find out the dynamic on the market.
During the analysis stage, feedback from the stakeholder groups would be compared to determine areas of agreement as well as areas of divergence


