
Key Insights
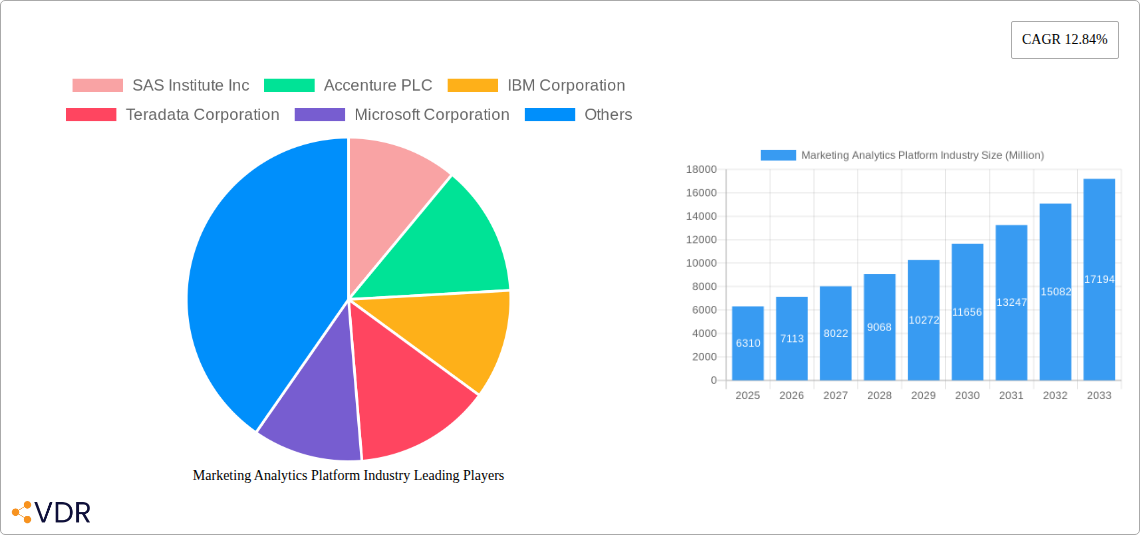
The Marketing Analytics Platform market is experiencing robust growth, projected to reach $6.31 billion in 2025 and exhibiting a Compound Annual Growth Rate (CAGR) of 12.84% from 2025 to 2033. This expansion is fueled by several key factors. The increasing adoption of cloud-based solutions offers scalability and cost-effectiveness, driving market penetration across various industry verticals. Simultaneously, the surge in digital marketing activities necessitates sophisticated analytics to optimize campaigns and maximize Return on Investment (ROI). Businesses are increasingly relying on data-driven insights to personalize customer experiences and improve marketing effectiveness, fueling demand for advanced analytics platforms. The diverse application segments, encompassing online marketing, email marketing, content marketing, and social media marketing, contribute significantly to market growth. Leading players like SAS Institute, Accenture, IBM, and Salesforce are actively investing in R&D, enhancing their platform capabilities and expanding their market share through strategic partnerships and acquisitions. The strong presence of these established players, along with emerging innovative companies, creates a dynamic and competitive landscape.
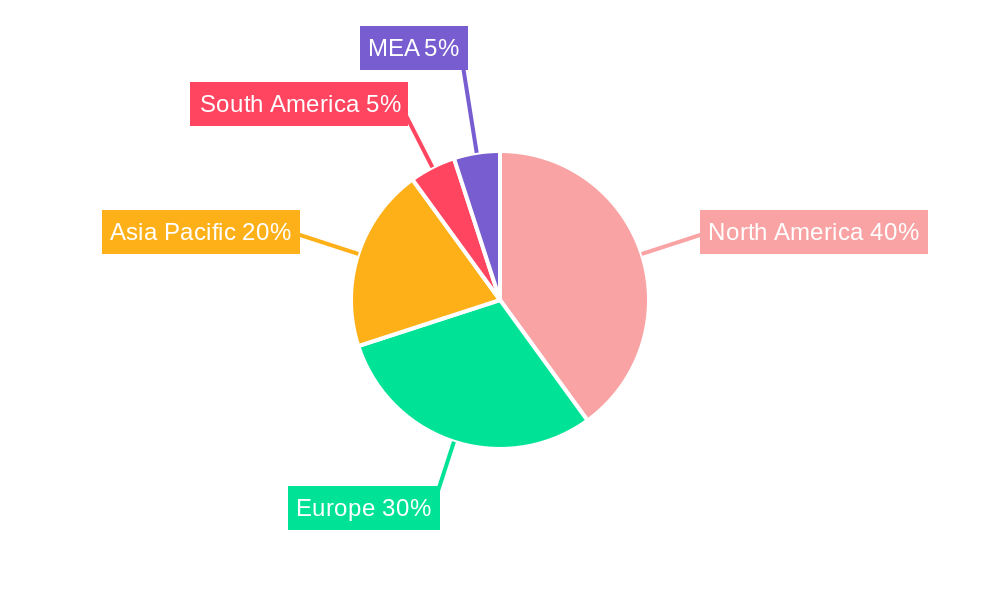
Geographical distribution reveals North America currently holding a significant market share, driven by early adoption and a strong technology infrastructure. However, the Asia-Pacific region is expected to witness the fastest growth in the forecast period, fueled by increasing digitalization and a burgeoning e-commerce sector. The robust growth is, however, subject to certain restraints. Data security concerns, the complexity of implementing and integrating analytics platforms, and the need for skilled professionals to interpret and utilize the generated data pose challenges for market expansion. Furthermore, the high cost of advanced analytics solutions can limit accessibility for smaller businesses. Nevertheless, the overall outlook remains optimistic, driven by the continuous advancements in technology, increasing demand for data-driven marketing, and the growing importance of personalized customer experiences.
Marketing Analytics Platform Industry: A Comprehensive Market Report (2019-2033)
This comprehensive report provides a detailed analysis of the Marketing Analytics Platform industry, covering market dynamics, growth trends, regional dominance, product landscape, key players, and future outlook. The study period spans from 2019 to 2033, with 2025 as the base and estimated year. The report delves into the parent market of Marketing Technology (MarTech) and the child market of Marketing Analytics Platforms, offering granular insights for informed decision-making. The market size is projected to reach xx Million by 2033.
Marketing Analytics Platform Industry Market Dynamics & Structure
The Marketing Analytics Platform industry is characterized by a moderately concentrated market structure, with a few major players holding significant market share. Technological innovation, particularly in AI and machine learning, is a key driver of growth, while regulatory frameworks related to data privacy (e.g., GDPR) significantly influence market practices. Competitive substitutes include in-house analytics solutions and simpler reporting tools. The end-user demographic is diverse, spanning various industries, with Retail and BFSI sectors being major consumers. M&A activity is frequent, reflecting the industry's dynamic nature and consolidation trends.
- Market Concentration: Top 5 players hold approximately xx% of the market share in 2025 (estimated).
- Technological Innovation: AI-powered predictive analytics and real-time data processing are major innovation drivers.
- Regulatory Landscape: Data privacy regulations impact data collection and usage, influencing platform development.
- Competitive Substitutes: In-house solutions and basic reporting tools offer alternatives, albeit with limitations.
- End-User Demographics: Retail, BFSI, and Manufacturing sectors represent significant market segments.
- M&A Activity: An average of xx M&A deals were recorded annually during the historical period (2019-2024).
Marketing Analytics Platform Industry Growth Trends & Insights
The global Marketing Analytics Platform market witnessed robust growth during the historical period (2019-2024), with a CAGR of xx%. This growth is primarily attributed to the increasing adoption of digital marketing strategies, the rising need for data-driven decision-making, and the proliferation of cloud-based solutions. The market is expected to maintain a healthy growth trajectory during the forecast period (2025-2033), driven by factors such as the increasing adoption of advanced analytics techniques, the growing importance of personalized marketing, and the expanding use of marketing automation tools. Market penetration is expected to reach xx% by 2033. Technological disruptions, like the rise of serverless computing and edge analytics, further accelerate adoption rates. Consumer behavior shifts toward personalized experiences and increased data privacy concerns also influence the market.
Dominant Regions, Countries, or Segments in Marketing Analytics Platform Industry
North America currently holds the largest market share in the Marketing Analytics Platform industry, followed by Europe and Asia-Pacific. Within segments, Cloud deployment dominates due to scalability and cost-effectiveness. In terms of applications, Online Marketing and Email Marketing lead the market, driven by their established roles in digital marketing strategies. The Retail and BFSI sectors are the largest end-user segments due to their extensive marketing needs and high data volumes.
- Leading Region: North America, driven by robust digital adoption and advanced technological infrastructure.
- Dominant Deployment: Cloud, favored for scalability and cost advantages.
- Largest Application Segment: Online Marketing and Email Marketing, reflecting established digital marketing practices.
- Key End-User Sector: Retail and BFSI, representing substantial marketing budgets and data generation.
- Growth Drivers: Strong digital marketing ecosystem, high internet penetration, and favorable economic conditions.
Marketing Analytics Platform Industry Product Landscape
The Marketing Analytics Platform market features a diverse range of products, from comprehensive enterprise solutions to specialized tools focusing on specific marketing channels. Key product innovations include AI-powered predictive modeling, real-time data dashboards, and advanced visualization capabilities. These platforms offer unique selling propositions such as improved campaign ROI measurement, enhanced customer segmentation, and automated reporting. Technological advancements focus on improving data integration, enhancing data security, and providing more intuitive user interfaces.
Key Drivers, Barriers & Challenges in Marketing Analytics Platform Industry
Key Drivers:
- Increasing adoption of digital marketing strategies.
- The growing need for data-driven decision-making.
- Rise of cloud-based solutions for improved scalability and accessibility.
- Technological advancements in AI and machine learning.
Challenges and Restraints:
- Data privacy concerns and regulatory compliance requirements.
- High initial investment costs for enterprise solutions.
- Integration complexities with existing marketing technology stacks.
- Skills gap in data analytics and interpretation. This results in approximately xx Million USD in lost revenue annually (estimated).
Emerging Opportunities in Marketing Analytics Platform Industry
Untapped markets in developing economies, coupled with the increasing adoption of digital marketing by SMEs, present significant opportunities. Innovative applications of AI in personalized marketing, predictive customer journey mapping, and fraud detection are also expected to drive growth. Evolving consumer preferences for personalized and transparent experiences further emphasize the need for advanced analytics.
Growth Accelerators in the Marketing Analytics Platform Industry Industry
Strategic partnerships between technology providers and marketing agencies accelerate market growth by extending reach and expertise. Technological breakthroughs in AI and machine learning, enhancing predictive capabilities and automation, also contribute. Market expansion strategies targeting emerging economies, where digital marketing adoption is rapidly growing, will drive further growth.
Key Players Shaping the Marketing Analytics Platform Industry Market
- SAS Institute Inc
- Accenture PLC
- IBM Corporation
- Teradata Corporation
- Microsoft Corporation
- Adobe Systems Incorporated
- Salesforce Com Inc
- Pegasystems Inc
- Neustar Inc
- Oracle Corporation
- Tableau Software
- Google LLC
- List Not Exhaustive
Notable Milestones in Marketing Analytics Platform Industry Sector
- April 2024: Cloud Software Group Inc. and Microsoft Corp. announced an eight-year strategic partnership, committing USD 65 billion to Microsoft cloud and AI capabilities. This significantly boosts cloud-based marketing analytics solutions.
- February 2024: Accenture's acquisition of GemSeek enhanced its customer experience analytics offerings, strengthening its market position.
- February 2023: Adobe's collaboration with Qualcomm for B2B marketing using Adobe Experience Cloud broadened the platform's reach and application.
In-Depth Marketing Analytics Platform Industry Market Outlook
The Marketing Analytics Platform market is poised for continued strong growth, fueled by ongoing technological advancements, increasing data volumes, and the growing demand for data-driven marketing decisions. Strategic partnerships and acquisitions will further consolidate the market, while new entrants focusing on niche applications will continue to emerge. The focus on AI-powered insights and improved data privacy compliance will shape the future landscape, creating ample opportunities for innovation and market expansion.
Marketing Analytics Platform Industry Segmentation
-
1. Deployment
- 1.1. Cloud
- 1.2. On-premise
-
2. Application
- 2.1. Online Marketing
- 2.2. E-mail Marketing
- 2.3. Content Marketing
- 2.4. Social Media Marketing
- 2.5. Other Applications
-
3. End User
- 3.1. Retail
- 3.2. BFSI
- 3.3. Education
- 3.4. Healthcare
- 3.5. Manufactuing
- 3.6. Travel and Hospitality
- 3.7. Other End Users
Marketing Analytics Platform Industry Segmentation By Geography
- 1. North America
- 2. Europe
- 3. Asia
- 4. Australia and New Zealand
- 5. Latin America
- 6. Middle East and Africa
Marketing Analytics Platform Industry REPORT HIGHLIGHTS
| Aspects | Details |
|---|---|
| Study Period | 2019-2033 |
| Base Year | 2024 |
| Estimated Year | 2025 |
| Forecast Period | 2025-2033 |
| Historical Period | 2019-2024 |
| Growth Rate | CAGR of 12.84% from 2019-2033 |
| Segmentation |
|
Table of Contents
- 1. Introduction
- 1.1. Research Scope
- 1.2. Market Segmentation
- 1.3. Research Methodology
- 1.4. Definitions and Assumptions
- 2. Executive Summary
- 2.1. Introduction
- 3. Market Dynamics
- 3.1. Introduction
- 3.2. Market Drivers
- 3.2.1. Increase in Social Media Channels; Increasing Need to Utilize Marketing Budgets for an Effective ROI; Adoption of Cloud Technology and Big Data
- 3.3. Market Restrains
- 3.3.1. High Cost of Implementation and System Integration Issues for Marketing Analytics Software; Availability of Many Free Open Source Software
- 3.4. Market Trends
- 3.4.1. The Cloud-based Solutions Segment is Expected to Witness Growth
- 4. Market Factor Analysis
- 4.1. Porters Five Forces
- 4.2. Supply/Value Chain
- 4.3. PESTEL analysis
- 4.4. Market Entropy
- 4.5. Patent/Trademark Analysis
- 5. Global Marketing Analytics Platform Industry Analysis, Insights and Forecast, 2019-2031
- 5.1. Market Analysis, Insights and Forecast - by Deployment
- 5.1.1. Cloud
- 5.1.2. On-premise
- 5.2. Market Analysis, Insights and Forecast - by Application
- 5.2.1. Online Marketing
- 5.2.2. E-mail Marketing
- 5.2.3. Content Marketing
- 5.2.4. Social Media Marketing
- 5.2.5. Other Applications
- 5.3. Market Analysis, Insights and Forecast - by End User
- 5.3.1. Retail
- 5.3.2. BFSI
- 5.3.3. Education
- 5.3.4. Healthcare
- 5.3.5. Manufactuing
- 5.3.6. Travel and Hospitality
- 5.3.7. Other End Users
- 5.4. Market Analysis, Insights and Forecast - by Region
- 5.4.1. North America
- 5.4.2. Europe
- 5.4.3. Asia
- 5.4.4. Australia and New Zealand
- 5.4.5. Latin America
- 5.4.6. Middle East and Africa
- 5.1. Market Analysis, Insights and Forecast - by Deployment
- 6. North America Marketing Analytics Platform Industry Analysis, Insights and Forecast, 2019-2031
- 6.1. Market Analysis, Insights and Forecast - by Deployment
- 6.1.1. Cloud
- 6.1.2. On-premise
- 6.2. Market Analysis, Insights and Forecast - by Application
- 6.2.1. Online Marketing
- 6.2.2. E-mail Marketing
- 6.2.3. Content Marketing
- 6.2.4. Social Media Marketing
- 6.2.5. Other Applications
- 6.3. Market Analysis, Insights and Forecast - by End User
- 6.3.1. Retail
- 6.3.2. BFSI
- 6.3.3. Education
- 6.3.4. Healthcare
- 6.3.5. Manufactuing
- 6.3.6. Travel and Hospitality
- 6.3.7. Other End Users
- 6.1. Market Analysis, Insights and Forecast - by Deployment
- 7. Europe Marketing Analytics Platform Industry Analysis, Insights and Forecast, 2019-2031
- 7.1. Market Analysis, Insights and Forecast - by Deployment
- 7.1.1. Cloud
- 7.1.2. On-premise
- 7.2. Market Analysis, Insights and Forecast - by Application
- 7.2.1. Online Marketing
- 7.2.2. E-mail Marketing
- 7.2.3. Content Marketing
- 7.2.4. Social Media Marketing
- 7.2.5. Other Applications
- 7.3. Market Analysis, Insights and Forecast - by End User
- 7.3.1. Retail
- 7.3.2. BFSI
- 7.3.3. Education
- 7.3.4. Healthcare
- 7.3.5. Manufactuing
- 7.3.6. Travel and Hospitality
- 7.3.7. Other End Users
- 7.1. Market Analysis, Insights and Forecast - by Deployment
- 8. Asia Marketing Analytics Platform Industry Analysis, Insights and Forecast, 2019-2031
- 8.1. Market Analysis, Insights and Forecast - by Deployment
- 8.1.1. Cloud
- 8.1.2. On-premise
- 8.2. Market Analysis, Insights and Forecast - by Application
- 8.2.1. Online Marketing
- 8.2.2. E-mail Marketing
- 8.2.3. Content Marketing
- 8.2.4. Social Media Marketing
- 8.2.5. Other Applications
- 8.3. Market Analysis, Insights and Forecast - by End User
- 8.3.1. Retail
- 8.3.2. BFSI
- 8.3.3. Education
- 8.3.4. Healthcare
- 8.3.5. Manufactuing
- 8.3.6. Travel and Hospitality
- 8.3.7. Other End Users
- 8.1. Market Analysis, Insights and Forecast - by Deployment
- 9. Australia and New Zealand Marketing Analytics Platform Industry Analysis, Insights and Forecast, 2019-2031
- 9.1. Market Analysis, Insights and Forecast - by Deployment
- 9.1.1. Cloud
- 9.1.2. On-premise
- 9.2. Market Analysis, Insights and Forecast - by Application
- 9.2.1. Online Marketing
- 9.2.2. E-mail Marketing
- 9.2.3. Content Marketing
- 9.2.4. Social Media Marketing
- 9.2.5. Other Applications
- 9.3. Market Analysis, Insights and Forecast - by End User
- 9.3.1. Retail
- 9.3.2. BFSI
- 9.3.3. Education
- 9.3.4. Healthcare
- 9.3.5. Manufactuing
- 9.3.6. Travel and Hospitality
- 9.3.7. Other End Users
- 9.1. Market Analysis, Insights and Forecast - by Deployment
- 10. Latin America Marketing Analytics Platform Industry Analysis, Insights and Forecast, 2019-2031
- 10.1. Market Analysis, Insights and Forecast - by Deployment
- 10.1.1. Cloud
- 10.1.2. On-premise
- 10.2. Market Analysis, Insights and Forecast - by Application
- 10.2.1. Online Marketing
- 10.2.2. E-mail Marketing
- 10.2.3. Content Marketing
- 10.2.4. Social Media Marketing
- 10.2.5. Other Applications
- 10.3. Market Analysis, Insights and Forecast - by End User
- 10.3.1. Retail
- 10.3.2. BFSI
- 10.3.3. Education
- 10.3.4. Healthcare
- 10.3.5. Manufactuing
- 10.3.6. Travel and Hospitality
- 10.3.7. Other End Users
- 10.1. Market Analysis, Insights and Forecast - by Deployment
- 11. Middle East and Africa Marketing Analytics Platform Industry Analysis, Insights and Forecast, 2019-2031
- 11.1. Market Analysis, Insights and Forecast - by Deployment
- 11.1.1. Cloud
- 11.1.2. On-premise
- 11.2. Market Analysis, Insights and Forecast - by Application
- 11.2.1. Online Marketing
- 11.2.2. E-mail Marketing
- 11.2.3. Content Marketing
- 11.2.4. Social Media Marketing
- 11.2.5. Other Applications
- 11.3. Market Analysis, Insights and Forecast - by End User
- 11.3.1. Retail
- 11.3.2. BFSI
- 11.3.3. Education
- 11.3.4. Healthcare
- 11.3.5. Manufactuing
- 11.3.6. Travel and Hospitality
- 11.3.7. Other End Users
- 11.1. Market Analysis, Insights and Forecast - by Deployment
- 12. North America Marketing Analytics Platform Industry Analysis, Insights and Forecast, 2019-2031
- 12.1. Market Analysis, Insights and Forecast - By Country/Sub-region
- 12.1.1 United States
- 12.1.2 Canada
- 12.1.3 Mexico
- 13. Europe Marketing Analytics Platform Industry Analysis, Insights and Forecast, 2019-2031
- 13.1. Market Analysis, Insights and Forecast - By Country/Sub-region
- 13.1.1 Germany
- 13.1.2 United Kingdom
- 13.1.3 France
- 13.1.4 Spain
- 13.1.5 Italy
- 13.1.6 Spain
- 13.1.7 Belgium
- 13.1.8 Netherland
- 13.1.9 Nordics
- 13.1.10 Rest of Europe
- 14. Asia Pacific Marketing Analytics Platform Industry Analysis, Insights and Forecast, 2019-2031
- 14.1. Market Analysis, Insights and Forecast - By Country/Sub-region
- 14.1.1 China
- 14.1.2 Japan
- 14.1.3 India
- 14.1.4 South Korea
- 14.1.5 Southeast Asia
- 14.1.6 Australia
- 14.1.7 Indonesia
- 14.1.8 Phillipes
- 14.1.9 Singapore
- 14.1.10 Thailandc
- 14.1.11 Rest of Asia Pacific
- 15. South America Marketing Analytics Platform Industry Analysis, Insights and Forecast, 2019-2031
- 15.1. Market Analysis, Insights and Forecast - By Country/Sub-region
- 15.1.1 Brazil
- 15.1.2 Argentina
- 15.1.3 Peru
- 15.1.4 Chile
- 15.1.5 Colombia
- 15.1.6 Ecuador
- 15.1.7 Venezuela
- 15.1.8 Rest of South America
- 16. North America Marketing Analytics Platform Industry Analysis, Insights and Forecast, 2019-2031
- 16.1. Market Analysis, Insights and Forecast - By Country/Sub-region
- 16.1.1 United States
- 16.1.2 Canada
- 16.1.3 Mexico
- 17. MEA Marketing Analytics Platform Industry Analysis, Insights and Forecast, 2019-2031
- 17.1. Market Analysis, Insights and Forecast - By Country/Sub-region
- 17.1.1 United Arab Emirates
- 17.1.2 Saudi Arabia
- 17.1.3 South Africa
- 17.1.4 Rest of Middle East and Africa
- 18. Competitive Analysis
- 18.1. Global Market Share Analysis 2024
- 18.2. Company Profiles
- 18.2.1 SAS Institute Inc
- 18.2.1.1. Overview
- 18.2.1.2. Products
- 18.2.1.3. SWOT Analysis
- 18.2.1.4. Recent Developments
- 18.2.1.5. Financials (Based on Availability)
- 18.2.2 Accenture PLC
- 18.2.2.1. Overview
- 18.2.2.2. Products
- 18.2.2.3. SWOT Analysis
- 18.2.2.4. Recent Developments
- 18.2.2.5. Financials (Based on Availability)
- 18.2.3 IBM Corporation
- 18.2.3.1. Overview
- 18.2.3.2. Products
- 18.2.3.3. SWOT Analysis
- 18.2.3.4. Recent Developments
- 18.2.3.5. Financials (Based on Availability)
- 18.2.4 Teradata Corporation
- 18.2.4.1. Overview
- 18.2.4.2. Products
- 18.2.4.3. SWOT Analysis
- 18.2.4.4. Recent Developments
- 18.2.4.5. Financials (Based on Availability)
- 18.2.5 Microsoft Corporation
- 18.2.5.1. Overview
- 18.2.5.2. Products
- 18.2.5.3. SWOT Analysis
- 18.2.5.4. Recent Developments
- 18.2.5.5. Financials (Based on Availability)
- 18.2.6 Adobe Systems Incorporated
- 18.2.6.1. Overview
- 18.2.6.2. Products
- 18.2.6.3. SWOT Analysis
- 18.2.6.4. Recent Developments
- 18.2.6.5. Financials (Based on Availability)
- 18.2.7 Salesforce Com Inc
- 18.2.7.1. Overview
- 18.2.7.2. Products
- 18.2.7.3. SWOT Analysis
- 18.2.7.4. Recent Developments
- 18.2.7.5. Financials (Based on Availability)
- 18.2.8 Pegasystems Inc
- 18.2.8.1. Overview
- 18.2.8.2. Products
- 18.2.8.3. SWOT Analysis
- 18.2.8.4. Recent Developments
- 18.2.8.5. Financials (Based on Availability)
- 18.2.9 Neustar Inc
- 18.2.9.1. Overview
- 18.2.9.2. Products
- 18.2.9.3. SWOT Analysis
- 18.2.9.4. Recent Developments
- 18.2.9.5. Financials (Based on Availability)
- 18.2.10 Oracle Corporation
- 18.2.10.1. Overview
- 18.2.10.2. Products
- 18.2.10.3. SWOT Analysis
- 18.2.10.4. Recent Developments
- 18.2.10.5. Financials (Based on Availability)
- 18.2.11 Tableau Software
- 18.2.11.1. Overview
- 18.2.11.2. Products
- 18.2.11.3. SWOT Analysis
- 18.2.11.4. Recent Developments
- 18.2.11.5. Financials (Based on Availability)
- 18.2.12 Google LLC*List Not Exhaustive
- 18.2.12.1. Overview
- 18.2.12.2. Products
- 18.2.12.3. SWOT Analysis
- 18.2.12.4. Recent Developments
- 18.2.12.5. Financials (Based on Availability)
- 18.2.1 SAS Institute Inc
List of Figures
- Figure 1: Global Marketing Analytics Platform Industry Revenue Breakdown (Million, %) by Region 2024 & 2032
- Figure 2: North America Marketing Analytics Platform Industry Revenue (Million), by Country 2024 & 2032
- Figure 3: North America Marketing Analytics Platform Industry Revenue Share (%), by Country 2024 & 2032
- Figure 4: Europe Marketing Analytics Platform Industry Revenue (Million), by Country 2024 & 2032
- Figure 5: Europe Marketing Analytics Platform Industry Revenue Share (%), by Country 2024 & 2032
- Figure 6: Asia Pacific Marketing Analytics Platform Industry Revenue (Million), by Country 2024 & 2032
- Figure 7: Asia Pacific Marketing Analytics Platform Industry Revenue Share (%), by Country 2024 & 2032
- Figure 8: South America Marketing Analytics Platform Industry Revenue (Million), by Country 2024 & 2032
- Figure 9: South America Marketing Analytics Platform Industry Revenue Share (%), by Country 2024 & 2032
- Figure 10: North America Marketing Analytics Platform Industry Revenue (Million), by Country 2024 & 2032
- Figure 11: North America Marketing Analytics Platform Industry Revenue Share (%), by Country 2024 & 2032
- Figure 12: MEA Marketing Analytics Platform Industry Revenue (Million), by Country 2024 & 2032
- Figure 13: MEA Marketing Analytics Platform Industry Revenue Share (%), by Country 2024 & 2032
- Figure 14: North America Marketing Analytics Platform Industry Revenue (Million), by Deployment 2024 & 2032
- Figure 15: North America Marketing Analytics Platform Industry Revenue Share (%), by Deployment 2024 & 2032
- Figure 16: North America Marketing Analytics Platform Industry Revenue (Million), by Application 2024 & 2032
- Figure 17: North America Marketing Analytics Platform Industry Revenue Share (%), by Application 2024 & 2032
- Figure 18: North America Marketing Analytics Platform Industry Revenue (Million), by End User 2024 & 2032
- Figure 19: North America Marketing Analytics Platform Industry Revenue Share (%), by End User 2024 & 2032
- Figure 20: North America Marketing Analytics Platform Industry Revenue (Million), by Country 2024 & 2032
- Figure 21: North America Marketing Analytics Platform Industry Revenue Share (%), by Country 2024 & 2032
- Figure 22: Europe Marketing Analytics Platform Industry Revenue (Million), by Deployment 2024 & 2032
- Figure 23: Europe Marketing Analytics Platform Industry Revenue Share (%), by Deployment 2024 & 2032
- Figure 24: Europe Marketing Analytics Platform Industry Revenue (Million), by Application 2024 & 2032
- Figure 25: Europe Marketing Analytics Platform Industry Revenue Share (%), by Application 2024 & 2032
- Figure 26: Europe Marketing Analytics Platform Industry Revenue (Million), by End User 2024 & 2032
- Figure 27: Europe Marketing Analytics Platform Industry Revenue Share (%), by End User 2024 & 2032
- Figure 28: Europe Marketing Analytics Platform Industry Revenue (Million), by Country 2024 & 2032
- Figure 29: Europe Marketing Analytics Platform Industry Revenue Share (%), by Country 2024 & 2032
- Figure 30: Asia Marketing Analytics Platform Industry Revenue (Million), by Deployment 2024 & 2032
- Figure 31: Asia Marketing Analytics Platform Industry Revenue Share (%), by Deployment 2024 & 2032
- Figure 32: Asia Marketing Analytics Platform Industry Revenue (Million), by Application 2024 & 2032
- Figure 33: Asia Marketing Analytics Platform Industry Revenue Share (%), by Application 2024 & 2032
- Figure 34: Asia Marketing Analytics Platform Industry Revenue (Million), by End User 2024 & 2032
- Figure 35: Asia Marketing Analytics Platform Industry Revenue Share (%), by End User 2024 & 2032
- Figure 36: Asia Marketing Analytics Platform Industry Revenue (Million), by Country 2024 & 2032
- Figure 37: Asia Marketing Analytics Platform Industry Revenue Share (%), by Country 2024 & 2032
- Figure 38: Australia and New Zealand Marketing Analytics Platform Industry Revenue (Million), by Deployment 2024 & 2032
- Figure 39: Australia and New Zealand Marketing Analytics Platform Industry Revenue Share (%), by Deployment 2024 & 2032
- Figure 40: Australia and New Zealand Marketing Analytics Platform Industry Revenue (Million), by Application 2024 & 2032
- Figure 41: Australia and New Zealand Marketing Analytics Platform Industry Revenue Share (%), by Application 2024 & 2032
- Figure 42: Australia and New Zealand Marketing Analytics Platform Industry Revenue (Million), by End User 2024 & 2032
- Figure 43: Australia and New Zealand Marketing Analytics Platform Industry Revenue Share (%), by End User 2024 & 2032
- Figure 44: Australia and New Zealand Marketing Analytics Platform Industry Revenue (Million), by Country 2024 & 2032
- Figure 45: Australia and New Zealand Marketing Analytics Platform Industry Revenue Share (%), by Country 2024 & 2032
- Figure 46: Latin America Marketing Analytics Platform Industry Revenue (Million), by Deployment 2024 & 2032
- Figure 47: Latin America Marketing Analytics Platform Industry Revenue Share (%), by Deployment 2024 & 2032
- Figure 48: Latin America Marketing Analytics Platform Industry Revenue (Million), by Application 2024 & 2032
- Figure 49: Latin America Marketing Analytics Platform Industry Revenue Share (%), by Application 2024 & 2032
- Figure 50: Latin America Marketing Analytics Platform Industry Revenue (Million), by End User 2024 & 2032
- Figure 51: Latin America Marketing Analytics Platform Industry Revenue Share (%), by End User 2024 & 2032
- Figure 52: Latin America Marketing Analytics Platform Industry Revenue (Million), by Country 2024 & 2032
- Figure 53: Latin America Marketing Analytics Platform Industry Revenue Share (%), by Country 2024 & 2032
- Figure 54: Middle East and Africa Marketing Analytics Platform Industry Revenue (Million), by Deployment 2024 & 2032
- Figure 55: Middle East and Africa Marketing Analytics Platform Industry Revenue Share (%), by Deployment 2024 & 2032
- Figure 56: Middle East and Africa Marketing Analytics Platform Industry Revenue (Million), by Application 2024 & 2032
- Figure 57: Middle East and Africa Marketing Analytics Platform Industry Revenue Share (%), by Application 2024 & 2032
- Figure 58: Middle East and Africa Marketing Analytics Platform Industry Revenue (Million), by End User 2024 & 2032
- Figure 59: Middle East and Africa Marketing Analytics Platform Industry Revenue Share (%), by End User 2024 & 2032
- Figure 60: Middle East and Africa Marketing Analytics Platform Industry Revenue (Million), by Country 2024 & 2032
- Figure 61: Middle East and Africa Marketing Analytics Platform Industry Revenue Share (%), by Country 2024 & 2032
List of Tables
- Table 1: Global Marketing Analytics Platform Industry Revenue Million Forecast, by Region 2019 & 2032
- Table 2: Global Marketing Analytics Platform Industry Revenue Million Forecast, by Deployment 2019 & 2032
- Table 3: Global Marketing Analytics Platform Industry Revenue Million Forecast, by Application 2019 & 2032
- Table 4: Global Marketing Analytics Platform Industry Revenue Million Forecast, by End User 2019 & 2032
- Table 5: Global Marketing Analytics Platform Industry Revenue Million Forecast, by Region 2019 & 2032
- Table 6: Global Marketing Analytics Platform Industry Revenue Million Forecast, by Country 2019 & 2032
- Table 7: United States Marketing Analytics Platform Industry Revenue (Million) Forecast, by Application 2019 & 2032
- Table 8: Canada Marketing Analytics Platform Industry Revenue (Million) Forecast, by Application 2019 & 2032
- Table 9: Mexico Marketing Analytics Platform Industry Revenue (Million) Forecast, by Application 2019 & 2032
- Table 10: Global Marketing Analytics Platform Industry Revenue Million Forecast, by Country 2019 & 2032
- Table 11: Germany Marketing Analytics Platform Industry Revenue (Million) Forecast, by Application 2019 & 2032
- Table 12: United Kingdom Marketing Analytics Platform Industry Revenue (Million) Forecast, by Application 2019 & 2032
- Table 13: France Marketing Analytics Platform Industry Revenue (Million) Forecast, by Application 2019 & 2032
- Table 14: Spain Marketing Analytics Platform Industry Revenue (Million) Forecast, by Application 2019 & 2032
- Table 15: Italy Marketing Analytics Platform Industry Revenue (Million) Forecast, by Application 2019 & 2032
- Table 16: Spain Marketing Analytics Platform Industry Revenue (Million) Forecast, by Application 2019 & 2032
- Table 17: Belgium Marketing Analytics Platform Industry Revenue (Million) Forecast, by Application 2019 & 2032
- Table 18: Netherland Marketing Analytics Platform Industry Revenue (Million) Forecast, by Application 2019 & 2032
- Table 19: Nordics Marketing Analytics Platform Industry Revenue (Million) Forecast, by Application 2019 & 2032
- Table 20: Rest of Europe Marketing Analytics Platform Industry Revenue (Million) Forecast, by Application 2019 & 2032
- Table 21: Global Marketing Analytics Platform Industry Revenue Million Forecast, by Country 2019 & 2032
- Table 22: China Marketing Analytics Platform Industry Revenue (Million) Forecast, by Application 2019 & 2032
- Table 23: Japan Marketing Analytics Platform Industry Revenue (Million) Forecast, by Application 2019 & 2032
- Table 24: India Marketing Analytics Platform Industry Revenue (Million) Forecast, by Application 2019 & 2032
- Table 25: South Korea Marketing Analytics Platform Industry Revenue (Million) Forecast, by Application 2019 & 2032
- Table 26: Southeast Asia Marketing Analytics Platform Industry Revenue (Million) Forecast, by Application 2019 & 2032
- Table 27: Australia Marketing Analytics Platform Industry Revenue (Million) Forecast, by Application 2019 & 2032
- Table 28: Indonesia Marketing Analytics Platform Industry Revenue (Million) Forecast, by Application 2019 & 2032
- Table 29: Phillipes Marketing Analytics Platform Industry Revenue (Million) Forecast, by Application 2019 & 2032
- Table 30: Singapore Marketing Analytics Platform Industry Revenue (Million) Forecast, by Application 2019 & 2032
- Table 31: Thailandc Marketing Analytics Platform Industry Revenue (Million) Forecast, by Application 2019 & 2032
- Table 32: Rest of Asia Pacific Marketing Analytics Platform Industry Revenue (Million) Forecast, by Application 2019 & 2032
- Table 33: Global Marketing Analytics Platform Industry Revenue Million Forecast, by Country 2019 & 2032
- Table 34: Brazil Marketing Analytics Platform Industry Revenue (Million) Forecast, by Application 2019 & 2032
- Table 35: Argentina Marketing Analytics Platform Industry Revenue (Million) Forecast, by Application 2019 & 2032
- Table 36: Peru Marketing Analytics Platform Industry Revenue (Million) Forecast, by Application 2019 & 2032
- Table 37: Chile Marketing Analytics Platform Industry Revenue (Million) Forecast, by Application 2019 & 2032
- Table 38: Colombia Marketing Analytics Platform Industry Revenue (Million) Forecast, by Application 2019 & 2032
- Table 39: Ecuador Marketing Analytics Platform Industry Revenue (Million) Forecast, by Application 2019 & 2032
- Table 40: Venezuela Marketing Analytics Platform Industry Revenue (Million) Forecast, by Application 2019 & 2032
- Table 41: Rest of South America Marketing Analytics Platform Industry Revenue (Million) Forecast, by Application 2019 & 2032
- Table 42: Global Marketing Analytics Platform Industry Revenue Million Forecast, by Country 2019 & 2032
- Table 43: United States Marketing Analytics Platform Industry Revenue (Million) Forecast, by Application 2019 & 2032
- Table 44: Canada Marketing Analytics Platform Industry Revenue (Million) Forecast, by Application 2019 & 2032
- Table 45: Mexico Marketing Analytics Platform Industry Revenue (Million) Forecast, by Application 2019 & 2032
- Table 46: Global Marketing Analytics Platform Industry Revenue Million Forecast, by Country 2019 & 2032
- Table 47: United Arab Emirates Marketing Analytics Platform Industry Revenue (Million) Forecast, by Application 2019 & 2032
- Table 48: Saudi Arabia Marketing Analytics Platform Industry Revenue (Million) Forecast, by Application 2019 & 2032
- Table 49: South Africa Marketing Analytics Platform Industry Revenue (Million) Forecast, by Application 2019 & 2032
- Table 50: Rest of Middle East and Africa Marketing Analytics Platform Industry Revenue (Million) Forecast, by Application 2019 & 2032
- Table 51: Global Marketing Analytics Platform Industry Revenue Million Forecast, by Deployment 2019 & 2032
- Table 52: Global Marketing Analytics Platform Industry Revenue Million Forecast, by Application 2019 & 2032
- Table 53: Global Marketing Analytics Platform Industry Revenue Million Forecast, by End User 2019 & 2032
- Table 54: Global Marketing Analytics Platform Industry Revenue Million Forecast, by Country 2019 & 2032
- Table 55: Global Marketing Analytics Platform Industry Revenue Million Forecast, by Deployment 2019 & 2032
- Table 56: Global Marketing Analytics Platform Industry Revenue Million Forecast, by Application 2019 & 2032
- Table 57: Global Marketing Analytics Platform Industry Revenue Million Forecast, by End User 2019 & 2032
- Table 58: Global Marketing Analytics Platform Industry Revenue Million Forecast, by Country 2019 & 2032
- Table 59: Global Marketing Analytics Platform Industry Revenue Million Forecast, by Deployment 2019 & 2032
- Table 60: Global Marketing Analytics Platform Industry Revenue Million Forecast, by Application 2019 & 2032
- Table 61: Global Marketing Analytics Platform Industry Revenue Million Forecast, by End User 2019 & 2032
- Table 62: Global Marketing Analytics Platform Industry Revenue Million Forecast, by Country 2019 & 2032
- Table 63: Global Marketing Analytics Platform Industry Revenue Million Forecast, by Deployment 2019 & 2032
- Table 64: Global Marketing Analytics Platform Industry Revenue Million Forecast, by Application 2019 & 2032
- Table 65: Global Marketing Analytics Platform Industry Revenue Million Forecast, by End User 2019 & 2032
- Table 66: Global Marketing Analytics Platform Industry Revenue Million Forecast, by Country 2019 & 2032
- Table 67: Global Marketing Analytics Platform Industry Revenue Million Forecast, by Deployment 2019 & 2032
- Table 68: Global Marketing Analytics Platform Industry Revenue Million Forecast, by Application 2019 & 2032
- Table 69: Global Marketing Analytics Platform Industry Revenue Million Forecast, by End User 2019 & 2032
- Table 70: Global Marketing Analytics Platform Industry Revenue Million Forecast, by Country 2019 & 2032
- Table 71: Global Marketing Analytics Platform Industry Revenue Million Forecast, by Deployment 2019 & 2032
- Table 72: Global Marketing Analytics Platform Industry Revenue Million Forecast, by Application 2019 & 2032
- Table 73: Global Marketing Analytics Platform Industry Revenue Million Forecast, by End User 2019 & 2032
- Table 74: Global Marketing Analytics Platform Industry Revenue Million Forecast, by Country 2019 & 2032
Frequently Asked Questions
1. What is the projected Compound Annual Growth Rate (CAGR) of the Marketing Analytics Platform Industry?
The projected CAGR is approximately 12.84%.
2. Which companies are prominent players in the Marketing Analytics Platform Industry?
Key companies in the market include SAS Institute Inc, Accenture PLC, IBM Corporation, Teradata Corporation, Microsoft Corporation, Adobe Systems Incorporated, Salesforce Com Inc, Pegasystems Inc, Neustar Inc, Oracle Corporation, Tableau Software, Google LLC*List Not Exhaustive.
3. What are the main segments of the Marketing Analytics Platform Industry?
The market segments include Deployment, Application, End User.
4. Can you provide details about the market size?
The market size is estimated to be USD 6.31 Million as of 2022.
5. What are some drivers contributing to market growth?
Increase in Social Media Channels; Increasing Need to Utilize Marketing Budgets for an Effective ROI; Adoption of Cloud Technology and Big Data.
6. What are the notable trends driving market growth?
The Cloud-based Solutions Segment is Expected to Witness Growth.
7. Are there any restraints impacting market growth?
High Cost of Implementation and System Integration Issues for Marketing Analytics Software; Availability of Many Free Open Source Software.
8. Can you provide examples of recent developments in the market?
April 2024: Cloud Software Group Inc. and Microsoft Corp. announced boosting their collaboration with an eight-year strategic partnership agreement. This alliance will help in go-to-market collaboration for the Citrix® virtual application and desktop platform to design new cloud and AI solutions. The company will make a USD 65 billion commitment to Microsoft cloud and AI capabilities.
9. What pricing options are available for accessing the report?
Pricing options include single-user, multi-user, and enterprise licenses priced at USD 4750, USD 5250, and USD 8750 respectively.
10. Is the market size provided in terms of value or volume?
The market size is provided in terms of value, measured in Million.
11. Are there any specific market keywords associated with the report?
Yes, the market keyword associated with the report is "Marketing Analytics Platform Industry," which aids in identifying and referencing the specific market segment covered.
12. How do I determine which pricing option suits my needs best?
The pricing options vary based on user requirements and access needs. Individual users may opt for single-user licenses, while businesses requiring broader access may choose multi-user or enterprise licenses for cost-effective access to the report.
13. Are there any additional resources or data provided in the Marketing Analytics Platform Industry report?
While the report offers comprehensive insights, it's advisable to review the specific contents or supplementary materials provided to ascertain if additional resources or data are available.
14. How can I stay updated on further developments or reports in the Marketing Analytics Platform Industry?
To stay informed about further developments, trends, and reports in the Marketing Analytics Platform Industry, consider subscribing to industry newsletters, following relevant companies and organizations, or regularly checking reputable industry news sources and publications.
Methodology
Step 1 - Identification of Relevant Samples Size from Population Database


Step 2 - Approaches for Defining Global Market Size (Value, Volume* & Price*)

Note*: In applicable scenarios
Step 3 - Data Sources
Primary Research
- Web Analytics
- Survey Reports
- Research Institute
- Latest Research Reports
- Opinion Leaders
Secondary Research
- Annual Reports
- White Paper
- Latest Press Release
- Industry Association
- Paid Database
- Investor Presentations

Step 4 - Data Triangulation
Involves using different sources of information in order to increase the validity of a study
These sources are likely to be stakeholders in a program - participants, other researchers, program staff, other community members, and so on.
Then we put all data in single framework & apply various statistical tools to find out the dynamic on the market.
During the analysis stage, feedback from the stakeholder groups would be compared to determine areas of agreement as well as areas of divergence


