

Key Insights
The global Telecom Power Systems market, valued at approximately $5.69 billion in 2024, is poised for substantial expansion. This growth is primarily driven by the continuous expansion of global telecommunications infrastructure and the escalating demand for dependable power solutions. An anticipated compound annual growth rate (CAGR) of 8.3% from 2024 to 2033 signifies robust market development. Key catalysts include the widespread deployment of 5G networks, the growth of data centers supporting cloud services, and the increasing adoption of advanced technologies like IoT and edge computing. These technologies necessitate highly reliable and efficient power systems to guarantee uninterrupted network operations and data availability.
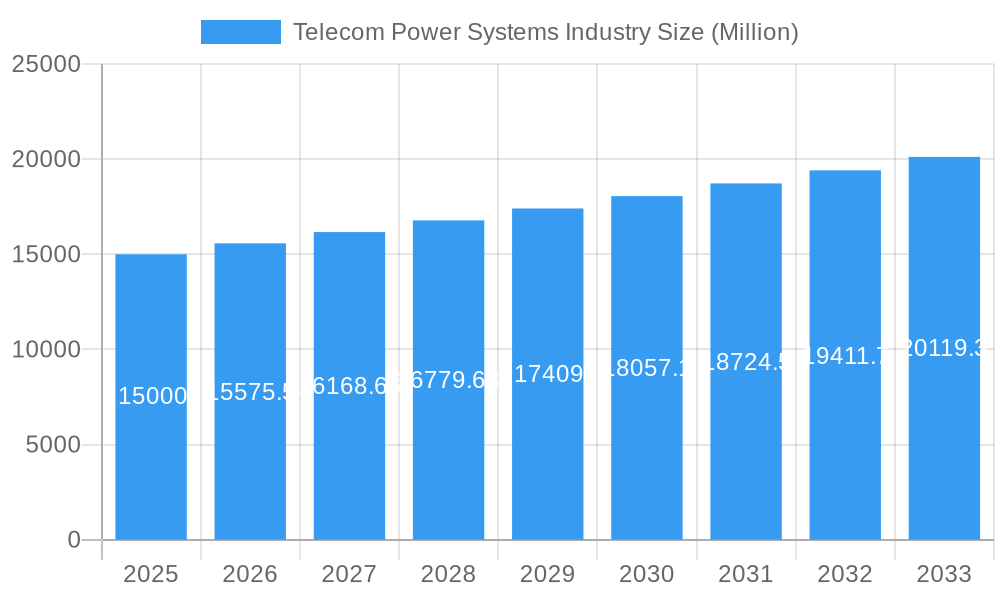
Telecom Power Systems Industry Market Size (In Billion)
Market segmentation highlights significant opportunities within high-power range systems, essential for core network infrastructure and metro applications. This demand is fueled by increased bandwidth requirements and the power demands of contemporary telecom equipment. While geographical distribution varies, the Asia Pacific region is projected to exhibit the most considerable growth, owing to rapid infrastructure development and a burgeoning mobile subscriber base. However, potential market restraints, such as high initial investment costs for advanced power systems and the requirement for skilled technicians for installation and maintenance, may influence the overall market growth trajectory.
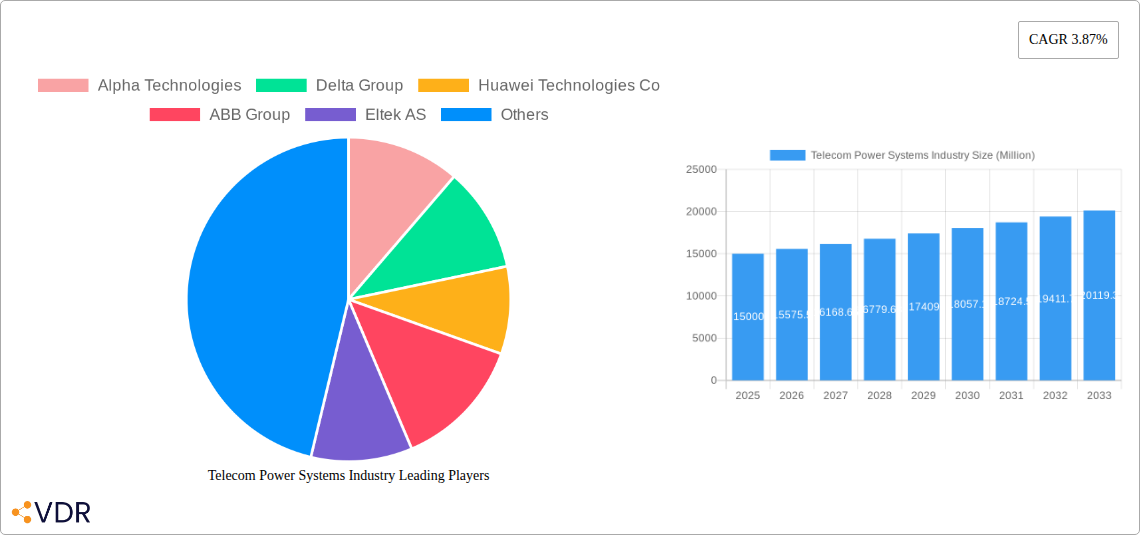
Telecom Power Systems Industry Company Market Share
The competitive landscape features established players including Alpha Technologies, Delta Group, Huawei Technologies Co, and ABB Group, who are actively engaged in market share acquisition through technological innovation and strategic alliances. Ongoing advancements in energy storage technologies, such as lithium-ion batteries, are enhancing the efficiency and lifespan of telecom power systems, thereby reducing operational expenditures for telecom operators. The market is also expected to experience increased consolidation as companies aim to broaden their product offerings and geographical presence. Additional growth drivers include governmental initiatives promoting digital infrastructure development and the rising adoption of virtualization and software-defined networking, which collectively enhance the overall efficiency and flexibility of telecom power systems. The forecast period (2024-2033) presents lucrative opportunities for market participants focusing on energy-efficient solutions, robust system management capabilities, and proactive maintenance services.
Telecom Power Systems Industry Market Report: 2019-2033
This comprehensive report provides an in-depth analysis of the Telecom Power Systems industry, encompassing market dynamics, growth trends, regional dominance, product landscape, key players, and future outlook. With a study period spanning 2019-2033, a base year of 2025, and a forecast period of 2025-2033, this report is an essential resource for industry professionals, investors, and strategic planners. The report covers the parent market of Power Systems and the child market of Telecom Power Systems. The market size is projected to reach xx Million units by 2033.
Telecom Power Systems Industry Market Dynamics & Structure
The Telecom Power Systems market exhibits a moderately consolidated structure, with key players like Alpha Technologies, Delta Group, Huawei Technologies Co, ABB Group, Eltek AS, Cummins Inc, ZTE Corporation, Schneider Electric, Efore Group, and Eaton Corporation holding significant market share. Technological innovation, particularly in areas like renewable energy integration and increased power efficiency, is a major driver. Regulatory frameworks concerning energy efficiency and grid stability significantly influence market dynamics. Competitive substitutes, such as alternative power sources for telecom infrastructure, pose a challenge. End-user demographics, with a focus on the expanding needs of 5G and IoT networks, are shaping demand. Mergers and acquisitions (M&A) activity remains significant, with xx M&A deals recorded between 2019 and 2024, driving consolidation and technological advancements.
- Market Concentration: Moderately consolidated, with top 10 players holding approximately xx% market share in 2024.
- Technological Innovation: Focus on energy efficiency, renewable energy integration, and improved power density.
- Regulatory Frameworks: Stringent energy efficiency standards and grid stability regulations influencing market growth.
- Competitive Substitutes: Alternative power sources and energy storage technologies pose a competitive threat.
- End-user Demographics: Growth driven by 5G deployment, IoT expansion, and increasing data traffic.
- M&A Trends: xx M&A deals between 2019-2024, leading to consolidation and technological advancements.
Telecom Power Systems Industry Growth Trends & Insights
The Telecom Power Systems market experienced significant growth between 2019 and 2024, driven primarily by the rapid expansion of 5G networks and the burgeoning Internet of Things (IoT). The market size witnessed a Compound Annual Growth Rate (CAGR) of xx% during this period, reaching xx Million units in 2024. Technological advancements, such as the adoption of virtualization and cloud technologies, are further accelerating growth. Consumer behavior shifts towards increased data consumption and reliance on mobile connectivity are driving demand for reliable and efficient power solutions. The market is expected to maintain a strong growth trajectory, with a projected CAGR of xx% from 2025 to 2033, exceeding xx Million units by 2033. Market penetration for advanced power systems is expected to reach xx% by 2033.
Dominant Regions, Countries, or Segments in Telecom Power Systems Industry
North America and Asia-Pacific are currently the dominant regions in the Telecom Power Systems market, fueled by robust telecom infrastructure development and significant investments in 5G networks. Within these regions, countries like the United States, China, and India stand out due to their large telecom markets and supportive government policies. In terms of segments, the High Power Range segment is experiencing the fastest growth, driven by the increasing power demands of large telecom facilities and data centers. The Core and Metro segments in end-user applications are also experiencing substantial growth, fuelled by the expansion of 5G networks and the increasing adoption of cloud-based services.
- Key Drivers:
- Robust telecom infrastructure development in North America and Asia-Pacific.
- Extensive 5G network deployment globally.
- Supportive government policies and incentives.
- Increasing data traffic and consumer demand for high-bandwidth connectivity.
- Dominance Factors:
- Large and mature telecom markets in North America and Asia-Pacific.
- Significant investments in 5G infrastructure and data centers.
- High demand for reliable and efficient power solutions for core and metro networks.
Telecom Power Systems Industry Product Landscape
The Telecom Power Systems market offers a diverse range of products, including rectifier systems, battery backup systems, power distribution systems, and power monitoring systems. Recent product innovations include highly efficient power conversion technologies, advanced battery management systems, and integrated power management solutions. These innovations offer enhanced reliability, reduced energy consumption, and improved operational efficiency. Key selling propositions include enhanced power density, improved energy efficiency, and seamless integration with existing telecom infrastructure.
Key Drivers, Barriers & Challenges in Telecom Power Systems Industry
Key Drivers: The rapid expansion of 5G networks, the growth of the Internet of Things (IoT), and increasing data traffic are driving significant demand for reliable and efficient telecom power systems. Government initiatives to improve telecom infrastructure and investments in renewable energy are also boosting market growth.
Key Challenges: Supply chain disruptions, particularly regarding critical components like semiconductors and batteries, pose significant challenges. Stringent regulatory compliance requirements and the need to meet stringent energy efficiency standards add to the complexity. Intense competition among established players and the emergence of new entrants also creates challenges. The rising cost of raw materials and transportation adds to the operational challenges.
Emerging Opportunities in Telecom Power Systems Industry
The growing adoption of renewable energy sources, such as solar and wind power, presents significant opportunities. The development of smart grid technologies and energy storage solutions offers avenues for innovation. Untapped markets in developing economies, particularly in Africa and Latin America, offer potential for market expansion. The integration of AI and machine learning for predictive maintenance and optimized power management also presents substantial opportunities.
Growth Accelerators in the Telecom Power Systems Industry
Technological breakthroughs in power conversion efficiency, battery technology, and renewable energy integration are key growth catalysts. Strategic partnerships between telecom operators, power system providers, and renewable energy companies are driving market expansion. Government policies promoting the development of advanced telecom infrastructure and investment in 5G network deployments are significant growth accelerators.
Key Players Shaping the Telecom Power Systems Industry Market
Notable Milestones in Telecom Power Systems Industry Sector
- December 2022: Telecom Egypt and Grid Telecom announced a collaboration to build a subsea system connecting Egypt and Greece, expanding telecom infrastructure and creating demand for power systems.
- May 2022: Launch of GatiShakti Sanchar portal in India streamlined RoW approvals, accelerating telecom infrastructure development and boosting demand for power systems.
In-Depth Telecom Power Systems Industry Market Outlook
The Telecom Power Systems market is poised for sustained growth over the next decade, driven by continuous advancements in 5G technology, the increasing adoption of IoT devices, and the expansion of data centers. Strategic partnerships, investments in renewable energy integration, and ongoing technological innovation will shape the market landscape. The market offers significant opportunities for companies offering energy-efficient, reliable, and scalable power solutions to meet the evolving needs of the telecom industry.
Telecom Power Systems Industry Segmentation
-
1. Power Range
- 1.1. Low
- 1.2. Medium
- 1.3. High
-
2. End-user Application
- 2.1. Access
- 2.2. Core
- 2.3. Metro
Telecom Power Systems Industry Segmentation By Geography
- 1. North America
- 2. Europe
- 3. Asia Pacific
- 4. Latin America
- 5. Middle East and Africa
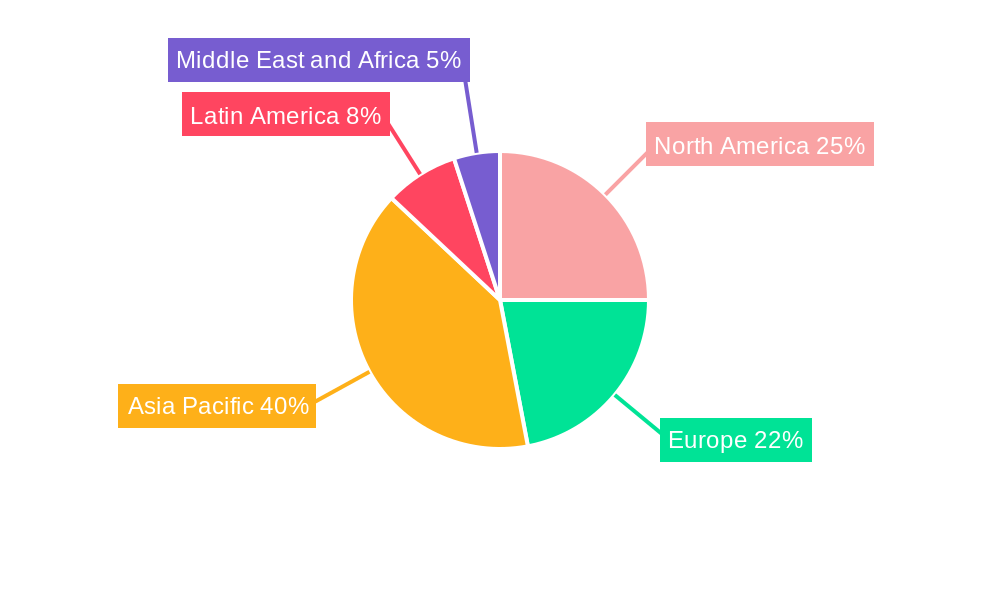
Telecom Power Systems Industry Regional Market Share
Geographic Coverage of Telecom Power Systems Industry
Telecom Power Systems Industry REPORT HIGHLIGHTS
| Aspects | Details |
|---|---|
| Study Period | 2020-2034 |
| Base Year | 2025 |
| Estimated Year | 2026 |
| Forecast Period | 2026-2034 |
| Historical Period | 2020-2025 |
| Growth Rate | CAGR of 8.3% from 2020-2034 |
| Segmentation |
|
Table of Contents
- 1. Introduction
- 1.1. Research Scope
- 1.2. Market Segmentation
- 1.3. Research Objective
- 1.4. Definitions and Assumptions
- 2. Executive Summary
- 2.1. Market Snapshot
- 3. Market Dynamics
- 3.1. Market Drivers
- 3.2. Market Restrains
- 3.3. Market Trends
- 3.4. Market Opportunities
- 4. Market Factor Analysis
- 4.1. Porters Five Forces
- 4.1.1. Bargaining Power of Suppliers
- 4.1.2. Bargaining Power of Buyers
- 4.1.3. Threat of New Entrants
- 4.1.4. Threat of Substitutes
- 4.1.5. Competitive Rivalry
- 4.2. PESTEL analysis
- 4.3. BCG Analysis
- 4.3.1. Stars (High Growth, High Market Share)
- 4.3.2. Cash Cows (Low Growth, High Market Share)
- 4.3.3. Question Mark (High Growth, Low Market Share)
- 4.3.4. Dogs (Low Growth, Low Market Share)
- 4.4. Ansoff Matrix Analysis
- 4.5. Supply Chain Analysis
- 4.6. Regulatory Landscape
- 4.7. Current Market Potential and Opportunity Assessment (TAM–SAM–SOM Framework)
- 4.8. VDR Analyst Note
- 4.1. Porters Five Forces
- 5. Market Analysis, Insights and Forecast 2021-2033
- 5.1. Market Analysis, Insights and Forecast - by Power Range
- 5.1.1. Low
- 5.1.2. Medium
- 5.1.3. High
- 5.2. Market Analysis, Insights and Forecast - by End-user Application
- 5.2.1. Access
- 5.2.2. Core
- 5.2.3. Metro
- 5.3. Market Analysis, Insights and Forecast - by Region
- 5.3.1. North America
- 5.3.2. Europe
- 5.3.3. Asia Pacific
- 5.3.4. Latin America
- 5.3.5. Middle East and Africa
- 5.1. Market Analysis, Insights and Forecast - by Power Range
- 6. Global Telecom Power Systems Industry Analysis, Insights and Forecast, 2021-2033
- 6.1. Market Analysis, Insights and Forecast - by Power Range
- 6.1.1. Low
- 6.1.2. Medium
- 6.1.3. High
- 6.2. Market Analysis, Insights and Forecast - by End-user Application
- 6.2.1. Access
- 6.2.2. Core
- 6.2.3. Metro
- 6.1. Market Analysis, Insights and Forecast - by Power Range
- 7. North America Telecom Power Systems Industry Analysis, Insights and Forecast, 2021-2033
- 7.1. Market Analysis, Insights and Forecast - by Power Range
- 7.1.1. Low
- 7.1.2. Medium
- 7.1.3. High
- 7.2. Market Analysis, Insights and Forecast - by End-user Application
- 7.2.1. Access
- 7.2.2. Core
- 7.2.3. Metro
- 7.1. Market Analysis, Insights and Forecast - by Power Range
- 8. Europe Telecom Power Systems Industry Analysis, Insights and Forecast, 2021-2033
- 8.1. Market Analysis, Insights and Forecast - by Power Range
- 8.1.1. Low
- 8.1.2. Medium
- 8.1.3. High
- 8.2. Market Analysis, Insights and Forecast - by End-user Application
- 8.2.1. Access
- 8.2.2. Core
- 8.2.3. Metro
- 8.1. Market Analysis, Insights and Forecast - by Power Range
- 9. Asia Pacific Telecom Power Systems Industry Analysis, Insights and Forecast, 2021-2033
- 9.1. Market Analysis, Insights and Forecast - by Power Range
- 9.1.1. Low
- 9.1.2. Medium
- 9.1.3. High
- 9.2. Market Analysis, Insights and Forecast - by End-user Application
- 9.2.1. Access
- 9.2.2. Core
- 9.2.3. Metro
- 9.1. Market Analysis, Insights and Forecast - by Power Range
- 10. Latin America Telecom Power Systems Industry Analysis, Insights and Forecast, 2021-2033
- 10.1. Market Analysis, Insights and Forecast - by Power Range
- 10.1.1. Low
- 10.1.2. Medium
- 10.1.3. High
- 10.2. Market Analysis, Insights and Forecast - by End-user Application
- 10.2.1. Access
- 10.2.2. Core
- 10.2.3. Metro
- 10.1. Market Analysis, Insights and Forecast - by Power Range
- 11. Middle East and Africa Telecom Power Systems Industry Analysis, Insights and Forecast, 2021-2033
- 11.1. Market Analysis, Insights and Forecast - by Power Range
- 11.1.1. Low
- 11.1.2. Medium
- 11.1.3. High
- 11.2. Market Analysis, Insights and Forecast - by End-user Application
- 11.2.1. Access
- 11.2.2. Core
- 11.2.3. Metro
- 11.1. Market Analysis, Insights and Forecast - by Power Range
- 12. Competitive Analysis
- 12.1. Company Profiles
- 12.1.1 Alpha Technologies
- 12.1.1.1. Company Overview
- 12.1.1.2. Products
- 12.1.1.3. Company Financials
- 12.1.1.4. SWOT Analysis
- 12.1.2 Delta Group
- 12.1.2.1. Company Overview
- 12.1.2.2. Products
- 12.1.2.3. Company Financials
- 12.1.2.4. SWOT Analysis
- 12.1.3 Huawei Technologies Co
- 12.1.3.1. Company Overview
- 12.1.3.2. Products
- 12.1.3.3. Company Financials
- 12.1.3.4. SWOT Analysis
- 12.1.4 ABB Group
- 12.1.4.1. Company Overview
- 12.1.4.2. Products
- 12.1.4.3. Company Financials
- 12.1.4.4. SWOT Analysis
- 12.1.5 Eltek AS
- 12.1.5.1. Company Overview
- 12.1.5.2. Products
- 12.1.5.3. Company Financials
- 12.1.5.4. SWOT Analysis
- 12.1.6 Cummins Inc
- 12.1.6.1. Company Overview
- 12.1.6.2. Products
- 12.1.6.3. Company Financials
- 12.1.6.4. SWOT Analysis
- 12.1.7 ZTE Corporation
- 12.1.7.1. Company Overview
- 12.1.7.2. Products
- 12.1.7.3. Company Financials
- 12.1.7.4. SWOT Analysis
- 12.1.8 Schneider Electric
- 12.1.8.1. Company Overview
- 12.1.8.2. Products
- 12.1.8.3. Company Financials
- 12.1.8.4. SWOT Analysis
- 12.1.9 Efore Group
- 12.1.9.1. Company Overview
- 12.1.9.2. Products
- 12.1.9.3. Company Financials
- 12.1.9.4. SWOT Analysis
- 12.1.10 Eaton Corporation
- 12.1.10.1. Company Overview
- 12.1.10.2. Products
- 12.1.10.3. Company Financials
- 12.1.10.4. SWOT Analysis
- 12.1.1 Alpha Technologies
- 12.2. Market Entropy
- 12.2.1 Company's Key Areas Served
- 12.2.2 Recent Developments
- 12.3. Company Market Share Analysis 2025
- 12.3.1 Top 5 Companies Market Share Analysis
- 12.3.2 Top 3 Companies Market Share Analysis
- 12.4. List of Potential Customers
- 13. Research Methodology
List of Figures
- Figure 1: Global Telecom Power Systems Industry Revenue Breakdown (billion, %) by Region 2025 & 2033
- Figure 2: North America Telecom Power Systems Industry Revenue (billion), by Power Range 2025 & 2033
- Figure 3: North America Telecom Power Systems Industry Revenue Share (%), by Power Range 2025 & 2033
- Figure 4: North America Telecom Power Systems Industry Revenue (billion), by End-user Application 2025 & 2033
- Figure 5: North America Telecom Power Systems Industry Revenue Share (%), by End-user Application 2025 & 2033
- Figure 6: North America Telecom Power Systems Industry Revenue (billion), by Country 2025 & 2033
- Figure 7: North America Telecom Power Systems Industry Revenue Share (%), by Country 2025 & 2033
- Figure 8: Europe Telecom Power Systems Industry Revenue (billion), by Power Range 2025 & 2033
- Figure 9: Europe Telecom Power Systems Industry Revenue Share (%), by Power Range 2025 & 2033
- Figure 10: Europe Telecom Power Systems Industry Revenue (billion), by End-user Application 2025 & 2033
- Figure 11: Europe Telecom Power Systems Industry Revenue Share (%), by End-user Application 2025 & 2033
- Figure 12: Europe Telecom Power Systems Industry Revenue (billion), by Country 2025 & 2033
- Figure 13: Europe Telecom Power Systems Industry Revenue Share (%), by Country 2025 & 2033
- Figure 14: Asia Pacific Telecom Power Systems Industry Revenue (billion), by Power Range 2025 & 2033
- Figure 15: Asia Pacific Telecom Power Systems Industry Revenue Share (%), by Power Range 2025 & 2033
- Figure 16: Asia Pacific Telecom Power Systems Industry Revenue (billion), by End-user Application 2025 & 2033
- Figure 17: Asia Pacific Telecom Power Systems Industry Revenue Share (%), by End-user Application 2025 & 2033
- Figure 18: Asia Pacific Telecom Power Systems Industry Revenue (billion), by Country 2025 & 2033
- Figure 19: Asia Pacific Telecom Power Systems Industry Revenue Share (%), by Country 2025 & 2033
- Figure 20: Latin America Telecom Power Systems Industry Revenue (billion), by Power Range 2025 & 2033
- Figure 21: Latin America Telecom Power Systems Industry Revenue Share (%), by Power Range 2025 & 2033
- Figure 22: Latin America Telecom Power Systems Industry Revenue (billion), by End-user Application 2025 & 2033
- Figure 23: Latin America Telecom Power Systems Industry Revenue Share (%), by End-user Application 2025 & 2033
- Figure 24: Latin America Telecom Power Systems Industry Revenue (billion), by Country 2025 & 2033
- Figure 25: Latin America Telecom Power Systems Industry Revenue Share (%), by Country 2025 & 2033
- Figure 26: Middle East and Africa Telecom Power Systems Industry Revenue (billion), by Power Range 2025 & 2033
- Figure 27: Middle East and Africa Telecom Power Systems Industry Revenue Share (%), by Power Range 2025 & 2033
- Figure 28: Middle East and Africa Telecom Power Systems Industry Revenue (billion), by End-user Application 2025 & 2033
- Figure 29: Middle East and Africa Telecom Power Systems Industry Revenue Share (%), by End-user Application 2025 & 2033
- Figure 30: Middle East and Africa Telecom Power Systems Industry Revenue (billion), by Country 2025 & 2033
- Figure 31: Middle East and Africa Telecom Power Systems Industry Revenue Share (%), by Country 2025 & 2033
List of Tables
- Table 1: Global Telecom Power Systems Industry Revenue billion Forecast, by Power Range 2020 & 2033
- Table 2: Global Telecom Power Systems Industry Revenue billion Forecast, by End-user Application 2020 & 2033
- Table 3: Global Telecom Power Systems Industry Revenue billion Forecast, by Region 2020 & 2033
- Table 4: Global Telecom Power Systems Industry Revenue billion Forecast, by Power Range 2020 & 2033
- Table 5: Global Telecom Power Systems Industry Revenue billion Forecast, by End-user Application 2020 & 2033
- Table 6: Global Telecom Power Systems Industry Revenue billion Forecast, by Country 2020 & 2033
- Table 7: Global Telecom Power Systems Industry Revenue billion Forecast, by Power Range 2020 & 2033
- Table 8: Global Telecom Power Systems Industry Revenue billion Forecast, by End-user Application 2020 & 2033
- Table 9: Global Telecom Power Systems Industry Revenue billion Forecast, by Country 2020 & 2033
- Table 10: Global Telecom Power Systems Industry Revenue billion Forecast, by Power Range 2020 & 2033
- Table 11: Global Telecom Power Systems Industry Revenue billion Forecast, by End-user Application 2020 & 2033
- Table 12: Global Telecom Power Systems Industry Revenue billion Forecast, by Country 2020 & 2033
- Table 13: Global Telecom Power Systems Industry Revenue billion Forecast, by Power Range 2020 & 2033
- Table 14: Global Telecom Power Systems Industry Revenue billion Forecast, by End-user Application 2020 & 2033
- Table 15: Global Telecom Power Systems Industry Revenue billion Forecast, by Country 2020 & 2033
- Table 16: Global Telecom Power Systems Industry Revenue billion Forecast, by Power Range 2020 & 2033
- Table 17: Global Telecom Power Systems Industry Revenue billion Forecast, by End-user Application 2020 & 2033
- Table 18: Global Telecom Power Systems Industry Revenue billion Forecast, by Country 2020 & 2033
Frequently Asked Questions
1. What is the projected Compound Annual Growth Rate (CAGR) of the Telecom Power Systems Industry?
The projected CAGR is approximately 8.3%.
2. Which companies are prominent players in the Telecom Power Systems Industry?
Key companies in the market include Alpha Technologies, Delta Group, Huawei Technologies Co, ABB Group, Eltek AS, Cummins Inc, ZTE Corporation, Schneider Electric, Efore Group, Eaton Corporation.
3. What are the main segments of the Telecom Power Systems Industry?
The market segments include Power Range, End-user Application.
4. Can you provide details about the market size?
The market size is estimated to be USD 5.69 billion as of 2022.
5. What are some drivers contributing to market growth?
Increasing Need for Tower Installations; Adoption of Hybrid Power System in Telecom.
6. What are the notable trends driving market growth?
Access Application in 5G Holds the Significant Share in the Market.
7. Are there any restraints impacting market growth?
High Deployment and Operational Cost.
8. Can you provide examples of recent developments in the market?
December 2022: Telecom Egypt, Egypt's first integrated telecom operator, and Grid Telecom, a wholly-owned subsidiary of the Independent Power Transmission Operator (IPTO) in Greece, announced a collaboration agreement to build a subsea system connecting Egypt and Greece.
9. What pricing options are available for accessing the report?
Pricing options include single-user, multi-user, and enterprise licenses priced at USD 4750, USD 5250, and USD 8750 respectively.
10. Is the market size provided in terms of value or volume?
The market size is provided in terms of value, measured in billion.
11. Are there any specific market keywords associated with the report?
Yes, the market keyword associated with the report is "Telecom Power Systems Industry," which aids in identifying and referencing the specific market segment covered.
12. How do I determine which pricing option suits my needs best?
The pricing options vary based on user requirements and access needs. Individual users may opt for single-user licenses, while businesses requiring broader access may choose multi-user or enterprise licenses for cost-effective access to the report.
13. Are there any additional resources or data provided in the Telecom Power Systems Industry report?
While the report offers comprehensive insights, it's advisable to review the specific contents or supplementary materials provided to ascertain if additional resources or data are available.
14. How can I stay updated on further developments or reports in the Telecom Power Systems Industry?
To stay informed about further developments, trends, and reports in the Telecom Power Systems Industry, consider subscribing to industry newsletters, following relevant companies and organizations, or regularly checking reputable industry news sources and publications.
Methodology
Step 1 - Identification of Relevant Samples Size from Population Database


Step 2 - Approaches for Defining Global Market Size (Value, Volume* & Price*)

Note*: In applicable scenarios
Step 3 - Data Sources
Primary Research
- Web Analytics
- Survey Reports
- Research Institute
- Latest Research Reports
- Opinion Leaders
Secondary Research
- Annual Reports
- White Paper
- Latest Press Release
- Industry Association
- Paid Database
- Investor Presentations

Step 4 - Data Triangulation
Involves using different sources of information in order to increase the validity of a study
These sources are likely to be stakeholders in a program - participants, other researchers, program staff, other community members, and so on.
Then we put all data in single framework & apply various statistical tools to find out the dynamic on the market.
During the analysis stage, feedback from the stakeholder groups would be compared to determine areas of agreement as well as areas of divergence