
Key Insights
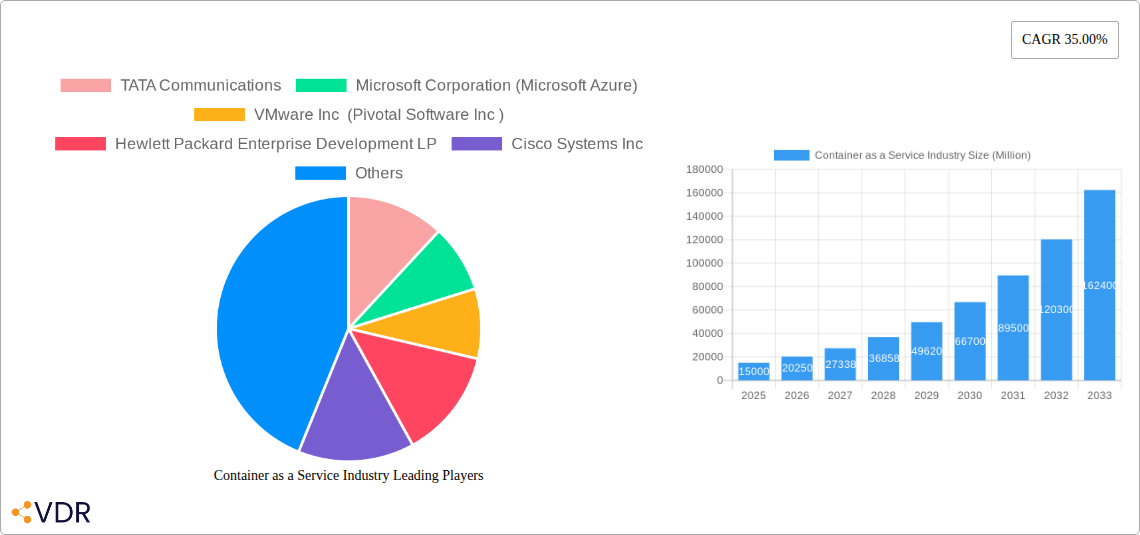
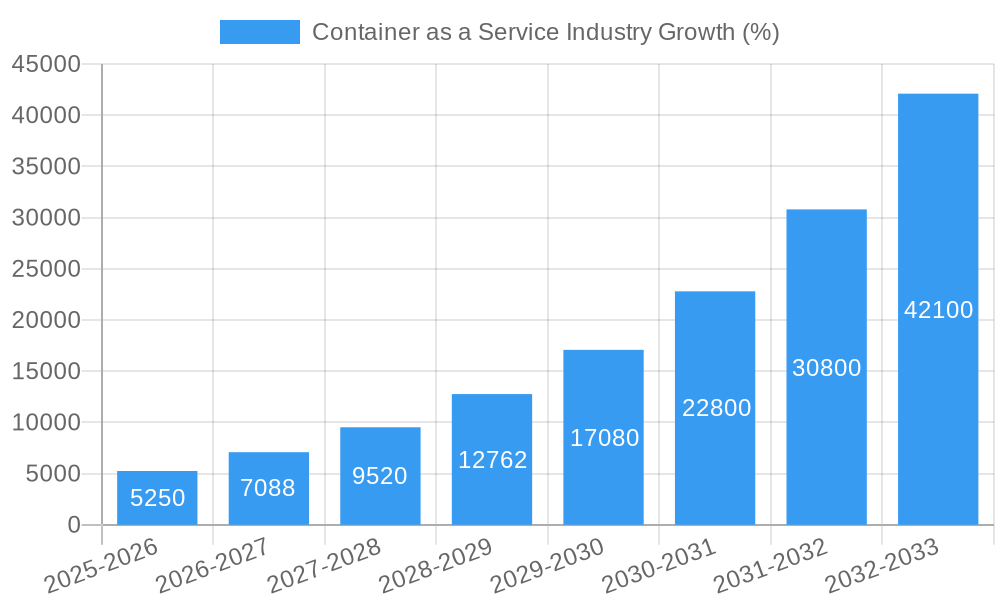
The Container-as-a-Service (CaaS) market is experiencing explosive growth, fueled by the increasing adoption of cloud-native applications and microservices architectures. The market's 35% CAGR indicates a significant and sustained upward trajectory. Key drivers include the need for improved application portability, scalability, and cost efficiency. Organizations are increasingly migrating to cloud environments, and CaaS provides a crucial component for managing and orchestrating containerized workloads in these dynamic settings. The diverse range of deployment options (on-premise and cloud) caters to varying organizational needs and infrastructure preferences. Furthermore, the robust ecosystem of professional and managed services ensures organizations of all sizes (SMEs and large enterprises) can leverage CaaS effectively, regardless of their in-house expertise. The BFSI, retail, and IT & Telecommunications sectors are currently leading adoption, but growth is expected across all end-user applications as awareness and understanding of CaaS benefits increase. While potential restraints such as security concerns and the complexity of container orchestration exist, the market's rapid expansion suggests these challenges are being effectively addressed by vendors and the broader industry.
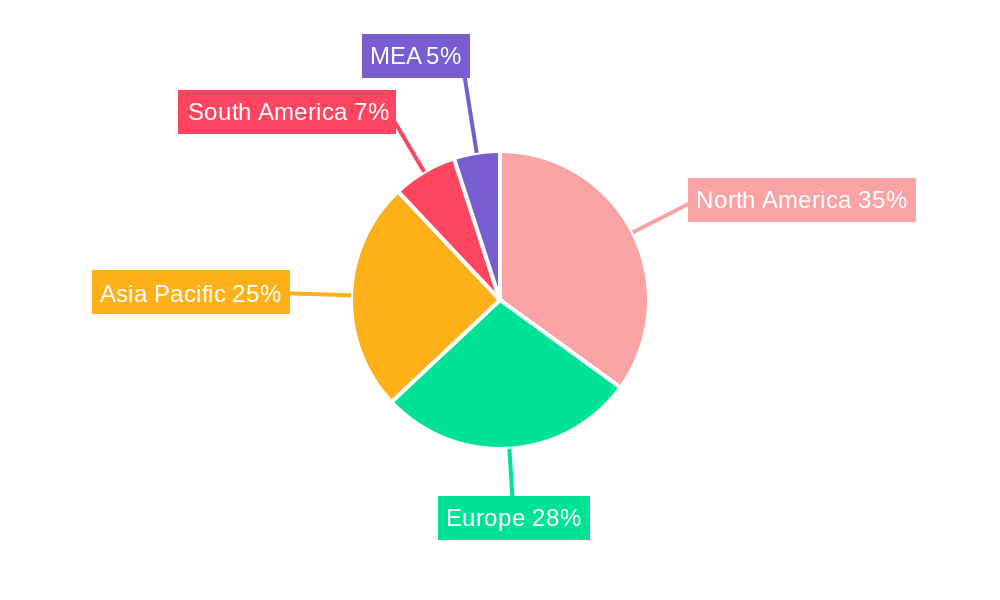
The competitive landscape is highly dynamic, with established tech giants like Microsoft, Amazon, and Google competing alongside specialized CaaS providers such as Rancher Labs and others. This competition fosters innovation and drives down costs, further accelerating market adoption. Regional analysis indicates strong growth across North America and Asia-Pacific, driven by high levels of technology adoption and substantial investments in digital transformation initiatives. However, Europe and other regions are also experiencing significant growth, indicating a global shift toward CaaS as a foundational technology for modern application development and deployment. The forecast period (2025-2033) promises continued expansion, with projected market value exceeding estimations based on the current CAGR and market penetration rates across diverse geographical regions and application sectors.
Container as a Service (CaaS) Industry Market Report: 2019-2033
This comprehensive report provides a detailed analysis of the Container as a Service (CaaS) industry, encompassing market dynamics, growth trends, competitive landscape, and future outlook. The study period covers 2019-2033, with 2025 as the base and estimated year. This report is crucial for industry professionals, investors, and strategists seeking to understand and capitalize on the opportunities within this rapidly evolving market. The CaaS market, a child market within the broader Cloud Computing parent market, is projected to reach xx Million by 2033.
Container as a Service Industry Market Dynamics & Structure
The CaaS market is characterized by a moderately concentrated landscape, with key players like Amazon Web Services, Microsoft Azure, and Google Cloud holding significant market share. However, the market exhibits substantial dynamism due to continuous technological innovation and the emergence of niche players. Market concentration is estimated at xx% in 2025, with the top 5 players accounting for xx% of the total revenue.
- Technological Innovation Drivers: Advancements in container orchestration technologies (Kubernetes), serverless computing, and improved security features are major drivers. The adoption of microservices architecture further fuels demand.
- Regulatory Frameworks: Data privacy regulations (GDPR, CCPA) and compliance requirements influence CaaS adoption strategies. Industry standards and certifications play a significant role in fostering trust and security.
- Competitive Product Substitutes: Traditional virtual machine (VM)-based infrastructure remains a competitor, although CaaS offers superior agility and scalability. Other emerging technologies, such as serverless functions, present alternative deployment models.
- End-User Demographics: Large enterprises are the primary adopters, driven by their need for scalable and efficient IT infrastructure. However, SMEs are increasingly adopting CaaS due to its cost-effectiveness and ease of use.
- M&A Trends: The industry has witnessed a significant number of mergers and acquisitions in recent years (xx deals in the past 5 years), reflecting consolidation and expansion strategies among major players. This activity is expected to continue as companies seek to enhance their product portfolios and expand market reach. Smaller specialized CaaS providers are frequently targets for acquisition by larger cloud providers.
Container as a Service Industry Growth Trends & Insights
The CaaS market has witnessed robust growth over the past few years, driven by the increasing adoption of cloud-native applications and microservices architectures. The market size expanded from xx Million in 2019 to xx Million in 2024, exhibiting a CAGR of xx%. This growth is expected to continue, with the market projected to reach xx Million by 2033, exhibiting a CAGR of xx% during the forecast period (2025-2033). Market penetration is currently at xx% in mature markets and is expected to reach xx% by 2033. Technological disruptions, like the rise of serverless computing and edge computing, are reshaping the CaaS landscape. Consumer behavior shifts toward agile and DevOps-centric development practices further fuel demand for CaaS.
Dominant Regions, Countries, or Segments in Container as a Service Industry
North America currently dominates the CaaS market, followed by Europe and Asia-Pacific. This dominance is attributed to higher cloud adoption rates, well-established IT infrastructure, and the presence of major CaaS providers.
By Deployment: The Cloud segment holds the largest market share, driven by the advantages of scalability, elasticity, and pay-as-you-go pricing models. However, the On-Premise segment retains significance for organizations with stringent security or compliance requirements.
By Service Type: Managed services accounts for a larger share due to its ease of use and reduced operational overhead for customers. Professional services play a crucial role in enabling adoption and complex deployments.
By Size of Enterprise: Large Enterprises dominate the market due to their higher IT budgets and need for advanced features. However, SMEs represent a rapidly growing segment, seeking cost-effective solutions for application modernization.
By End-User Application: The BFSI, IT & Telecommunications, and Retail sectors are leading adopters, driven by the need for agile development, scalability, and improved efficiency. Manufacturing and other sectors are gradually adopting CaaS solutions.
- Key Drivers:
- Strong cloud adoption rates in North America and Europe
- Growing demand for agile development methodologies
- Increased investment in IT infrastructure modernization
- Favorable government policies promoting digital transformation
- Dominance Factors:
- Mature IT ecosystems
- High concentration of major CaaS providers
- High spending on cloud technologies
Container as a Service Industry Product Landscape
The CaaS market offers a range of products, from basic container management platforms to sophisticated orchestration tools with advanced features like auto-scaling, security, and monitoring. Key innovations include improved container security features, enhanced orchestration capabilities, and integration with other cloud services. The focus is on increasing efficiency, scalability, and ease of management.
Key Drivers, Barriers & Challenges in Container as a Service Industry
Key Drivers:
- Increasing adoption of cloud-native applications and microservices.
- Rising demand for agility and scalability in IT infrastructure.
- Growth of DevOps and CI/CD practices.
Key Challenges and Restraints:
- Security concerns related to container vulnerabilities.
- Complexity of container orchestration and management.
- Skill gap in managing and deploying containerized applications. This represents a xx% impediment to wider market adoption.
- Integration challenges with legacy systems.
Emerging Opportunities in Container as a Service Industry
- Growing demand for edge computing and IoT applications.
- Expansion of CaaS into new industries (e.g., healthcare, education).
- Increasing adoption of serverless computing within CaaS environments.
- Development of specialized CaaS solutions for specific industry verticals.
Growth Accelerators in the Container as a Service Industry Industry
Technological breakthroughs in container orchestration, security, and management are key growth accelerators. Strategic partnerships between CaaS providers and other technology vendors are creating a more robust ecosystem. Market expansion into new geographical regions and industry sectors further fuels growth.
Key Players Shaping the Container as a Service Industry Market
- TATA Communications
- Microsoft Corporation (Microsoft Azure)
- VMware Inc (Pivotal Software Inc)
- Hewlett Packard Enterprise Development LP
- Cisco Systems Inc
- Rancher Labs
- IBM Corporation (Red Hat Inc)
- Amazon Web Services Inc
- Google LLC (Google Cloud)
- Oracle Corporation
- SUSE
- Rackspace Inc
Notable Milestones in Container as a Service Industry Sector
- November 2022: Sylabs' Singularity container runtime suite integrated into Nimbix Federated supercomputing suite, expanding containerization into high-performance computing.
- October 2022: Nokia's container application adopted by Kinetic by Windstream, marking a significant deployment in the telecommunications sector.
In-Depth Container as a Service Industry Market Outlook
The CaaS market is poised for continued robust growth, driven by ongoing technological advancements and increasing adoption across various industries. Strategic partnerships, expansion into new markets, and the development of innovative solutions will further shape the industry landscape. The focus on enhancing security, scalability, and ease of use will remain critical for future success. The market presents significant opportunities for both established players and emerging startups, fostering a dynamic and competitive environment.
Container as a Service Industry Segmentation
-
1. Deployment
- 1.1. On-Premise
- 1.2. Cloud
-
2. Service Type
- 2.1. Professional Services
- 2.2. Managed Services
-
3. Size of the Enterprise
- 3.1. Small and Medium Enterprises
- 3.2. Large Enterprises
-
4. End-user Application
- 4.1. BFSI
- 4.2. Retail
- 4.3. IT & Telecommunications
- 4.4. Manufacturing
- 4.5. Other End-user Applications
Container as a Service Industry Segmentation By Geography
-
1. North America
- 1.1. United States
- 1.2. Canada
-
2. Europe
- 2.1. United Kingdom
- 2.2. Germany
- 2.3. France
- 2.4. Rest of Europe
-
3. Asia Pacific
- 3.1. China
- 3.2. Australia
- 3.3. Japan
- 3.4. Rest of Asia Pacific
-
4. Latin America
- 4.1. Mexico
- 4.2. Brazil
- 4.3. Rest of Latin America
- 5. Middle East
Container as a Service Industry REPORT HIGHLIGHTS
| Aspects | Details |
|---|---|
| Study Period | 2019-2033 |
| Base Year | 2024 |
| Estimated Year | 2025 |
| Forecast Period | 2025-2033 |
| Historical Period | 2019-2024 |
| Growth Rate | CAGR of 35.00% from 2019-2033 |
| Segmentation |
|
Table of Contents
- 1. Introduction
- 1.1. Research Scope
- 1.2. Market Segmentation
- 1.3. Research Methodology
- 1.4. Definitions and Assumptions
- 2. Executive Summary
- 2.1. Introduction
- 3. Market Dynamics
- 3.1. Introduction
- 3.2. Market Drivers
- 3.2.1. Benefits of Cost Effectiveness and Increased Productivity; Greater Flexibility Than On-Premises Containers; Increasing Popularity of Microservices
- 3.3. Market Restrains
- 3.3.1. Difficulty in Achieving Security and Compliance
- 3.4. Market Trends
- 3.4.1. BFSI Sector Expected to Have Maximum Application
- 4. Market Factor Analysis
- 4.1. Porters Five Forces
- 4.2. Supply/Value Chain
- 4.3. PESTEL analysis
- 4.4. Market Entropy
- 4.5. Patent/Trademark Analysis
- 5. Global Container as a Service Industry Analysis, Insights and Forecast, 2019-2031
- 5.1. Market Analysis, Insights and Forecast - by Deployment
- 5.1.1. On-Premise
- 5.1.2. Cloud
- 5.2. Market Analysis, Insights and Forecast - by Service Type
- 5.2.1. Professional Services
- 5.2.2. Managed Services
- 5.3. Market Analysis, Insights and Forecast - by Size of the Enterprise
- 5.3.1. Small and Medium Enterprises
- 5.3.2. Large Enterprises
- 5.4. Market Analysis, Insights and Forecast - by End-user Application
- 5.4.1. BFSI
- 5.4.2. Retail
- 5.4.3. IT & Telecommunications
- 5.4.4. Manufacturing
- 5.4.5. Other End-user Applications
- 5.5. Market Analysis, Insights and Forecast - by Region
- 5.5.1. North America
- 5.5.2. Europe
- 5.5.3. Asia Pacific
- 5.5.4. Latin America
- 5.5.5. Middle East
- 5.1. Market Analysis, Insights and Forecast - by Deployment
- 6. North America Container as a Service Industry Analysis, Insights and Forecast, 2019-2031
- 6.1. Market Analysis, Insights and Forecast - by Deployment
- 6.1.1. On-Premise
- 6.1.2. Cloud
- 6.2. Market Analysis, Insights and Forecast - by Service Type
- 6.2.1. Professional Services
- 6.2.2. Managed Services
- 6.3. Market Analysis, Insights and Forecast - by Size of the Enterprise
- 6.3.1. Small and Medium Enterprises
- 6.3.2. Large Enterprises
- 6.4. Market Analysis, Insights and Forecast - by End-user Application
- 6.4.1. BFSI
- 6.4.2. Retail
- 6.4.3. IT & Telecommunications
- 6.4.4. Manufacturing
- 6.4.5. Other End-user Applications
- 6.1. Market Analysis, Insights and Forecast - by Deployment
- 7. Europe Container as a Service Industry Analysis, Insights and Forecast, 2019-2031
- 7.1. Market Analysis, Insights and Forecast - by Deployment
- 7.1.1. On-Premise
- 7.1.2. Cloud
- 7.2. Market Analysis, Insights and Forecast - by Service Type
- 7.2.1. Professional Services
- 7.2.2. Managed Services
- 7.3. Market Analysis, Insights and Forecast - by Size of the Enterprise
- 7.3.1. Small and Medium Enterprises
- 7.3.2. Large Enterprises
- 7.4. Market Analysis, Insights and Forecast - by End-user Application
- 7.4.1. BFSI
- 7.4.2. Retail
- 7.4.3. IT & Telecommunications
- 7.4.4. Manufacturing
- 7.4.5. Other End-user Applications
- 7.1. Market Analysis, Insights and Forecast - by Deployment
- 8. Asia Pacific Container as a Service Industry Analysis, Insights and Forecast, 2019-2031
- 8.1. Market Analysis, Insights and Forecast - by Deployment
- 8.1.1. On-Premise
- 8.1.2. Cloud
- 8.2. Market Analysis, Insights and Forecast - by Service Type
- 8.2.1. Professional Services
- 8.2.2. Managed Services
- 8.3. Market Analysis, Insights and Forecast - by Size of the Enterprise
- 8.3.1. Small and Medium Enterprises
- 8.3.2. Large Enterprises
- 8.4. Market Analysis, Insights and Forecast - by End-user Application
- 8.4.1. BFSI
- 8.4.2. Retail
- 8.4.3. IT & Telecommunications
- 8.4.4. Manufacturing
- 8.4.5. Other End-user Applications
- 8.1. Market Analysis, Insights and Forecast - by Deployment
- 9. Latin America Container as a Service Industry Analysis, Insights and Forecast, 2019-2031
- 9.1. Market Analysis, Insights and Forecast - by Deployment
- 9.1.1. On-Premise
- 9.1.2. Cloud
- 9.2. Market Analysis, Insights and Forecast - by Service Type
- 9.2.1. Professional Services
- 9.2.2. Managed Services
- 9.3. Market Analysis, Insights and Forecast - by Size of the Enterprise
- 9.3.1. Small and Medium Enterprises
- 9.3.2. Large Enterprises
- 9.4. Market Analysis, Insights and Forecast - by End-user Application
- 9.4.1. BFSI
- 9.4.2. Retail
- 9.4.3. IT & Telecommunications
- 9.4.4. Manufacturing
- 9.4.5. Other End-user Applications
- 9.1. Market Analysis, Insights and Forecast - by Deployment
- 10. Middle East Container as a Service Industry Analysis, Insights and Forecast, 2019-2031
- 10.1. Market Analysis, Insights and Forecast - by Deployment
- 10.1.1. On-Premise
- 10.1.2. Cloud
- 10.2. Market Analysis, Insights and Forecast - by Service Type
- 10.2.1. Professional Services
- 10.2.2. Managed Services
- 10.3. Market Analysis, Insights and Forecast - by Size of the Enterprise
- 10.3.1. Small and Medium Enterprises
- 10.3.2. Large Enterprises
- 10.4. Market Analysis, Insights and Forecast - by End-user Application
- 10.4.1. BFSI
- 10.4.2. Retail
- 10.4.3. IT & Telecommunications
- 10.4.4. Manufacturing
- 10.4.5. Other End-user Applications
- 10.1. Market Analysis, Insights and Forecast - by Deployment
- 11. North America Container as a Service Industry Analysis, Insights and Forecast, 2019-2031
- 11.1. Market Analysis, Insights and Forecast - By Country/Sub-region
- 11.1.1 United States
- 11.1.2 Canada
- 11.1.3 Mexico
- 12. Europe Container as a Service Industry Analysis, Insights and Forecast, 2019-2031
- 12.1. Market Analysis, Insights and Forecast - By Country/Sub-region
- 12.1.1 Germany
- 12.1.2 United Kingdom
- 12.1.3 France
- 12.1.4 Spain
- 12.1.5 Italy
- 12.1.6 Spain
- 12.1.7 Belgium
- 12.1.8 Netherland
- 12.1.9 Nordics
- 12.1.10 Rest of Europe
- 13. Asia Pacific Container as a Service Industry Analysis, Insights and Forecast, 2019-2031
- 13.1. Market Analysis, Insights and Forecast - By Country/Sub-region
- 13.1.1 China
- 13.1.2 Japan
- 13.1.3 India
- 13.1.4 South Korea
- 13.1.5 Southeast Asia
- 13.1.6 Australia
- 13.1.7 Indonesia
- 13.1.8 Phillipes
- 13.1.9 Singapore
- 13.1.10 Thailandc
- 13.1.11 Rest of Asia Pacific
- 14. South America Container as a Service Industry Analysis, Insights and Forecast, 2019-2031
- 14.1. Market Analysis, Insights and Forecast - By Country/Sub-region
- 14.1.1 Brazil
- 14.1.2 Argentina
- 14.1.3 Peru
- 14.1.4 Chile
- 14.1.5 Colombia
- 14.1.6 Ecuador
- 14.1.7 Venezuela
- 14.1.8 Rest of South America
- 15. North America Container as a Service Industry Analysis, Insights and Forecast, 2019-2031
- 15.1. Market Analysis, Insights and Forecast - By Country/Sub-region
- 15.1.1 United States
- 15.1.2 Canada
- 15.1.3 Mexico
- 16. MEA Container as a Service Industry Analysis, Insights and Forecast, 2019-2031
- 16.1. Market Analysis, Insights and Forecast - By Country/Sub-region
- 16.1.1 United Arab Emirates
- 16.1.2 Saudi Arabia
- 16.1.3 South Africa
- 16.1.4 Rest of Middle East and Africa
- 17. Competitive Analysis
- 17.1. Global Market Share Analysis 2024
- 17.2. Company Profiles
- 17.2.1 TATA Communications
- 17.2.1.1. Overview
- 17.2.1.2. Products
- 17.2.1.3. SWOT Analysis
- 17.2.1.4. Recent Developments
- 17.2.1.5. Financials (Based on Availability)
- 17.2.2 Microsoft Corporation (Microsoft Azure)
- 17.2.2.1. Overview
- 17.2.2.2. Products
- 17.2.2.3. SWOT Analysis
- 17.2.2.4. Recent Developments
- 17.2.2.5. Financials (Based on Availability)
- 17.2.3 VMware Inc (Pivotal Software Inc )
- 17.2.3.1. Overview
- 17.2.3.2. Products
- 17.2.3.3. SWOT Analysis
- 17.2.3.4. Recent Developments
- 17.2.3.5. Financials (Based on Availability)
- 17.2.4 Hewlett Packard Enterprise Development LP
- 17.2.4.1. Overview
- 17.2.4.2. Products
- 17.2.4.3. SWOT Analysis
- 17.2.4.4. Recent Developments
- 17.2.4.5. Financials (Based on Availability)
- 17.2.5 Cisco Systems Inc
- 17.2.5.1. Overview
- 17.2.5.2. Products
- 17.2.5.3. SWOT Analysis
- 17.2.5.4. Recent Developments
- 17.2.5.5. Financials (Based on Availability)
- 17.2.6 Rancher Labs
- 17.2.6.1. Overview
- 17.2.6.2. Products
- 17.2.6.3. SWOT Analysis
- 17.2.6.4. Recent Developments
- 17.2.6.5. Financials (Based on Availability)
- 17.2.7 IBM Corporation (Red Hat Inc )
- 17.2.7.1. Overview
- 17.2.7.2. Products
- 17.2.7.3. SWOT Analysis
- 17.2.7.4. Recent Developments
- 17.2.7.5. Financials (Based on Availability)
- 17.2.8 Amazon Web Services Inc
- 17.2.8.1. Overview
- 17.2.8.2. Products
- 17.2.8.3. SWOT Analysis
- 17.2.8.4. Recent Developments
- 17.2.8.5. Financials (Based on Availability)
- 17.2.9 Google LLC (Google Cloud)
- 17.2.9.1. Overview
- 17.2.9.2. Products
- 17.2.9.3. SWOT Analysis
- 17.2.9.4. Recent Developments
- 17.2.9.5. Financials (Based on Availability)
- 17.2.10 Oracle Corporation
- 17.2.10.1. Overview
- 17.2.10.2. Products
- 17.2.10.3. SWOT Analysis
- 17.2.10.4. Recent Developments
- 17.2.10.5. Financials (Based on Availability)
- 17.2.11 SUSE
- 17.2.11.1. Overview
- 17.2.11.2. Products
- 17.2.11.3. SWOT Analysis
- 17.2.11.4. Recent Developments
- 17.2.11.5. Financials (Based on Availability)
- 17.2.12 Rackspace Inc
- 17.2.12.1. Overview
- 17.2.12.2. Products
- 17.2.12.3. SWOT Analysis
- 17.2.12.4. Recent Developments
- 17.2.12.5. Financials (Based on Availability)
- 17.2.1 TATA Communications
List of Figures
- Figure 1: Global Container as a Service Industry Revenue Breakdown (Million, %) by Region 2024 & 2032
- Figure 2: Global Container as a Service Industry Volume Breakdown (K Unit, %) by Region 2024 & 2032
- Figure 3: North America Container as a Service Industry Revenue (Million), by Country 2024 & 2032
- Figure 4: North America Container as a Service Industry Volume (K Unit), by Country 2024 & 2032
- Figure 5: North America Container as a Service Industry Revenue Share (%), by Country 2024 & 2032
- Figure 6: North America Container as a Service Industry Volume Share (%), by Country 2024 & 2032
- Figure 7: Europe Container as a Service Industry Revenue (Million), by Country 2024 & 2032
- Figure 8: Europe Container as a Service Industry Volume (K Unit), by Country 2024 & 2032
- Figure 9: Europe Container as a Service Industry Revenue Share (%), by Country 2024 & 2032
- Figure 10: Europe Container as a Service Industry Volume Share (%), by Country 2024 & 2032
- Figure 11: Asia Pacific Container as a Service Industry Revenue (Million), by Country 2024 & 2032
- Figure 12: Asia Pacific Container as a Service Industry Volume (K Unit), by Country 2024 & 2032
- Figure 13: Asia Pacific Container as a Service Industry Revenue Share (%), by Country 2024 & 2032
- Figure 14: Asia Pacific Container as a Service Industry Volume Share (%), by Country 2024 & 2032
- Figure 15: South America Container as a Service Industry Revenue (Million), by Country 2024 & 2032
- Figure 16: South America Container as a Service Industry Volume (K Unit), by Country 2024 & 2032
- Figure 17: South America Container as a Service Industry Revenue Share (%), by Country 2024 & 2032
- Figure 18: South America Container as a Service Industry Volume Share (%), by Country 2024 & 2032
- Figure 19: North America Container as a Service Industry Revenue (Million), by Country 2024 & 2032
- Figure 20: North America Container as a Service Industry Volume (K Unit), by Country 2024 & 2032
- Figure 21: North America Container as a Service Industry Revenue Share (%), by Country 2024 & 2032
- Figure 22: North America Container as a Service Industry Volume Share (%), by Country 2024 & 2032
- Figure 23: MEA Container as a Service Industry Revenue (Million), by Country 2024 & 2032
- Figure 24: MEA Container as a Service Industry Volume (K Unit), by Country 2024 & 2032
- Figure 25: MEA Container as a Service Industry Revenue Share (%), by Country 2024 & 2032
- Figure 26: MEA Container as a Service Industry Volume Share (%), by Country 2024 & 2032
- Figure 27: North America Container as a Service Industry Revenue (Million), by Deployment 2024 & 2032
- Figure 28: North America Container as a Service Industry Volume (K Unit), by Deployment 2024 & 2032
- Figure 29: North America Container as a Service Industry Revenue Share (%), by Deployment 2024 & 2032
- Figure 30: North America Container as a Service Industry Volume Share (%), by Deployment 2024 & 2032
- Figure 31: North America Container as a Service Industry Revenue (Million), by Service Type 2024 & 2032
- Figure 32: North America Container as a Service Industry Volume (K Unit), by Service Type 2024 & 2032
- Figure 33: North America Container as a Service Industry Revenue Share (%), by Service Type 2024 & 2032
- Figure 34: North America Container as a Service Industry Volume Share (%), by Service Type 2024 & 2032
- Figure 35: North America Container as a Service Industry Revenue (Million), by Size of the Enterprise 2024 & 2032
- Figure 36: North America Container as a Service Industry Volume (K Unit), by Size of the Enterprise 2024 & 2032
- Figure 37: North America Container as a Service Industry Revenue Share (%), by Size of the Enterprise 2024 & 2032
- Figure 38: North America Container as a Service Industry Volume Share (%), by Size of the Enterprise 2024 & 2032
- Figure 39: North America Container as a Service Industry Revenue (Million), by End-user Application 2024 & 2032
- Figure 40: North America Container as a Service Industry Volume (K Unit), by End-user Application 2024 & 2032
- Figure 41: North America Container as a Service Industry Revenue Share (%), by End-user Application 2024 & 2032
- Figure 42: North America Container as a Service Industry Volume Share (%), by End-user Application 2024 & 2032
- Figure 43: North America Container as a Service Industry Revenue (Million), by Country 2024 & 2032
- Figure 44: North America Container as a Service Industry Volume (K Unit), by Country 2024 & 2032
- Figure 45: North America Container as a Service Industry Revenue Share (%), by Country 2024 & 2032
- Figure 46: North America Container as a Service Industry Volume Share (%), by Country 2024 & 2032
- Figure 47: Europe Container as a Service Industry Revenue (Million), by Deployment 2024 & 2032
- Figure 48: Europe Container as a Service Industry Volume (K Unit), by Deployment 2024 & 2032
- Figure 49: Europe Container as a Service Industry Revenue Share (%), by Deployment 2024 & 2032
- Figure 50: Europe Container as a Service Industry Volume Share (%), by Deployment 2024 & 2032
- Figure 51: Europe Container as a Service Industry Revenue (Million), by Service Type 2024 & 2032
- Figure 52: Europe Container as a Service Industry Volume (K Unit), by Service Type 2024 & 2032
- Figure 53: Europe Container as a Service Industry Revenue Share (%), by Service Type 2024 & 2032
- Figure 54: Europe Container as a Service Industry Volume Share (%), by Service Type 2024 & 2032
- Figure 55: Europe Container as a Service Industry Revenue (Million), by Size of the Enterprise 2024 & 2032
- Figure 56: Europe Container as a Service Industry Volume (K Unit), by Size of the Enterprise 2024 & 2032
- Figure 57: Europe Container as a Service Industry Revenue Share (%), by Size of the Enterprise 2024 & 2032
- Figure 58: Europe Container as a Service Industry Volume Share (%), by Size of the Enterprise 2024 & 2032
- Figure 59: Europe Container as a Service Industry Revenue (Million), by End-user Application 2024 & 2032
- Figure 60: Europe Container as a Service Industry Volume (K Unit), by End-user Application 2024 & 2032
- Figure 61: Europe Container as a Service Industry Revenue Share (%), by End-user Application 2024 & 2032
- Figure 62: Europe Container as a Service Industry Volume Share (%), by End-user Application 2024 & 2032
- Figure 63: Europe Container as a Service Industry Revenue (Million), by Country 2024 & 2032
- Figure 64: Europe Container as a Service Industry Volume (K Unit), by Country 2024 & 2032
- Figure 65: Europe Container as a Service Industry Revenue Share (%), by Country 2024 & 2032
- Figure 66: Europe Container as a Service Industry Volume Share (%), by Country 2024 & 2032
- Figure 67: Asia Pacific Container as a Service Industry Revenue (Million), by Deployment 2024 & 2032
- Figure 68: Asia Pacific Container as a Service Industry Volume (K Unit), by Deployment 2024 & 2032
- Figure 69: Asia Pacific Container as a Service Industry Revenue Share (%), by Deployment 2024 & 2032
- Figure 70: Asia Pacific Container as a Service Industry Volume Share (%), by Deployment 2024 & 2032
- Figure 71: Asia Pacific Container as a Service Industry Revenue (Million), by Service Type 2024 & 2032
- Figure 72: Asia Pacific Container as a Service Industry Volume (K Unit), by Service Type 2024 & 2032
- Figure 73: Asia Pacific Container as a Service Industry Revenue Share (%), by Service Type 2024 & 2032
- Figure 74: Asia Pacific Container as a Service Industry Volume Share (%), by Service Type 2024 & 2032
- Figure 75: Asia Pacific Container as a Service Industry Revenue (Million), by Size of the Enterprise 2024 & 2032
- Figure 76: Asia Pacific Container as a Service Industry Volume (K Unit), by Size of the Enterprise 2024 & 2032
- Figure 77: Asia Pacific Container as a Service Industry Revenue Share (%), by Size of the Enterprise 2024 & 2032
- Figure 78: Asia Pacific Container as a Service Industry Volume Share (%), by Size of the Enterprise 2024 & 2032
- Figure 79: Asia Pacific Container as a Service Industry Revenue (Million), by End-user Application 2024 & 2032
- Figure 80: Asia Pacific Container as a Service Industry Volume (K Unit), by End-user Application 2024 & 2032
- Figure 81: Asia Pacific Container as a Service Industry Revenue Share (%), by End-user Application 2024 & 2032
- Figure 82: Asia Pacific Container as a Service Industry Volume Share (%), by End-user Application 2024 & 2032
- Figure 83: Asia Pacific Container as a Service Industry Revenue (Million), by Country 2024 & 2032
- Figure 84: Asia Pacific Container as a Service Industry Volume (K Unit), by Country 2024 & 2032
- Figure 85: Asia Pacific Container as a Service Industry Revenue Share (%), by Country 2024 & 2032
- Figure 86: Asia Pacific Container as a Service Industry Volume Share (%), by Country 2024 & 2032
- Figure 87: Latin America Container as a Service Industry Revenue (Million), by Deployment 2024 & 2032
- Figure 88: Latin America Container as a Service Industry Volume (K Unit), by Deployment 2024 & 2032
- Figure 89: Latin America Container as a Service Industry Revenue Share (%), by Deployment 2024 & 2032
- Figure 90: Latin America Container as a Service Industry Volume Share (%), by Deployment 2024 & 2032
- Figure 91: Latin America Container as a Service Industry Revenue (Million), by Service Type 2024 & 2032
- Figure 92: Latin America Container as a Service Industry Volume (K Unit), by Service Type 2024 & 2032
- Figure 93: Latin America Container as a Service Industry Revenue Share (%), by Service Type 2024 & 2032
- Figure 94: Latin America Container as a Service Industry Volume Share (%), by Service Type 2024 & 2032
- Figure 95: Latin America Container as a Service Industry Revenue (Million), by Size of the Enterprise 2024 & 2032
- Figure 96: Latin America Container as a Service Industry Volume (K Unit), by Size of the Enterprise 2024 & 2032
- Figure 97: Latin America Container as a Service Industry Revenue Share (%), by Size of the Enterprise 2024 & 2032
- Figure 98: Latin America Container as a Service Industry Volume Share (%), by Size of the Enterprise 2024 & 2032
- Figure 99: Latin America Container as a Service Industry Revenue (Million), by End-user Application 2024 & 2032
- Figure 100: Latin America Container as a Service Industry Volume (K Unit), by End-user Application 2024 & 2032
- Figure 101: Latin America Container as a Service Industry Revenue Share (%), by End-user Application 2024 & 2032
- Figure 102: Latin America Container as a Service Industry Volume Share (%), by End-user Application 2024 & 2032
- Figure 103: Latin America Container as a Service Industry Revenue (Million), by Country 2024 & 2032
- Figure 104: Latin America Container as a Service Industry Volume (K Unit), by Country 2024 & 2032
- Figure 105: Latin America Container as a Service Industry Revenue Share (%), by Country 2024 & 2032
- Figure 106: Latin America Container as a Service Industry Volume Share (%), by Country 2024 & 2032
- Figure 107: Middle East Container as a Service Industry Revenue (Million), by Deployment 2024 & 2032
- Figure 108: Middle East Container as a Service Industry Volume (K Unit), by Deployment 2024 & 2032
- Figure 109: Middle East Container as a Service Industry Revenue Share (%), by Deployment 2024 & 2032
- Figure 110: Middle East Container as a Service Industry Volume Share (%), by Deployment 2024 & 2032
- Figure 111: Middle East Container as a Service Industry Revenue (Million), by Service Type 2024 & 2032
- Figure 112: Middle East Container as a Service Industry Volume (K Unit), by Service Type 2024 & 2032
- Figure 113: Middle East Container as a Service Industry Revenue Share (%), by Service Type 2024 & 2032
- Figure 114: Middle East Container as a Service Industry Volume Share (%), by Service Type 2024 & 2032
- Figure 115: Middle East Container as a Service Industry Revenue (Million), by Size of the Enterprise 2024 & 2032
- Figure 116: Middle East Container as a Service Industry Volume (K Unit), by Size of the Enterprise 2024 & 2032
- Figure 117: Middle East Container as a Service Industry Revenue Share (%), by Size of the Enterprise 2024 & 2032
- Figure 118: Middle East Container as a Service Industry Volume Share (%), by Size of the Enterprise 2024 & 2032
- Figure 119: Middle East Container as a Service Industry Revenue (Million), by End-user Application 2024 & 2032
- Figure 120: Middle East Container as a Service Industry Volume (K Unit), by End-user Application 2024 & 2032
- Figure 121: Middle East Container as a Service Industry Revenue Share (%), by End-user Application 2024 & 2032
- Figure 122: Middle East Container as a Service Industry Volume Share (%), by End-user Application 2024 & 2032
- Figure 123: Middle East Container as a Service Industry Revenue (Million), by Country 2024 & 2032
- Figure 124: Middle East Container as a Service Industry Volume (K Unit), by Country 2024 & 2032
- Figure 125: Middle East Container as a Service Industry Revenue Share (%), by Country 2024 & 2032
- Figure 126: Middle East Container as a Service Industry Volume Share (%), by Country 2024 & 2032
List of Tables
- Table 1: Global Container as a Service Industry Revenue Million Forecast, by Region 2019 & 2032
- Table 2: Global Container as a Service Industry Volume K Unit Forecast, by Region 2019 & 2032
- Table 3: Global Container as a Service Industry Revenue Million Forecast, by Deployment 2019 & 2032
- Table 4: Global Container as a Service Industry Volume K Unit Forecast, by Deployment 2019 & 2032
- Table 5: Global Container as a Service Industry Revenue Million Forecast, by Service Type 2019 & 2032
- Table 6: Global Container as a Service Industry Volume K Unit Forecast, by Service Type 2019 & 2032
- Table 7: Global Container as a Service Industry Revenue Million Forecast, by Size of the Enterprise 2019 & 2032
- Table 8: Global Container as a Service Industry Volume K Unit Forecast, by Size of the Enterprise 2019 & 2032
- Table 9: Global Container as a Service Industry Revenue Million Forecast, by End-user Application 2019 & 2032
- Table 10: Global Container as a Service Industry Volume K Unit Forecast, by End-user Application 2019 & 2032
- Table 11: Global Container as a Service Industry Revenue Million Forecast, by Region 2019 & 2032
- Table 12: Global Container as a Service Industry Volume K Unit Forecast, by Region 2019 & 2032
- Table 13: Global Container as a Service Industry Revenue Million Forecast, by Country 2019 & 2032
- Table 14: Global Container as a Service Industry Volume K Unit Forecast, by Country 2019 & 2032
- Table 15: United States Container as a Service Industry Revenue (Million) Forecast, by Application 2019 & 2032
- Table 16: United States Container as a Service Industry Volume (K Unit) Forecast, by Application 2019 & 2032
- Table 17: Canada Container as a Service Industry Revenue (Million) Forecast, by Application 2019 & 2032
- Table 18: Canada Container as a Service Industry Volume (K Unit) Forecast, by Application 2019 & 2032
- Table 19: Mexico Container as a Service Industry Revenue (Million) Forecast, by Application 2019 & 2032
- Table 20: Mexico Container as a Service Industry Volume (K Unit) Forecast, by Application 2019 & 2032
- Table 21: Global Container as a Service Industry Revenue Million Forecast, by Country 2019 & 2032
- Table 22: Global Container as a Service Industry Volume K Unit Forecast, by Country 2019 & 2032
- Table 23: Germany Container as a Service Industry Revenue (Million) Forecast, by Application 2019 & 2032
- Table 24: Germany Container as a Service Industry Volume (K Unit) Forecast, by Application 2019 & 2032
- Table 25: United Kingdom Container as a Service Industry Revenue (Million) Forecast, by Application 2019 & 2032
- Table 26: United Kingdom Container as a Service Industry Volume (K Unit) Forecast, by Application 2019 & 2032
- Table 27: France Container as a Service Industry Revenue (Million) Forecast, by Application 2019 & 2032
- Table 28: France Container as a Service Industry Volume (K Unit) Forecast, by Application 2019 & 2032
- Table 29: Spain Container as a Service Industry Revenue (Million) Forecast, by Application 2019 & 2032
- Table 30: Spain Container as a Service Industry Volume (K Unit) Forecast, by Application 2019 & 2032
- Table 31: Italy Container as a Service Industry Revenue (Million) Forecast, by Application 2019 & 2032
- Table 32: Italy Container as a Service Industry Volume (K Unit) Forecast, by Application 2019 & 2032
- Table 33: Spain Container as a Service Industry Revenue (Million) Forecast, by Application 2019 & 2032
- Table 34: Spain Container as a Service Industry Volume (K Unit) Forecast, by Application 2019 & 2032
- Table 35: Belgium Container as a Service Industry Revenue (Million) Forecast, by Application 2019 & 2032
- Table 36: Belgium Container as a Service Industry Volume (K Unit) Forecast, by Application 2019 & 2032
- Table 37: Netherland Container as a Service Industry Revenue (Million) Forecast, by Application 2019 & 2032
- Table 38: Netherland Container as a Service Industry Volume (K Unit) Forecast, by Application 2019 & 2032
- Table 39: Nordics Container as a Service Industry Revenue (Million) Forecast, by Application 2019 & 2032
- Table 40: Nordics Container as a Service Industry Volume (K Unit) Forecast, by Application 2019 & 2032
- Table 41: Rest of Europe Container as a Service Industry Revenue (Million) Forecast, by Application 2019 & 2032
- Table 42: Rest of Europe Container as a Service Industry Volume (K Unit) Forecast, by Application 2019 & 2032
- Table 43: Global Container as a Service Industry Revenue Million Forecast, by Country 2019 & 2032
- Table 44: Global Container as a Service Industry Volume K Unit Forecast, by Country 2019 & 2032
- Table 45: China Container as a Service Industry Revenue (Million) Forecast, by Application 2019 & 2032
- Table 46: China Container as a Service Industry Volume (K Unit) Forecast, by Application 2019 & 2032
- Table 47: Japan Container as a Service Industry Revenue (Million) Forecast, by Application 2019 & 2032
- Table 48: Japan Container as a Service Industry Volume (K Unit) Forecast, by Application 2019 & 2032
- Table 49: India Container as a Service Industry Revenue (Million) Forecast, by Application 2019 & 2032
- Table 50: India Container as a Service Industry Volume (K Unit) Forecast, by Application 2019 & 2032
- Table 51: South Korea Container as a Service Industry Revenue (Million) Forecast, by Application 2019 & 2032
- Table 52: South Korea Container as a Service Industry Volume (K Unit) Forecast, by Application 2019 & 2032
- Table 53: Southeast Asia Container as a Service Industry Revenue (Million) Forecast, by Application 2019 & 2032
- Table 54: Southeast Asia Container as a Service Industry Volume (K Unit) Forecast, by Application 2019 & 2032
- Table 55: Australia Container as a Service Industry Revenue (Million) Forecast, by Application 2019 & 2032
- Table 56: Australia Container as a Service Industry Volume (K Unit) Forecast, by Application 2019 & 2032
- Table 57: Indonesia Container as a Service Industry Revenue (Million) Forecast, by Application 2019 & 2032
- Table 58: Indonesia Container as a Service Industry Volume (K Unit) Forecast, by Application 2019 & 2032
- Table 59: Phillipes Container as a Service Industry Revenue (Million) Forecast, by Application 2019 & 2032
- Table 60: Phillipes Container as a Service Industry Volume (K Unit) Forecast, by Application 2019 & 2032
- Table 61: Singapore Container as a Service Industry Revenue (Million) Forecast, by Application 2019 & 2032
- Table 62: Singapore Container as a Service Industry Volume (K Unit) Forecast, by Application 2019 & 2032
- Table 63: Thailandc Container as a Service Industry Revenue (Million) Forecast, by Application 2019 & 2032
- Table 64: Thailandc Container as a Service Industry Volume (K Unit) Forecast, by Application 2019 & 2032
- Table 65: Rest of Asia Pacific Container as a Service Industry Revenue (Million) Forecast, by Application 2019 & 2032
- Table 66: Rest of Asia Pacific Container as a Service Industry Volume (K Unit) Forecast, by Application 2019 & 2032
- Table 67: Global Container as a Service Industry Revenue Million Forecast, by Country 2019 & 2032
- Table 68: Global Container as a Service Industry Volume K Unit Forecast, by Country 2019 & 2032
- Table 69: Brazil Container as a Service Industry Revenue (Million) Forecast, by Application 2019 & 2032
- Table 70: Brazil Container as a Service Industry Volume (K Unit) Forecast, by Application 2019 & 2032
- Table 71: Argentina Container as a Service Industry Revenue (Million) Forecast, by Application 2019 & 2032
- Table 72: Argentina Container as a Service Industry Volume (K Unit) Forecast, by Application 2019 & 2032
- Table 73: Peru Container as a Service Industry Revenue (Million) Forecast, by Application 2019 & 2032
- Table 74: Peru Container as a Service Industry Volume (K Unit) Forecast, by Application 2019 & 2032
- Table 75: Chile Container as a Service Industry Revenue (Million) Forecast, by Application 2019 & 2032
- Table 76: Chile Container as a Service Industry Volume (K Unit) Forecast, by Application 2019 & 2032
- Table 77: Colombia Container as a Service Industry Revenue (Million) Forecast, by Application 2019 & 2032
- Table 78: Colombia Container as a Service Industry Volume (K Unit) Forecast, by Application 2019 & 2032
- Table 79: Ecuador Container as a Service Industry Revenue (Million) Forecast, by Application 2019 & 2032
- Table 80: Ecuador Container as a Service Industry Volume (K Unit) Forecast, by Application 2019 & 2032
- Table 81: Venezuela Container as a Service Industry Revenue (Million) Forecast, by Application 2019 & 2032
- Table 82: Venezuela Container as a Service Industry Volume (K Unit) Forecast, by Application 2019 & 2032
- Table 83: Rest of South America Container as a Service Industry Revenue (Million) Forecast, by Application 2019 & 2032
- Table 84: Rest of South America Container as a Service Industry Volume (K Unit) Forecast, by Application 2019 & 2032
- Table 85: Global Container as a Service Industry Revenue Million Forecast, by Country 2019 & 2032
- Table 86: Global Container as a Service Industry Volume K Unit Forecast, by Country 2019 & 2032
- Table 87: United States Container as a Service Industry Revenue (Million) Forecast, by Application 2019 & 2032
- Table 88: United States Container as a Service Industry Volume (K Unit) Forecast, by Application 2019 & 2032
- Table 89: Canada Container as a Service Industry Revenue (Million) Forecast, by Application 2019 & 2032
- Table 90: Canada Container as a Service Industry Volume (K Unit) Forecast, by Application 2019 & 2032
- Table 91: Mexico Container as a Service Industry Revenue (Million) Forecast, by Application 2019 & 2032
- Table 92: Mexico Container as a Service Industry Volume (K Unit) Forecast, by Application 2019 & 2032
- Table 93: Global Container as a Service Industry Revenue Million Forecast, by Country 2019 & 2032
- Table 94: Global Container as a Service Industry Volume K Unit Forecast, by Country 2019 & 2032
- Table 95: United Arab Emirates Container as a Service Industry Revenue (Million) Forecast, by Application 2019 & 2032
- Table 96: United Arab Emirates Container as a Service Industry Volume (K Unit) Forecast, by Application 2019 & 2032
- Table 97: Saudi Arabia Container as a Service Industry Revenue (Million) Forecast, by Application 2019 & 2032
- Table 98: Saudi Arabia Container as a Service Industry Volume (K Unit) Forecast, by Application 2019 & 2032
- Table 99: South Africa Container as a Service Industry Revenue (Million) Forecast, by Application 2019 & 2032
- Table 100: South Africa Container as a Service Industry Volume (K Unit) Forecast, by Application 2019 & 2032
- Table 101: Rest of Middle East and Africa Container as a Service Industry Revenue (Million) Forecast, by Application 2019 & 2032
- Table 102: Rest of Middle East and Africa Container as a Service Industry Volume (K Unit) Forecast, by Application 2019 & 2032
- Table 103: Global Container as a Service Industry Revenue Million Forecast, by Deployment 2019 & 2032
- Table 104: Global Container as a Service Industry Volume K Unit Forecast, by Deployment 2019 & 2032
- Table 105: Global Container as a Service Industry Revenue Million Forecast, by Service Type 2019 & 2032
- Table 106: Global Container as a Service Industry Volume K Unit Forecast, by Service Type 2019 & 2032
- Table 107: Global Container as a Service Industry Revenue Million Forecast, by Size of the Enterprise 2019 & 2032
- Table 108: Global Container as a Service Industry Volume K Unit Forecast, by Size of the Enterprise 2019 & 2032
- Table 109: Global Container as a Service Industry Revenue Million Forecast, by End-user Application 2019 & 2032
- Table 110: Global Container as a Service Industry Volume K Unit Forecast, by End-user Application 2019 & 2032
- Table 111: Global Container as a Service Industry Revenue Million Forecast, by Country 2019 & 2032
- Table 112: Global Container as a Service Industry Volume K Unit Forecast, by Country 2019 & 2032
- Table 113: United States Container as a Service Industry Revenue (Million) Forecast, by Application 2019 & 2032
- Table 114: United States Container as a Service Industry Volume (K Unit) Forecast, by Application 2019 & 2032
- Table 115: Canada Container as a Service Industry Revenue (Million) Forecast, by Application 2019 & 2032
- Table 116: Canada Container as a Service Industry Volume (K Unit) Forecast, by Application 2019 & 2032
- Table 117: Global Container as a Service Industry Revenue Million Forecast, by Deployment 2019 & 2032
- Table 118: Global Container as a Service Industry Volume K Unit Forecast, by Deployment 2019 & 2032
- Table 119: Global Container as a Service Industry Revenue Million Forecast, by Service Type 2019 & 2032
- Table 120: Global Container as a Service Industry Volume K Unit Forecast, by Service Type 2019 & 2032
- Table 121: Global Container as a Service Industry Revenue Million Forecast, by Size of the Enterprise 2019 & 2032
- Table 122: Global Container as a Service Industry Volume K Unit Forecast, by Size of the Enterprise 2019 & 2032
- Table 123: Global Container as a Service Industry Revenue Million Forecast, by End-user Application 2019 & 2032
- Table 124: Global Container as a Service Industry Volume K Unit Forecast, by End-user Application 2019 & 2032
- Table 125: Global Container as a Service Industry Revenue Million Forecast, by Country 2019 & 2032
- Table 126: Global Container as a Service Industry Volume K Unit Forecast, by Country 2019 & 2032
- Table 127: United Kingdom Container as a Service Industry Revenue (Million) Forecast, by Application 2019 & 2032
- Table 128: United Kingdom Container as a Service Industry Volume (K Unit) Forecast, by Application 2019 & 2032
- Table 129: Germany Container as a Service Industry Revenue (Million) Forecast, by Application 2019 & 2032
- Table 130: Germany Container as a Service Industry Volume (K Unit) Forecast, by Application 2019 & 2032
- Table 131: France Container as a Service Industry Revenue (Million) Forecast, by Application 2019 & 2032
- Table 132: France Container as a Service Industry Volume (K Unit) Forecast, by Application 2019 & 2032
- Table 133: Rest of Europe Container as a Service Industry Revenue (Million) Forecast, by Application 2019 & 2032
- Table 134: Rest of Europe Container as a Service Industry Volume (K Unit) Forecast, by Application 2019 & 2032
- Table 135: Global Container as a Service Industry Revenue Million Forecast, by Deployment 2019 & 2032
- Table 136: Global Container as a Service Industry Volume K Unit Forecast, by Deployment 2019 & 2032
- Table 137: Global Container as a Service Industry Revenue Million Forecast, by Service Type 2019 & 2032
- Table 138: Global Container as a Service Industry Volume K Unit Forecast, by Service Type 2019 & 2032
- Table 139: Global Container as a Service Industry Revenue Million Forecast, by Size of the Enterprise 2019 & 2032
- Table 140: Global Container as a Service Industry Volume K Unit Forecast, by Size of the Enterprise 2019 & 2032
- Table 141: Global Container as a Service Industry Revenue Million Forecast, by End-user Application 2019 & 2032
- Table 142: Global Container as a Service Industry Volume K Unit Forecast, by End-user Application 2019 & 2032
- Table 143: Global Container as a Service Industry Revenue Million Forecast, by Country 2019 & 2032
- Table 144: Global Container as a Service Industry Volume K Unit Forecast, by Country 2019 & 2032
- Table 145: China Container as a Service Industry Revenue (Million) Forecast, by Application 2019 & 2032
- Table 146: China Container as a Service Industry Volume (K Unit) Forecast, by Application 2019 & 2032
- Table 147: Australia Container as a Service Industry Revenue (Million) Forecast, by Application 2019 & 2032
- Table 148: Australia Container as a Service Industry Volume (K Unit) Forecast, by Application 2019 & 2032
- Table 149: Japan Container as a Service Industry Revenue (Million) Forecast, by Application 2019 & 2032
- Table 150: Japan Container as a Service Industry Volume (K Unit) Forecast, by Application 2019 & 2032
- Table 151: Rest of Asia Pacific Container as a Service Industry Revenue (Million) Forecast, by Application 2019 & 2032
- Table 152: Rest of Asia Pacific Container as a Service Industry Volume (K Unit) Forecast, by Application 2019 & 2032
- Table 153: Global Container as a Service Industry Revenue Million Forecast, by Deployment 2019 & 2032
- Table 154: Global Container as a Service Industry Volume K Unit Forecast, by Deployment 2019 & 2032
- Table 155: Global Container as a Service Industry Revenue Million Forecast, by Service Type 2019 & 2032
- Table 156: Global Container as a Service Industry Volume K Unit Forecast, by Service Type 2019 & 2032
- Table 157: Global Container as a Service Industry Revenue Million Forecast, by Size of the Enterprise 2019 & 2032
- Table 158: Global Container as a Service Industry Volume K Unit Forecast, by Size of the Enterprise 2019 & 2032
- Table 159: Global Container as a Service Industry Revenue Million Forecast, by End-user Application 2019 & 2032
- Table 160: Global Container as a Service Industry Volume K Unit Forecast, by End-user Application 2019 & 2032
- Table 161: Global Container as a Service Industry Revenue Million Forecast, by Country 2019 & 2032
- Table 162: Global Container as a Service Industry Volume K Unit Forecast, by Country 2019 & 2032
- Table 163: Mexico Container as a Service Industry Revenue (Million) Forecast, by Application 2019 & 2032
- Table 164: Mexico Container as a Service Industry Volume (K Unit) Forecast, by Application 2019 & 2032
- Table 165: Brazil Container as a Service Industry Revenue (Million) Forecast, by Application 2019 & 2032
- Table 166: Brazil Container as a Service Industry Volume (K Unit) Forecast, by Application 2019 & 2032
- Table 167: Rest of Latin America Container as a Service Industry Revenue (Million) Forecast, by Application 2019 & 2032
- Table 168: Rest of Latin America Container as a Service Industry Volume (K Unit) Forecast, by Application 2019 & 2032
- Table 169: Global Container as a Service Industry Revenue Million Forecast, by Deployment 2019 & 2032
- Table 170: Global Container as a Service Industry Volume K Unit Forecast, by Deployment 2019 & 2032
- Table 171: Global Container as a Service Industry Revenue Million Forecast, by Service Type 2019 & 2032
- Table 172: Global Container as a Service Industry Volume K Unit Forecast, by Service Type 2019 & 2032
- Table 173: Global Container as a Service Industry Revenue Million Forecast, by Size of the Enterprise 2019 & 2032
- Table 174: Global Container as a Service Industry Volume K Unit Forecast, by Size of the Enterprise 2019 & 2032
- Table 175: Global Container as a Service Industry Revenue Million Forecast, by End-user Application 2019 & 2032
- Table 176: Global Container as a Service Industry Volume K Unit Forecast, by End-user Application 2019 & 2032
- Table 177: Global Container as a Service Industry Revenue Million Forecast, by Country 2019 & 2032
- Table 178: Global Container as a Service Industry Volume K Unit Forecast, by Country 2019 & 2032
Frequently Asked Questions
1. What is the projected Compound Annual Growth Rate (CAGR) of the Container as a Service Industry?
The projected CAGR is approximately 35.00%.
2. Which companies are prominent players in the Container as a Service Industry?
Key companies in the market include TATA Communications, Microsoft Corporation (Microsoft Azure), VMware Inc (Pivotal Software Inc ), Hewlett Packard Enterprise Development LP, Cisco Systems Inc, Rancher Labs, IBM Corporation (Red Hat Inc ), Amazon Web Services Inc, Google LLC (Google Cloud), Oracle Corporation, SUSE, Rackspace Inc.
3. What are the main segments of the Container as a Service Industry?
The market segments include Deployment, Service Type, Size of the Enterprise, End-user Application.
4. Can you provide details about the market size?
The market size is estimated to be USD XX Million as of 2022.
5. What are some drivers contributing to market growth?
Benefits of Cost Effectiveness and Increased Productivity; Greater Flexibility Than On-Premises Containers; Increasing Popularity of Microservices.
6. What are the notable trends driving market growth?
BFSI Sector Expected to Have Maximum Application.
7. Are there any restraints impacting market growth?
Difficulty in Achieving Security and Compliance.
8. Can you provide examples of recent developments in the market?
November 2022: Sylabs, a provider of container technology and services for performance-intensive workloads, declared that the Singularity container runtime suite, including SingularityCE and SingularityPRO, is being supported in the Nimbix Federated supercomputing suite, a set of flexible and secure high-performance computing (HPC) solutions that mainly deliver customers with added agility for their compute-intensive workloads. Users of the Nimbix Supercomputing Suite would be able to use the Singularity containerization features. This would give containerization a wide range of uses, allow for more consumption models, and help research institutes and high-performance computing (HPC) centers make more money from their spare cluster capacity.
9. What pricing options are available for accessing the report?
Pricing options include single-user, multi-user, and enterprise licenses priced at USD 4750, USD 5250, and USD 8750 respectively.
10. Is the market size provided in terms of value or volume?
The market size is provided in terms of value, measured in Million and volume, measured in K Unit.
11. Are there any specific market keywords associated with the report?
Yes, the market keyword associated with the report is "Container as a Service Industry," which aids in identifying and referencing the specific market segment covered.
12. How do I determine which pricing option suits my needs best?
The pricing options vary based on user requirements and access needs. Individual users may opt for single-user licenses, while businesses requiring broader access may choose multi-user or enterprise licenses for cost-effective access to the report.
13. Are there any additional resources or data provided in the Container as a Service Industry report?
While the report offers comprehensive insights, it's advisable to review the specific contents or supplementary materials provided to ascertain if additional resources or data are available.
14. How can I stay updated on further developments or reports in the Container as a Service Industry?
To stay informed about further developments, trends, and reports in the Container as a Service Industry, consider subscribing to industry newsletters, following relevant companies and organizations, or regularly checking reputable industry news sources and publications.
Methodology
Step 1 - Identification of Relevant Samples Size from Population Database


Step 2 - Approaches for Defining Global Market Size (Value, Volume* & Price*)

Note*: In applicable scenarios
Step 3 - Data Sources
Primary Research
- Web Analytics
- Survey Reports
- Research Institute
- Latest Research Reports
- Opinion Leaders
Secondary Research
- Annual Reports
- White Paper
- Latest Press Release
- Industry Association
- Paid Database
- Investor Presentations

Step 4 - Data Triangulation
Involves using different sources of information in order to increase the validity of a study
These sources are likely to be stakeholders in a program - participants, other researchers, program staff, other community members, and so on.
Then we put all data in single framework & apply various statistical tools to find out the dynamic on the market.
During the analysis stage, feedback from the stakeholder groups would be compared to determine areas of agreement as well as areas of divergence


