
Key Insights
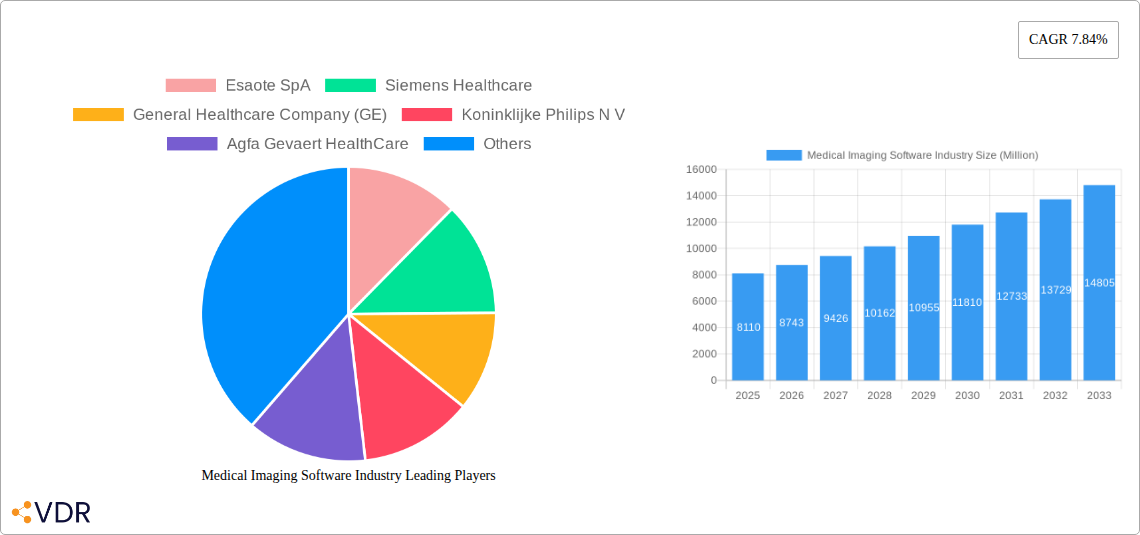
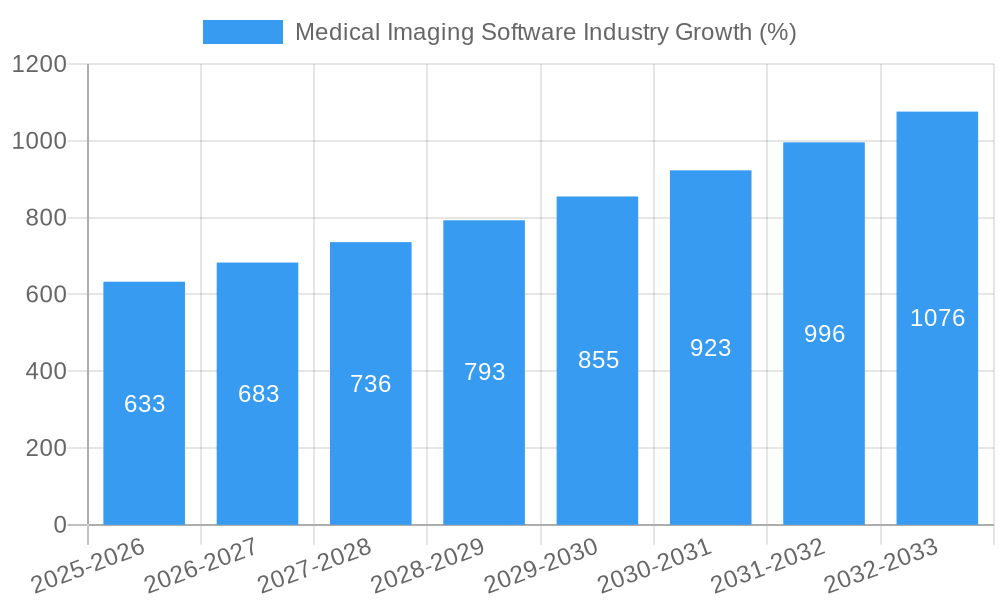
The Medical Imaging Software market, valued at $8.11 billion in 2025, is projected to experience robust growth, exhibiting a Compound Annual Growth Rate (CAGR) of 7.84% from 2025 to 2033. This expansion is driven by several key factors. The increasing prevalence of chronic diseases globally necessitates advanced diagnostic tools, fueling demand for sophisticated medical imaging software. Furthermore, technological advancements like AI-powered image analysis and cloud-based solutions are enhancing diagnostic accuracy, efficiency, and accessibility, thereby stimulating market growth. The integration of medical imaging software with Electronic Health Records (EHR) systems is also streamlining workflows and improving patient care, contributing to market expansion. Growth is particularly strong in segments like 3D and 4D imaging, driven by their superior visualization capabilities for complex medical cases. Applications in cardiology, orthopedics, and oncology are leading the way, reflecting the crucial role of precise imaging in treatment planning and diagnosis for these disease areas. While data privacy concerns and the high cost of implementation pose some restraints, the overall market outlook remains positive, driven by ongoing technological innovation and rising healthcare expenditure.
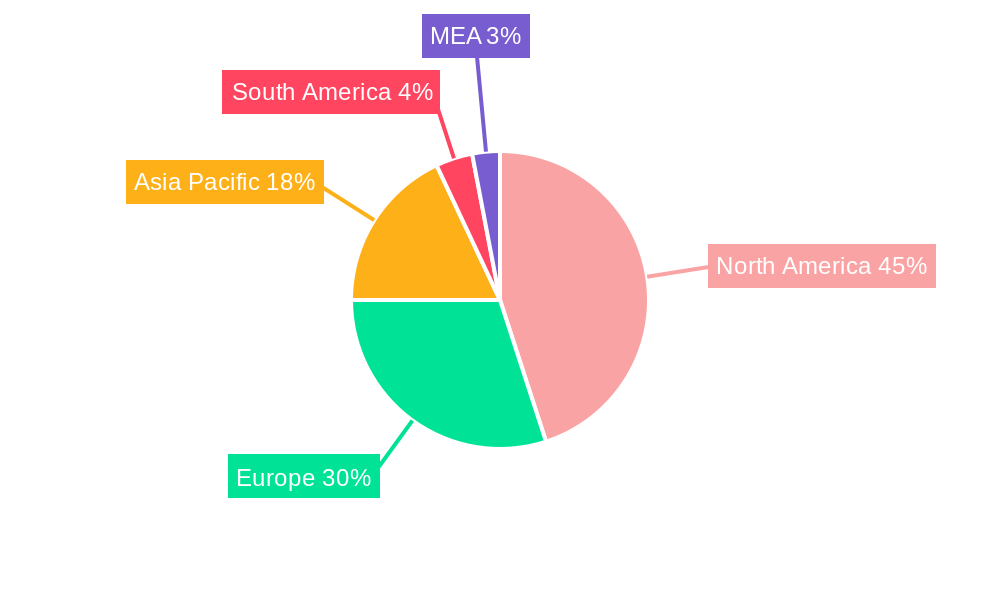
The geographic distribution of the market reveals significant regional variations. North America, particularly the United States, currently dominates the market due to high healthcare spending and advanced technological infrastructure. However, the Asia-Pacific region is anticipated to witness substantial growth in the coming years, fueled by increasing healthcare investments and rising adoption of advanced medical technologies in countries like China and India. Europe also holds a significant market share, driven by established healthcare systems and technological advancements. The competitive landscape is characterized by the presence of both established players like Siemens Healthcare, GE Healthcare, and Philips, and emerging innovative companies focused on developing specialized solutions. This intense competition is further driving innovation and pushing the market towards more sophisticated and affordable solutions, ultimately benefiting patients and healthcare providers alike.
Medical Imaging Software Industry Market Report: 2019-2033
This comprehensive report provides an in-depth analysis of the Medical Imaging Software market, encompassing market dynamics, growth trends, regional analysis, product landscape, key players, and future outlook. The study period covers 2019-2033, with 2025 as the base and estimated year. The forecast period spans 2025-2033, and the historical period is 2019-2024. The report segments the market by imaging type (2D, 3D, 4D) and application (Dental, Orthopaedic, Cardiology, Obstetrics & Gynaecology, Mammography, Urology & Nephrology, Other) to provide a granular understanding of this dynamic sector. The parent market is the broader Medical Imaging market, valued at xx Million, while the child market, specifically Medical Imaging Software, represents xx Million.
Medical Imaging Software Industry Market Dynamics & Structure
The medical imaging software market is characterized by a moderately concentrated landscape with key players holding significant market share. Technological innovation, particularly in AI and machine learning, is a primary growth driver, while regulatory frameworks, such as HIPAA and GDPR, influence market practices. Competitive substitutes include traditional film-based imaging and alternative diagnostic tools. End-user demographics, primarily hospitals, clinics, and diagnostic centers, shape market demand. The market witnesses consistent M&A activity, with approximately xx deals recorded in the past five years, representing a xx% increase from the previous period.
- Market Concentration: Top 5 players hold approximately xx% of the market share.
- Technological Innovation: AI-powered image analysis and cloud-based solutions are driving growth.
- Regulatory Landscape: HIPAA and GDPR compliance are crucial for market participants.
- Competitive Substitutes: Traditional methods and alternative diagnostic techniques present competition.
- End-User Demographics: Hospitals and diagnostic centers represent the largest end-user segment.
- M&A Activity: xx M&A deals annually in the last 5 years, valued at approximately xx Million.
- Innovation Barriers: High development costs and stringent regulatory approvals present significant barriers to entry.
Medical Imaging Software Industry Growth Trends & Insights
The medical imaging software market is experiencing robust growth, driven by increasing adoption rates across various healthcare settings. The market size exhibited a CAGR of xx% during the historical period (2019-2024) and is projected to maintain a CAGR of xx% throughout the forecast period (2025-2033), reaching xx Million by 2033. This growth is fueled by technological advancements such as AI-powered diagnostics, improved image quality, and increased accessibility through cloud-based solutions. The rising prevalence of chronic diseases, coupled with an aging global population, further fuels the demand for advanced medical imaging. The market penetration of medical imaging software in developed regions is relatively high, while developing nations present significant growth opportunities. Consumer behavior shifts toward personalized medicine and remote diagnostics contribute to market expansion.
Dominant Regions, Countries, or Segments in Medical Imaging Software Industry
North America currently dominates the medical imaging software market, holding a market share of xx%, followed by Europe at xx% and Asia Pacific at xx%. This dominance is driven by factors such as advanced healthcare infrastructure, high adoption rates of advanced technologies, and robust regulatory frameworks. Within the segment analysis, the Cardiology Applications segment exhibits the fastest growth rate (xx%), driven by rising cardiovascular disease prevalence and the growing demand for advanced diagnostic tools. 3D and 4D imaging are also experiencing high growth due to their enhanced diagnostic capabilities and improved clinical outcomes, exceeding the growth of 2D imaging significantly.
- Key Drivers in North America: Advanced healthcare infrastructure, high technological adoption.
- Key Drivers in Europe: Stringent regulatory frameworks, increasing healthcare spending.
- Key Drivers in Asia Pacific: Rising prevalence of chronic diseases, increasing healthcare awareness.
- Fastest-Growing Segments: Cardiology Applications (xx%), 3D & 4D Imaging.
- Market Share: North America (xx%), Europe (xx%), Asia Pacific (xx%).
Medical Imaging Software Industry Product Landscape
The medical imaging software market offers a diverse range of products, encompassing advanced visualization tools, image analysis software, and AI-powered diagnostic platforms. These products incorporate features like advanced image processing algorithms, machine learning capabilities, and cloud-based accessibility. Unique selling propositions include improved diagnostic accuracy, reduced turnaround times, and enhanced workflow efficiency. The incorporation of AI and machine learning leads to significant improvements in image quality, analysis speed, and diagnostic accuracy, setting the scene for continuous innovation.
Key Drivers, Barriers & Challenges in Medical Imaging Software Industry
Key Drivers:
- Increasing prevalence of chronic diseases.
- Technological advancements (AI, Cloud computing).
- Rising healthcare expenditure and investment in medical infrastructure.
Key Challenges & Restraints:
- High initial investment costs for software and infrastructure.
- Data security and privacy concerns regarding patient data.
- Stringent regulatory approvals and compliance requirements.
- Competition from established players and emerging technologies. The market faces a xx% decrease in growth due to supply chain issues impacting the availability of hardware components.
Emerging Opportunities in Medical Imaging Software Industry
- Expansion into untapped markets in developing economies.
- Development of specialized software for niche applications.
- Integration of telehealth platforms for remote diagnostics.
- Growing demand for AI-powered image analysis and predictive diagnostics.
Growth Accelerators in the Medical Imaging Software Industry
Strategic partnerships between software providers and medical device manufacturers are accelerating market growth. Continuous technological advancements, particularly in AI and cloud computing, are enhancing the capabilities of medical imaging software. Expanding into untapped markets, coupled with the increasing prevalence of chronic diseases globally, is creating significant growth opportunities for medical imaging software providers.
Key Players Shaping the Medical Imaging Software Industry Market
- Esaote SpA
- Siemens Healthcare
- General Healthcare Company (GE)
- Koninklijke Philips N V
- Agfa Gevaert HealthCare
- Cerner Corporation
- MIM Software Inc
- Canon Medical Systems Corporation
- Fujifilm Holding Company
- Carestream Health Inc
- Change Healthcare
- Novarad Corporation
Notable Milestones in Medical Imaging Software Industry Sector
- February 2022: The European Society of Radiology and GE Healthcare renewed their strategic partnership for ECR 2022.
- July 2022: Canon Medical launched the Vantage Fortian MRI system.
- July 2022: Calyx and Qynapse partnered to increase the use of AI-based neuroimaging in clinical trials.
In-Depth Medical Imaging Software Industry Market Outlook
The medical imaging software market is poised for significant growth, driven by technological advancements, rising healthcare expenditure, and an increasing prevalence of chronic diseases. Strategic partnerships and expansion into emerging markets will further fuel this growth. The market presents attractive opportunities for players focusing on AI-powered diagnostics, cloud-based solutions, and personalized medicine applications. The potential for market expansion is substantial, particularly in developing economies with rapidly growing healthcare sectors.
Medical Imaging Software Industry Segmentation
-
1. Imaging Type
- 1.1. 2D Imaging
- 1.2. 3D Imaging
- 1.3. 4D Imaging
-
2. Application
- 2.1. Dental Applications
- 2.2. Orthopaedic Applications
- 2.3. Cardiology Applications
- 2.4. Obstetrics and Gynaecology Applications
- 2.5. Mammography Applications
- 2.6. Urology and Nephrology Applications
- 2.7. Other Applications
Medical Imaging Software Industry Segmentation By Geography
-
1. North America
- 1.1. United States
- 1.2. Canada
-
2. Europe
- 2.1. Germany
- 2.2. France
- 2.3. United Kingdom
- 2.4. Rest of Europe
-
3. Asia Pacific
- 3.1. China
- 3.2. Japan
- 3.3. India
- 3.4. Rest of Asia Pacific
-
4. Rest of the World
- 4.1. Latin America
- 4.2. Middle East
Medical Imaging Software Industry REPORT HIGHLIGHTS
| Aspects | Details |
|---|---|
| Study Period | 2019-2033 |
| Base Year | 2024 |
| Estimated Year | 2025 |
| Forecast Period | 2025-2033 |
| Historical Period | 2019-2024 |
| Growth Rate | CAGR of 7.84% from 2019-2033 |
| Segmentation |
|
Table of Contents
- 1. Introduction
- 1.1. Research Scope
- 1.2. Market Segmentation
- 1.3. Research Methodology
- 1.4. Definitions and Assumptions
- 2. Executive Summary
- 2.1. Introduction
- 3. Market Dynamics
- 3.1. Introduction
- 3.2. Market Drivers
- 3.2.1. Growing Application of Computer-Aided Diagnostic Methods
- 3.3. Market Restrains
- 3.3.1. Dearth of Skilled Professionals and High Set-up Cost of the Equipment
- 3.4. Market Trends
- 3.4.1. Cardiology Applications Segment Holds Major Market Share
- 4. Market Factor Analysis
- 4.1. Porters Five Forces
- 4.2. Supply/Value Chain
- 4.3. PESTEL analysis
- 4.4. Market Entropy
- 4.5. Patent/Trademark Analysis
- 5. Global Medical Imaging Software Industry Analysis, Insights and Forecast, 2019-2031
- 5.1. Market Analysis, Insights and Forecast - by Imaging Type
- 5.1.1. 2D Imaging
- 5.1.2. 3D Imaging
- 5.1.3. 4D Imaging
- 5.2. Market Analysis, Insights and Forecast - by Application
- 5.2.1. Dental Applications
- 5.2.2. Orthopaedic Applications
- 5.2.3. Cardiology Applications
- 5.2.4. Obstetrics and Gynaecology Applications
- 5.2.5. Mammography Applications
- 5.2.6. Urology and Nephrology Applications
- 5.2.7. Other Applications
- 5.3. Market Analysis, Insights and Forecast - by Region
- 5.3.1. North America
- 5.3.2. Europe
- 5.3.3. Asia Pacific
- 5.3.4. Rest of the World
- 5.1. Market Analysis, Insights and Forecast - by Imaging Type
- 6. North America Medical Imaging Software Industry Analysis, Insights and Forecast, 2019-2031
- 6.1. Market Analysis, Insights and Forecast - by Imaging Type
- 6.1.1. 2D Imaging
- 6.1.2. 3D Imaging
- 6.1.3. 4D Imaging
- 6.2. Market Analysis, Insights and Forecast - by Application
- 6.2.1. Dental Applications
- 6.2.2. Orthopaedic Applications
- 6.2.3. Cardiology Applications
- 6.2.4. Obstetrics and Gynaecology Applications
- 6.2.5. Mammography Applications
- 6.2.6. Urology and Nephrology Applications
- 6.2.7. Other Applications
- 6.1. Market Analysis, Insights and Forecast - by Imaging Type
- 7. Europe Medical Imaging Software Industry Analysis, Insights and Forecast, 2019-2031
- 7.1. Market Analysis, Insights and Forecast - by Imaging Type
- 7.1.1. 2D Imaging
- 7.1.2. 3D Imaging
- 7.1.3. 4D Imaging
- 7.2. Market Analysis, Insights and Forecast - by Application
- 7.2.1. Dental Applications
- 7.2.2. Orthopaedic Applications
- 7.2.3. Cardiology Applications
- 7.2.4. Obstetrics and Gynaecology Applications
- 7.2.5. Mammography Applications
- 7.2.6. Urology and Nephrology Applications
- 7.2.7. Other Applications
- 7.1. Market Analysis, Insights and Forecast - by Imaging Type
- 8. Asia Pacific Medical Imaging Software Industry Analysis, Insights and Forecast, 2019-2031
- 8.1. Market Analysis, Insights and Forecast - by Imaging Type
- 8.1.1. 2D Imaging
- 8.1.2. 3D Imaging
- 8.1.3. 4D Imaging
- 8.2. Market Analysis, Insights and Forecast - by Application
- 8.2.1. Dental Applications
- 8.2.2. Orthopaedic Applications
- 8.2.3. Cardiology Applications
- 8.2.4. Obstetrics and Gynaecology Applications
- 8.2.5. Mammography Applications
- 8.2.6. Urology and Nephrology Applications
- 8.2.7. Other Applications
- 8.1. Market Analysis, Insights and Forecast - by Imaging Type
- 9. Rest of the World Medical Imaging Software Industry Analysis, Insights and Forecast, 2019-2031
- 9.1. Market Analysis, Insights and Forecast - by Imaging Type
- 9.1.1. 2D Imaging
- 9.1.2. 3D Imaging
- 9.1.3. 4D Imaging
- 9.2. Market Analysis, Insights and Forecast - by Application
- 9.2.1. Dental Applications
- 9.2.2. Orthopaedic Applications
- 9.2.3. Cardiology Applications
- 9.2.4. Obstetrics and Gynaecology Applications
- 9.2.5. Mammography Applications
- 9.2.6. Urology and Nephrology Applications
- 9.2.7. Other Applications
- 9.1. Market Analysis, Insights and Forecast - by Imaging Type
- 10. North America Medical Imaging Software Industry Analysis, Insights and Forecast, 2019-2031
- 10.1. Market Analysis, Insights and Forecast - By Country/Sub-region
- 10.1.1 United States
- 10.1.2 Canada
- 10.1.3 Mexico
- 11. Europe Medical Imaging Software Industry Analysis, Insights and Forecast, 2019-2031
- 11.1. Market Analysis, Insights and Forecast - By Country/Sub-region
- 11.1.1 Germany
- 11.1.2 United Kingdom
- 11.1.3 France
- 11.1.4 Spain
- 11.1.5 Italy
- 11.1.6 Spain
- 11.1.7 Belgium
- 11.1.8 Netherland
- 11.1.9 Nordics
- 11.1.10 Rest of Europe
- 12. Asia Pacific Medical Imaging Software Industry Analysis, Insights and Forecast, 2019-2031
- 12.1. Market Analysis, Insights and Forecast - By Country/Sub-region
- 12.1.1 China
- 12.1.2 Japan
- 12.1.3 India
- 12.1.4 South Korea
- 12.1.5 Southeast Asia
- 12.1.6 Australia
- 12.1.7 Indonesia
- 12.1.8 Phillipes
- 12.1.9 Singapore
- 12.1.10 Thailandc
- 12.1.11 Rest of Asia Pacific
- 13. South America Medical Imaging Software Industry Analysis, Insights and Forecast, 2019-2031
- 13.1. Market Analysis, Insights and Forecast - By Country/Sub-region
- 13.1.1 Brazil
- 13.1.2 Argentina
- 13.1.3 Peru
- 13.1.4 Chile
- 13.1.5 Colombia
- 13.1.6 Ecuador
- 13.1.7 Venezuela
- 13.1.8 Rest of South America
- 14. North America Medical Imaging Software Industry Analysis, Insights and Forecast, 2019-2031
- 14.1. Market Analysis, Insights and Forecast - By Country/Sub-region
- 14.1.1 United States
- 14.1.2 Canada
- 14.1.3 Mexico
- 15. MEA Medical Imaging Software Industry Analysis, Insights and Forecast, 2019-2031
- 15.1. Market Analysis, Insights and Forecast - By Country/Sub-region
- 15.1.1 United Arab Emirates
- 15.1.2 Saudi Arabia
- 15.1.3 South Africa
- 15.1.4 Rest of Middle East and Africa
- 16. Competitive Analysis
- 16.1. Global Market Share Analysis 2024
- 16.2. Company Profiles
- 16.2.1 Esaote SpA
- 16.2.1.1. Overview
- 16.2.1.2. Products
- 16.2.1.3. SWOT Analysis
- 16.2.1.4. Recent Developments
- 16.2.1.5. Financials (Based on Availability)
- 16.2.2 Siemens Healthcare
- 16.2.2.1. Overview
- 16.2.2.2. Products
- 16.2.2.3. SWOT Analysis
- 16.2.2.4. Recent Developments
- 16.2.2.5. Financials (Based on Availability)
- 16.2.3 General Healthcare Company (GE)
- 16.2.3.1. Overview
- 16.2.3.2. Products
- 16.2.3.3. SWOT Analysis
- 16.2.3.4. Recent Developments
- 16.2.3.5. Financials (Based on Availability)
- 16.2.4 Koninklijke Philips N V
- 16.2.4.1. Overview
- 16.2.4.2. Products
- 16.2.4.3. SWOT Analysis
- 16.2.4.4. Recent Developments
- 16.2.4.5. Financials (Based on Availability)
- 16.2.5 Agfa Gevaert HealthCare
- 16.2.5.1. Overview
- 16.2.5.2. Products
- 16.2.5.3. SWOT Analysis
- 16.2.5.4. Recent Developments
- 16.2.5.5. Financials (Based on Availability)
- 16.2.6 Cerner Corporation
- 16.2.6.1. Overview
- 16.2.6.2. Products
- 16.2.6.3. SWOT Analysis
- 16.2.6.4. Recent Developments
- 16.2.6.5. Financials (Based on Availability)
- 16.2.7 MIM Software Inc
- 16.2.7.1. Overview
- 16.2.7.2. Products
- 16.2.7.3. SWOT Analysis
- 16.2.7.4. Recent Developments
- 16.2.7.5. Financials (Based on Availability)
- 16.2.8 Canon Medical Systems Corporation
- 16.2.8.1. Overview
- 16.2.8.2. Products
- 16.2.8.3. SWOT Analysis
- 16.2.8.4. Recent Developments
- 16.2.8.5. Financials (Based on Availability)
- 16.2.9 Fujifilm Holding Company
- 16.2.9.1. Overview
- 16.2.9.2. Products
- 16.2.9.3. SWOT Analysis
- 16.2.9.4. Recent Developments
- 16.2.9.5. Financials (Based on Availability)
- 16.2.10 Carestream Health Inc
- 16.2.10.1. Overview
- 16.2.10.2. Products
- 16.2.10.3. SWOT Analysis
- 16.2.10.4. Recent Developments
- 16.2.10.5. Financials (Based on Availability)
- 16.2.11 Change Healthcare
- 16.2.11.1. Overview
- 16.2.11.2. Products
- 16.2.11.3. SWOT Analysis
- 16.2.11.4. Recent Developments
- 16.2.11.5. Financials (Based on Availability)
- 16.2.12 Novarad Corporation
- 16.2.12.1. Overview
- 16.2.12.2. Products
- 16.2.12.3. SWOT Analysis
- 16.2.12.4. Recent Developments
- 16.2.12.5. Financials (Based on Availability)
- 16.2.1 Esaote SpA
List of Figures
- Figure 1: Global Medical Imaging Software Industry Revenue Breakdown (Million, %) by Region 2024 & 2032
- Figure 2: North America Medical Imaging Software Industry Revenue (Million), by Country 2024 & 2032
- Figure 3: North America Medical Imaging Software Industry Revenue Share (%), by Country 2024 & 2032
- Figure 4: Europe Medical Imaging Software Industry Revenue (Million), by Country 2024 & 2032
- Figure 5: Europe Medical Imaging Software Industry Revenue Share (%), by Country 2024 & 2032
- Figure 6: Asia Pacific Medical Imaging Software Industry Revenue (Million), by Country 2024 & 2032
- Figure 7: Asia Pacific Medical Imaging Software Industry Revenue Share (%), by Country 2024 & 2032
- Figure 8: South America Medical Imaging Software Industry Revenue (Million), by Country 2024 & 2032
- Figure 9: South America Medical Imaging Software Industry Revenue Share (%), by Country 2024 & 2032
- Figure 10: North America Medical Imaging Software Industry Revenue (Million), by Country 2024 & 2032
- Figure 11: North America Medical Imaging Software Industry Revenue Share (%), by Country 2024 & 2032
- Figure 12: MEA Medical Imaging Software Industry Revenue (Million), by Country 2024 & 2032
- Figure 13: MEA Medical Imaging Software Industry Revenue Share (%), by Country 2024 & 2032
- Figure 14: North America Medical Imaging Software Industry Revenue (Million), by Imaging Type 2024 & 2032
- Figure 15: North America Medical Imaging Software Industry Revenue Share (%), by Imaging Type 2024 & 2032
- Figure 16: North America Medical Imaging Software Industry Revenue (Million), by Application 2024 & 2032
- Figure 17: North America Medical Imaging Software Industry Revenue Share (%), by Application 2024 & 2032
- Figure 18: North America Medical Imaging Software Industry Revenue (Million), by Country 2024 & 2032
- Figure 19: North America Medical Imaging Software Industry Revenue Share (%), by Country 2024 & 2032
- Figure 20: Europe Medical Imaging Software Industry Revenue (Million), by Imaging Type 2024 & 2032
- Figure 21: Europe Medical Imaging Software Industry Revenue Share (%), by Imaging Type 2024 & 2032
- Figure 22: Europe Medical Imaging Software Industry Revenue (Million), by Application 2024 & 2032
- Figure 23: Europe Medical Imaging Software Industry Revenue Share (%), by Application 2024 & 2032
- Figure 24: Europe Medical Imaging Software Industry Revenue (Million), by Country 2024 & 2032
- Figure 25: Europe Medical Imaging Software Industry Revenue Share (%), by Country 2024 & 2032
- Figure 26: Asia Pacific Medical Imaging Software Industry Revenue (Million), by Imaging Type 2024 & 2032
- Figure 27: Asia Pacific Medical Imaging Software Industry Revenue Share (%), by Imaging Type 2024 & 2032
- Figure 28: Asia Pacific Medical Imaging Software Industry Revenue (Million), by Application 2024 & 2032
- Figure 29: Asia Pacific Medical Imaging Software Industry Revenue Share (%), by Application 2024 & 2032
- Figure 30: Asia Pacific Medical Imaging Software Industry Revenue (Million), by Country 2024 & 2032
- Figure 31: Asia Pacific Medical Imaging Software Industry Revenue Share (%), by Country 2024 & 2032
- Figure 32: Rest of the World Medical Imaging Software Industry Revenue (Million), by Imaging Type 2024 & 2032
- Figure 33: Rest of the World Medical Imaging Software Industry Revenue Share (%), by Imaging Type 2024 & 2032
- Figure 34: Rest of the World Medical Imaging Software Industry Revenue (Million), by Application 2024 & 2032
- Figure 35: Rest of the World Medical Imaging Software Industry Revenue Share (%), by Application 2024 & 2032
- Figure 36: Rest of the World Medical Imaging Software Industry Revenue (Million), by Country 2024 & 2032
- Figure 37: Rest of the World Medical Imaging Software Industry Revenue Share (%), by Country 2024 & 2032
List of Tables
- Table 1: Global Medical Imaging Software Industry Revenue Million Forecast, by Region 2019 & 2032
- Table 2: Global Medical Imaging Software Industry Revenue Million Forecast, by Imaging Type 2019 & 2032
- Table 3: Global Medical Imaging Software Industry Revenue Million Forecast, by Application 2019 & 2032
- Table 4: Global Medical Imaging Software Industry Revenue Million Forecast, by Region 2019 & 2032
- Table 5: Global Medical Imaging Software Industry Revenue Million Forecast, by Country 2019 & 2032
- Table 6: United States Medical Imaging Software Industry Revenue (Million) Forecast, by Application 2019 & 2032
- Table 7: Canada Medical Imaging Software Industry Revenue (Million) Forecast, by Application 2019 & 2032
- Table 8: Mexico Medical Imaging Software Industry Revenue (Million) Forecast, by Application 2019 & 2032
- Table 9: Global Medical Imaging Software Industry Revenue Million Forecast, by Country 2019 & 2032
- Table 10: Germany Medical Imaging Software Industry Revenue (Million) Forecast, by Application 2019 & 2032
- Table 11: United Kingdom Medical Imaging Software Industry Revenue (Million) Forecast, by Application 2019 & 2032
- Table 12: France Medical Imaging Software Industry Revenue (Million) Forecast, by Application 2019 & 2032
- Table 13: Spain Medical Imaging Software Industry Revenue (Million) Forecast, by Application 2019 & 2032
- Table 14: Italy Medical Imaging Software Industry Revenue (Million) Forecast, by Application 2019 & 2032
- Table 15: Spain Medical Imaging Software Industry Revenue (Million) Forecast, by Application 2019 & 2032
- Table 16: Belgium Medical Imaging Software Industry Revenue (Million) Forecast, by Application 2019 & 2032
- Table 17: Netherland Medical Imaging Software Industry Revenue (Million) Forecast, by Application 2019 & 2032
- Table 18: Nordics Medical Imaging Software Industry Revenue (Million) Forecast, by Application 2019 & 2032
- Table 19: Rest of Europe Medical Imaging Software Industry Revenue (Million) Forecast, by Application 2019 & 2032
- Table 20: Global Medical Imaging Software Industry Revenue Million Forecast, by Country 2019 & 2032
- Table 21: China Medical Imaging Software Industry Revenue (Million) Forecast, by Application 2019 & 2032
- Table 22: Japan Medical Imaging Software Industry Revenue (Million) Forecast, by Application 2019 & 2032
- Table 23: India Medical Imaging Software Industry Revenue (Million) Forecast, by Application 2019 & 2032
- Table 24: South Korea Medical Imaging Software Industry Revenue (Million) Forecast, by Application 2019 & 2032
- Table 25: Southeast Asia Medical Imaging Software Industry Revenue (Million) Forecast, by Application 2019 & 2032
- Table 26: Australia Medical Imaging Software Industry Revenue (Million) Forecast, by Application 2019 & 2032
- Table 27: Indonesia Medical Imaging Software Industry Revenue (Million) Forecast, by Application 2019 & 2032
- Table 28: Phillipes Medical Imaging Software Industry Revenue (Million) Forecast, by Application 2019 & 2032
- Table 29: Singapore Medical Imaging Software Industry Revenue (Million) Forecast, by Application 2019 & 2032
- Table 30: Thailandc Medical Imaging Software Industry Revenue (Million) Forecast, by Application 2019 & 2032
- Table 31: Rest of Asia Pacific Medical Imaging Software Industry Revenue (Million) Forecast, by Application 2019 & 2032
- Table 32: Global Medical Imaging Software Industry Revenue Million Forecast, by Country 2019 & 2032
- Table 33: Brazil Medical Imaging Software Industry Revenue (Million) Forecast, by Application 2019 & 2032
- Table 34: Argentina Medical Imaging Software Industry Revenue (Million) Forecast, by Application 2019 & 2032
- Table 35: Peru Medical Imaging Software Industry Revenue (Million) Forecast, by Application 2019 & 2032
- Table 36: Chile Medical Imaging Software Industry Revenue (Million) Forecast, by Application 2019 & 2032
- Table 37: Colombia Medical Imaging Software Industry Revenue (Million) Forecast, by Application 2019 & 2032
- Table 38: Ecuador Medical Imaging Software Industry Revenue (Million) Forecast, by Application 2019 & 2032
- Table 39: Venezuela Medical Imaging Software Industry Revenue (Million) Forecast, by Application 2019 & 2032
- Table 40: Rest of South America Medical Imaging Software Industry Revenue (Million) Forecast, by Application 2019 & 2032
- Table 41: Global Medical Imaging Software Industry Revenue Million Forecast, by Country 2019 & 2032
- Table 42: United States Medical Imaging Software Industry Revenue (Million) Forecast, by Application 2019 & 2032
- Table 43: Canada Medical Imaging Software Industry Revenue (Million) Forecast, by Application 2019 & 2032
- Table 44: Mexico Medical Imaging Software Industry Revenue (Million) Forecast, by Application 2019 & 2032
- Table 45: Global Medical Imaging Software Industry Revenue Million Forecast, by Country 2019 & 2032
- Table 46: United Arab Emirates Medical Imaging Software Industry Revenue (Million) Forecast, by Application 2019 & 2032
- Table 47: Saudi Arabia Medical Imaging Software Industry Revenue (Million) Forecast, by Application 2019 & 2032
- Table 48: South Africa Medical Imaging Software Industry Revenue (Million) Forecast, by Application 2019 & 2032
- Table 49: Rest of Middle East and Africa Medical Imaging Software Industry Revenue (Million) Forecast, by Application 2019 & 2032
- Table 50: Global Medical Imaging Software Industry Revenue Million Forecast, by Imaging Type 2019 & 2032
- Table 51: Global Medical Imaging Software Industry Revenue Million Forecast, by Application 2019 & 2032
- Table 52: Global Medical Imaging Software Industry Revenue Million Forecast, by Country 2019 & 2032
- Table 53: United States Medical Imaging Software Industry Revenue (Million) Forecast, by Application 2019 & 2032
- Table 54: Canada Medical Imaging Software Industry Revenue (Million) Forecast, by Application 2019 & 2032
- Table 55: Global Medical Imaging Software Industry Revenue Million Forecast, by Imaging Type 2019 & 2032
- Table 56: Global Medical Imaging Software Industry Revenue Million Forecast, by Application 2019 & 2032
- Table 57: Global Medical Imaging Software Industry Revenue Million Forecast, by Country 2019 & 2032
- Table 58: Germany Medical Imaging Software Industry Revenue (Million) Forecast, by Application 2019 & 2032
- Table 59: France Medical Imaging Software Industry Revenue (Million) Forecast, by Application 2019 & 2032
- Table 60: United Kingdom Medical Imaging Software Industry Revenue (Million) Forecast, by Application 2019 & 2032
- Table 61: Rest of Europe Medical Imaging Software Industry Revenue (Million) Forecast, by Application 2019 & 2032
- Table 62: Global Medical Imaging Software Industry Revenue Million Forecast, by Imaging Type 2019 & 2032
- Table 63: Global Medical Imaging Software Industry Revenue Million Forecast, by Application 2019 & 2032
- Table 64: Global Medical Imaging Software Industry Revenue Million Forecast, by Country 2019 & 2032
- Table 65: China Medical Imaging Software Industry Revenue (Million) Forecast, by Application 2019 & 2032
- Table 66: Japan Medical Imaging Software Industry Revenue (Million) Forecast, by Application 2019 & 2032
- Table 67: India Medical Imaging Software Industry Revenue (Million) Forecast, by Application 2019 & 2032
- Table 68: Rest of Asia Pacific Medical Imaging Software Industry Revenue (Million) Forecast, by Application 2019 & 2032
- Table 69: Global Medical Imaging Software Industry Revenue Million Forecast, by Imaging Type 2019 & 2032
- Table 70: Global Medical Imaging Software Industry Revenue Million Forecast, by Application 2019 & 2032
- Table 71: Global Medical Imaging Software Industry Revenue Million Forecast, by Country 2019 & 2032
- Table 72: Latin America Medical Imaging Software Industry Revenue (Million) Forecast, by Application 2019 & 2032
- Table 73: Middle East Medical Imaging Software Industry Revenue (Million) Forecast, by Application 2019 & 2032
Frequently Asked Questions
1. What is the projected Compound Annual Growth Rate (CAGR) of the Medical Imaging Software Industry?
The projected CAGR is approximately 7.84%.
2. Which companies are prominent players in the Medical Imaging Software Industry?
Key companies in the market include Esaote SpA, Siemens Healthcare, General Healthcare Company (GE), Koninklijke Philips N V, Agfa Gevaert HealthCare, Cerner Corporation, MIM Software Inc, Canon Medical Systems Corporation, Fujifilm Holding Company, Carestream Health Inc, Change Healthcare, Novarad Corporation.
3. What are the main segments of the Medical Imaging Software Industry?
The market segments include Imaging Type, Application.
4. Can you provide details about the market size?
The market size is estimated to be USD 8.11 Million as of 2022.
5. What are some drivers contributing to market growth?
Growing Application of Computer-Aided Diagnostic Methods.
6. What are the notable trends driving market growth?
Cardiology Applications Segment Holds Major Market Share.
7. Are there any restraints impacting market growth?
Dearth of Skilled Professionals and High Set-up Cost of the Equipment.
8. Can you provide examples of recent developments in the market?
February 2022 - The European Society of Radiology and GE Healthcare have renewed their strategic partnership for the online European Congress of Radiology ECR 2022 on March 2-6, 2022, and onsite ECR 2022 on July 13-17 in Vienna, Austria. GE Healthcare would focus its efforts on three strategic pillars, digital and artificial intelligence, patient experience, and sustainability & resilience.
9. What pricing options are available for accessing the report?
Pricing options include single-user, multi-user, and enterprise licenses priced at USD 4750, USD 5250, and USD 8750 respectively.
10. Is the market size provided in terms of value or volume?
The market size is provided in terms of value, measured in Million.
11. Are there any specific market keywords associated with the report?
Yes, the market keyword associated with the report is "Medical Imaging Software Industry," which aids in identifying and referencing the specific market segment covered.
12. How do I determine which pricing option suits my needs best?
The pricing options vary based on user requirements and access needs. Individual users may opt for single-user licenses, while businesses requiring broader access may choose multi-user or enterprise licenses for cost-effective access to the report.
13. Are there any additional resources or data provided in the Medical Imaging Software Industry report?
While the report offers comprehensive insights, it's advisable to review the specific contents or supplementary materials provided to ascertain if additional resources or data are available.
14. How can I stay updated on further developments or reports in the Medical Imaging Software Industry?
To stay informed about further developments, trends, and reports in the Medical Imaging Software Industry, consider subscribing to industry newsletters, following relevant companies and organizations, or regularly checking reputable industry news sources and publications.
Methodology
Step 1 - Identification of Relevant Samples Size from Population Database


Step 2 - Approaches for Defining Global Market Size (Value, Volume* & Price*)

Note*: In applicable scenarios
Step 3 - Data Sources
Primary Research
- Web Analytics
- Survey Reports
- Research Institute
- Latest Research Reports
- Opinion Leaders
Secondary Research
- Annual Reports
- White Paper
- Latest Press Release
- Industry Association
- Paid Database
- Investor Presentations

Step 4 - Data Triangulation
Involves using different sources of information in order to increase the validity of a study
These sources are likely to be stakeholders in a program - participants, other researchers, program staff, other community members, and so on.
Then we put all data in single framework & apply various statistical tools to find out the dynamic on the market.
During the analysis stage, feedback from the stakeholder groups would be compared to determine areas of agreement as well as areas of divergence


