
Key Insights
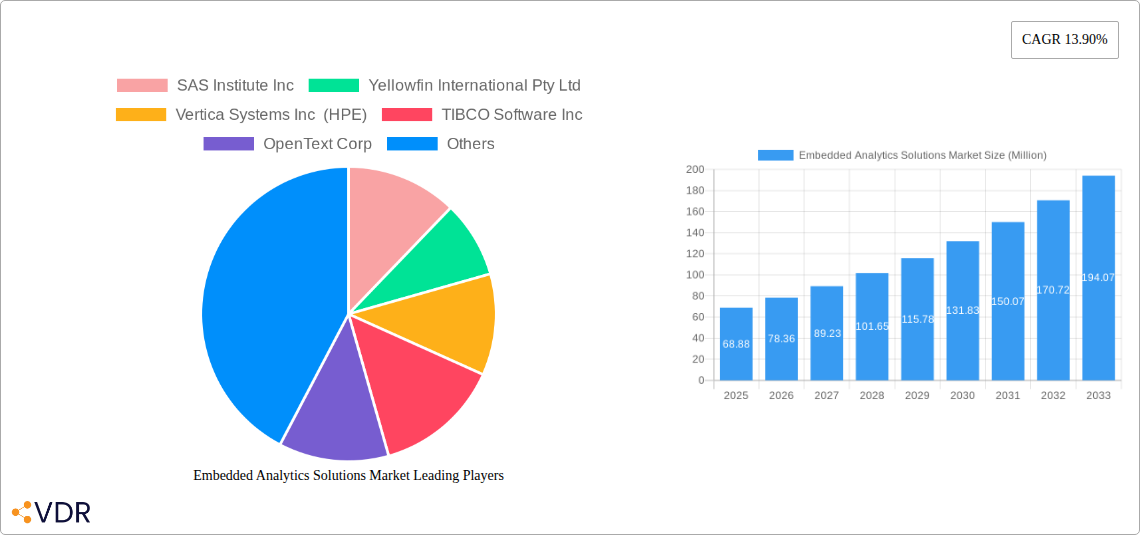
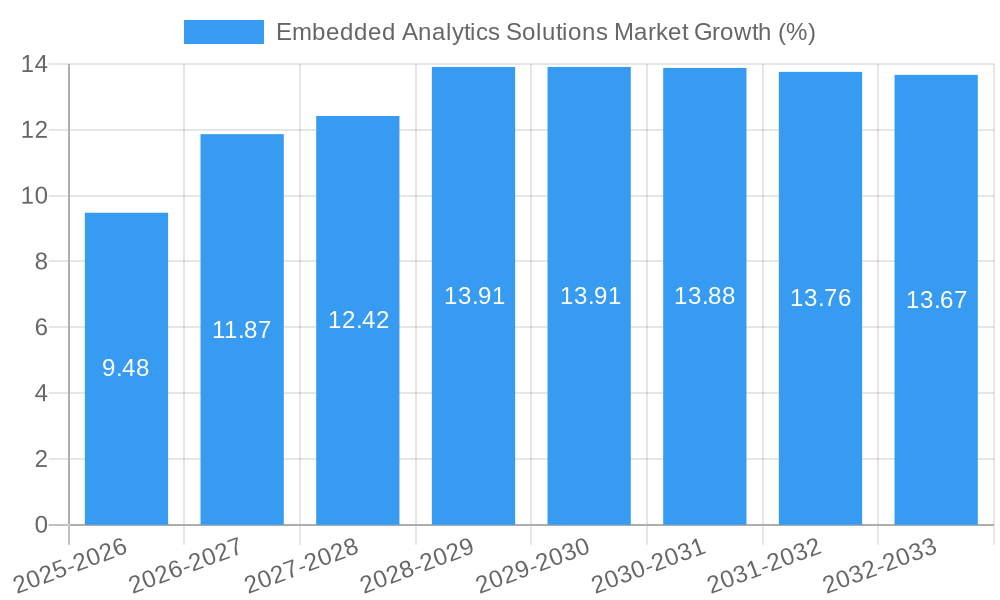
The Embedded Analytics Solutions market is experiencing robust growth, projected to reach $68.88 million in 2025 and exhibiting a Compound Annual Growth Rate (CAGR) of 13.90%. This expansion is fueled by several key drivers. The increasing demand for data-driven decision-making across various industries, particularly BFSI, IT & Telecommunications, and Healthcare, is a primary catalyst. Businesses are increasingly adopting cloud-based solutions for their scalability and accessibility, further propelling market growth. Furthermore, the rising adoption of embedded analytics within existing software applications, offering seamless integration and improved user experience, contributes significantly to market expansion. The trend toward personalized customer experiences and the need for real-time business intelligence also play crucial roles. While the market faces certain restraints, such as the complexity of implementation and the need for skilled professionals, the overall positive trajectory is expected to continue throughout the forecast period (2025-2033). The market segmentation, encompassing different organizational sizes, deployment methods (cloud and on-premise), end-user verticals, and solution types (software and services), provides further granularity to understand market dynamics and growth potential within specific niches. The competitive landscape is characterized by a mix of established players and emerging companies, indicating ongoing innovation and market consolidation.
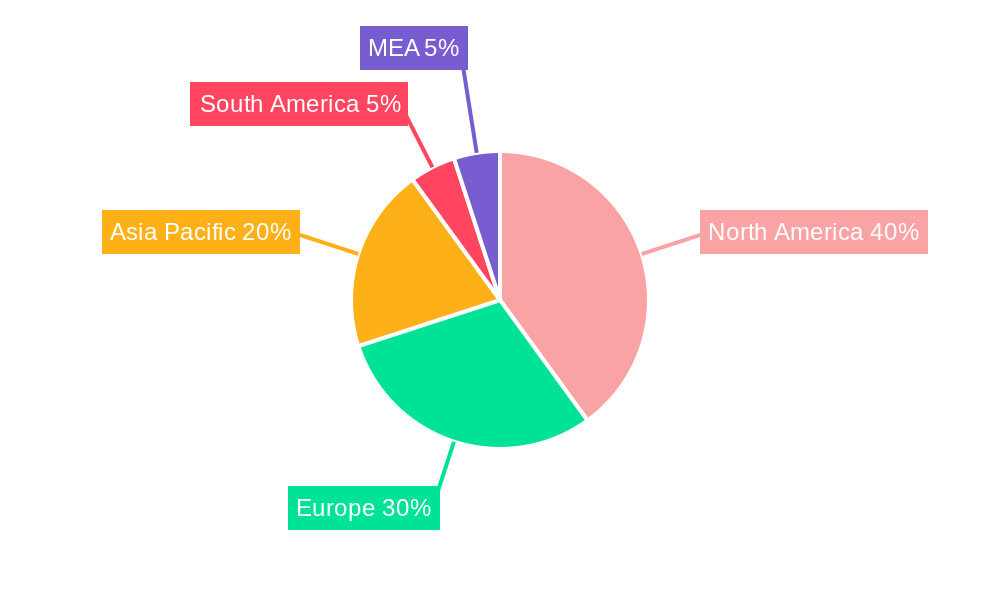
The substantial presence of major players like SAS, IBM, and Microsoft underscores the market's maturity and strategic importance. However, smaller, specialized firms are also carving out significant niches. The geographical distribution is diverse, with North America and Europe currently dominating the market. However, the Asia-Pacific region is poised for significant growth, driven by rapid technological advancements and increasing digital adoption in emerging economies. Market projections suggest continuous expansion across all regions, with variations in growth rates reflecting the unique economic and technological landscapes of each area. The long-term forecast indicates sustained growth in embedded analytics, driven by continued digital transformation initiatives across various industries. This points toward a considerable investment opportunity in this dynamic and expanding market segment.
Embedded Analytics Solutions Market: A Comprehensive Report (2019-2033)
This comprehensive report provides a detailed analysis of the Embedded Analytics Solutions Market, encompassing market dynamics, growth trends, regional dominance, product landscape, key players, and future outlook. The study period spans from 2019 to 2033, with 2025 serving as the base and estimated year. The report segments the market by organization size (SMEs and Large Enterprises), deployment (Cloud and On-premise), end-user vertical (BFSI, IT & Telecommunication, Healthcare, Retail, Energy & Utilities, Manufacturing, and Others), and solution type (Software and Service). The market size is valued in million units.
Embedded Analytics Solutions Market Dynamics & Structure
The Embedded Analytics Solutions Market exhibits a moderately concentrated structure, with a handful of major players dominating the landscape while several niche players cater to specialized segments. Market concentration is likely around xx%, with the top 5 players holding approximately xx%. Technological innovation, particularly in AI and cloud computing, is a significant driver, pushing the adoption of embedded analytics across various industries. Stringent data privacy regulations, however, pose challenges to market expansion. The market also witnesses competitive pressures from alternative data visualization and business intelligence tools. Mergers and acquisitions (M&A) activity is moderate, with approximately xx deals recorded between 2019 and 2024.
- Market Concentration: xx% (estimated)
- Technological Innovation: AI integration, cloud-based solutions.
- Regulatory Framework: GDPR, CCPA, and other data privacy regulations.
- Competitive Substitutes: Traditional BI tools, spreadsheet software.
- End-User Demographics: Increasing adoption across all segments, particularly large enterprises.
- M&A Activity: Approximately xx deals (2019-2024).
Embedded Analytics Solutions Market Growth Trends & Insights
The Embedded Analytics Solutions Market experienced significant growth from 2019 to 2024, with a Compound Annual Growth Rate (CAGR) of xx%. This growth is primarily fueled by the increasing demand for data-driven decision-making across various industries. The market is expected to maintain a strong growth trajectory throughout the forecast period (2025-2033), driven by factors like increasing adoption of cloud-based solutions, rising penetration of AI and machine learning in analytics, and the growing need for real-time insights. Market penetration in key verticals such as BFSI and IT & Telecommunication is expected to reach xx% by 2033. The shift towards cloud deployment is accelerating market growth, with a predicted CAGR of xx% for cloud-based solutions during the forecast period.
Dominant Regions, Countries, or Segments in Embedded Analytics Solutions Market
North America currently holds the largest market share, driven by strong technological advancements and high adoption rates in the BFSI and IT & Telecommunication sectors. However, the Asia-Pacific region is projected to exhibit the highest growth rate over the forecast period due to rapid digital transformation and rising investments in data analytics infrastructure. Within market segments, the large enterprise segment dominates due to higher investment capacity and complex data needs. Cloud deployment is gaining traction over on-premise solutions due to scalability, cost-effectiveness, and accessibility. The BFSI sector leads in end-user verticals due to its focus on risk management and customer relationship management. Software solutions have the higher market share due to better versatility and customization.
- Key Drivers (North America): Strong technological ecosystem, high adoption rates.
- Key Drivers (Asia-Pacific): Rapid digital transformation, increasing investments.
- Dominant Segment (Size of Organization): Large Enterprises
- Dominant Segment (Deployment): Cloud
- Dominant Segment (End-user Vertical): BFSI
- Dominant Segment (Solution): Software
Embedded Analytics Solutions Market Product Landscape
Embedded analytics solutions are rapidly evolving, integrating advanced technologies like AI, machine learning, and natural language processing (NLP) to enhance their capabilities. Products are increasingly focusing on user-friendliness, ease of integration, and the ability to provide real-time insights. Key selling propositions include customizable dashboards, seamless data integration, and advanced visualization tools. Recent advancements include the automation of data preparation processes and the use of predictive analytics for better forecasting and decision-making.
Key Drivers, Barriers & Challenges in Embedded Analytics Solutions Market
Key Drivers: Increased demand for data-driven decisions, rise in cloud computing adoption, growing need for real-time business intelligence. The integration of AI and machine learning into these platforms enhances capabilities and creates strong demand. Government initiatives promoting digital transformation are also key.
Key Barriers and Challenges: High initial investment costs, complexity in implementation, data security and privacy concerns, lack of skilled professionals, and the need for robust data infrastructure. Competition from other business intelligence solutions and integration difficulties contribute to further challenges. Data integration issues across diverse systems are another challenge.
Emerging Opportunities in Embedded Analytics Solutions Market
Untapped markets in developing economies represent significant growth potential. The integration of embedded analytics into IoT devices and the development of specialized solutions for specific industries present exciting opportunities. The increasing demand for personalized customer experiences fuels opportunities for advanced analytics applications, and the growing adoption of edge computing enhances real-time data processing capabilities.
Growth Accelerators in the Embedded Analytics Solutions Market Industry
Strategic partnerships between analytics providers and technology companies are accelerating market growth by enabling seamless integration and expanding reach. Advancements in AI, particularly in areas like predictive modeling and anomaly detection, continue to drive demand. Market expansion through partnerships and expansion in untapped markets are also enhancing growth.
Key Players Shaping the Embedded Analytics Solutions Market Market
- SAS Institute Inc
- Yellowfin International Pty Ltd
- Vertica Systems Inc (HPE)
- TIBCO Software Inc
- OpenText Corp
- IBM Corporation
- WNS Global Services SA (Pty) Ltd
- Information Builders Inc
- MicroStrategy Incorporated
- GoodData Corporation
- Microsoft Corporation
- QlikTech International AB
- Birst Inc (Infor Inc)
- Tableau Software (Salesforce Inc)
- Oracle Corporation
- Logi Analytics Inc
- Sisense Inc
- Izenda Inc
- Exago Inc
- SAP SE
Notable Milestones in Embedded Analytics Solutions Market Sector
- August 2022: SAS and SingleStore collaborate to enhance data access and analytics performance.
- July 2022: TIBCO launches TIBCO ModelOps for simplified AI model management.
In-Depth Embedded Analytics Solutions Market Market Outlook
The Embedded Analytics Solutions Market is poised for continued strong growth driven by technological innovation, increasing digitalization, and the growing need for data-driven decision-making across various industries. Strategic partnerships and expansion into emerging markets will play a significant role in shaping the future of this market. The focus on enhanced data security and user-friendly interfaces will further drive market expansion.
Embedded Analytics Solutions Market Segmentation
-
1. Solution
- 1.1. Software
- 1.2. Service
-
2. Size of Organisation
- 2.1. Small and Medium Enterprises
- 2.2. Large Enterprises
-
3. Deployment
- 3.1. Cloud
- 3.2. On-premise
-
4. End-user Vertical
- 4.1. BFSI
- 4.2. IT and Telecommunication
- 4.3. Healthcare
- 4.4. Retail
- 4.5. Energy and Utilities
- 4.6. Manufacturing
- 4.7. Other End-user Verticals
Embedded Analytics Solutions Market Segmentation By Geography
- 1. North America
- 2. Europe
- 3. Asia Pacific
- 4. Latin America
- 5. Middle East and Africa
Embedded Analytics Solutions Market REPORT HIGHLIGHTS
| Aspects | Details |
|---|---|
| Study Period | 2019-2033 |
| Base Year | 2024 |
| Estimated Year | 2025 |
| Forecast Period | 2025-2033 |
| Historical Period | 2019-2024 |
| Growth Rate | CAGR of 13.90% from 2019-2033 |
| Segmentation |
|
Table of Contents
- 1. Introduction
- 1.1. Research Scope
- 1.2. Market Segmentation
- 1.3. Research Methodology
- 1.4. Definitions and Assumptions
- 2. Executive Summary
- 2.1. Introduction
- 3. Market Dynamics
- 3.1. Introduction
- 3.2. Market Drivers
- 3.2.1. Increasing Demand for Advanced Analytical Techniques for Business Data; Increasing number of Data Driven Organizations; Increasing Adoption of Mobile BI and Big Data Analytics; Increasing Use of Mobile Devices and Cloud Computing Technologies
- 3.3. Market Restrains
- 3.3.1. Licensing Challenges and Higher Associated Costs
- 3.4. Market Trends
- 3.4.1. Increasing Use of Mobile Devices and Cloud Computing Technologies to Witness Significant Growth
- 4. Market Factor Analysis
- 4.1. Porters Five Forces
- 4.2. Supply/Value Chain
- 4.3. PESTEL analysis
- 4.4. Market Entropy
- 4.5. Patent/Trademark Analysis
- 5. Global Embedded Analytics Solutions Market Analysis, Insights and Forecast, 2019-2031
- 5.1. Market Analysis, Insights and Forecast - by Solution
- 5.1.1. Software
- 5.1.2. Service
- 5.2. Market Analysis, Insights and Forecast - by Size of Organisation
- 5.2.1. Small and Medium Enterprises
- 5.2.2. Large Enterprises
- 5.3. Market Analysis, Insights and Forecast - by Deployment
- 5.3.1. Cloud
- 5.3.2. On-premise
- 5.4. Market Analysis, Insights and Forecast - by End-user Vertical
- 5.4.1. BFSI
- 5.4.2. IT and Telecommunication
- 5.4.3. Healthcare
- 5.4.4. Retail
- 5.4.5. Energy and Utilities
- 5.4.6. Manufacturing
- 5.4.7. Other End-user Verticals
- 5.5. Market Analysis, Insights and Forecast - by Region
- 5.5.1. North America
- 5.5.2. Europe
- 5.5.3. Asia Pacific
- 5.5.4. Latin America
- 5.5.5. Middle East and Africa
- 5.1. Market Analysis, Insights and Forecast - by Solution
- 6. North America Embedded Analytics Solutions Market Analysis, Insights and Forecast, 2019-2031
- 6.1. Market Analysis, Insights and Forecast - by Solution
- 6.1.1. Software
- 6.1.2. Service
- 6.2. Market Analysis, Insights and Forecast - by Size of Organisation
- 6.2.1. Small and Medium Enterprises
- 6.2.2. Large Enterprises
- 6.3. Market Analysis, Insights and Forecast - by Deployment
- 6.3.1. Cloud
- 6.3.2. On-premise
- 6.4. Market Analysis, Insights and Forecast - by End-user Vertical
- 6.4.1. BFSI
- 6.4.2. IT and Telecommunication
- 6.4.3. Healthcare
- 6.4.4. Retail
- 6.4.5. Energy and Utilities
- 6.4.6. Manufacturing
- 6.4.7. Other End-user Verticals
- 6.1. Market Analysis, Insights and Forecast - by Solution
- 7. Europe Embedded Analytics Solutions Market Analysis, Insights and Forecast, 2019-2031
- 7.1. Market Analysis, Insights and Forecast - by Solution
- 7.1.1. Software
- 7.1.2. Service
- 7.2. Market Analysis, Insights and Forecast - by Size of Organisation
- 7.2.1. Small and Medium Enterprises
- 7.2.2. Large Enterprises
- 7.3. Market Analysis, Insights and Forecast - by Deployment
- 7.3.1. Cloud
- 7.3.2. On-premise
- 7.4. Market Analysis, Insights and Forecast - by End-user Vertical
- 7.4.1. BFSI
- 7.4.2. IT and Telecommunication
- 7.4.3. Healthcare
- 7.4.4. Retail
- 7.4.5. Energy and Utilities
- 7.4.6. Manufacturing
- 7.4.7. Other End-user Verticals
- 7.1. Market Analysis, Insights and Forecast - by Solution
- 8. Asia Pacific Embedded Analytics Solutions Market Analysis, Insights and Forecast, 2019-2031
- 8.1. Market Analysis, Insights and Forecast - by Solution
- 8.1.1. Software
- 8.1.2. Service
- 8.2. Market Analysis, Insights and Forecast - by Size of Organisation
- 8.2.1. Small and Medium Enterprises
- 8.2.2. Large Enterprises
- 8.3. Market Analysis, Insights and Forecast - by Deployment
- 8.3.1. Cloud
- 8.3.2. On-premise
- 8.4. Market Analysis, Insights and Forecast - by End-user Vertical
- 8.4.1. BFSI
- 8.4.2. IT and Telecommunication
- 8.4.3. Healthcare
- 8.4.4. Retail
- 8.4.5. Energy and Utilities
- 8.4.6. Manufacturing
- 8.4.7. Other End-user Verticals
- 8.1. Market Analysis, Insights and Forecast - by Solution
- 9. Latin America Embedded Analytics Solutions Market Analysis, Insights and Forecast, 2019-2031
- 9.1. Market Analysis, Insights and Forecast - by Solution
- 9.1.1. Software
- 9.1.2. Service
- 9.2. Market Analysis, Insights and Forecast - by Size of Organisation
- 9.2.1. Small and Medium Enterprises
- 9.2.2. Large Enterprises
- 9.3. Market Analysis, Insights and Forecast - by Deployment
- 9.3.1. Cloud
- 9.3.2. On-premise
- 9.4. Market Analysis, Insights and Forecast - by End-user Vertical
- 9.4.1. BFSI
- 9.4.2. IT and Telecommunication
- 9.4.3. Healthcare
- 9.4.4. Retail
- 9.4.5. Energy and Utilities
- 9.4.6. Manufacturing
- 9.4.7. Other End-user Verticals
- 9.1. Market Analysis, Insights and Forecast - by Solution
- 10. Middle East and Africa Embedded Analytics Solutions Market Analysis, Insights and Forecast, 2019-2031
- 10.1. Market Analysis, Insights and Forecast - by Solution
- 10.1.1. Software
- 10.1.2. Service
- 10.2. Market Analysis, Insights and Forecast - by Size of Organisation
- 10.2.1. Small and Medium Enterprises
- 10.2.2. Large Enterprises
- 10.3. Market Analysis, Insights and Forecast - by Deployment
- 10.3.1. Cloud
- 10.3.2. On-premise
- 10.4. Market Analysis, Insights and Forecast - by End-user Vertical
- 10.4.1. BFSI
- 10.4.2. IT and Telecommunication
- 10.4.3. Healthcare
- 10.4.4. Retail
- 10.4.5. Energy and Utilities
- 10.4.6. Manufacturing
- 10.4.7. Other End-user Verticals
- 10.1. Market Analysis, Insights and Forecast - by Solution
- 11. North America Embedded Analytics Solutions Market Analysis, Insights and Forecast, 2019-2031
- 11.1. Market Analysis, Insights and Forecast - By Country/Sub-region
- 11.1.1 United States
- 11.1.2 Canada
- 11.1.3 Mexico
- 12. Europe Embedded Analytics Solutions Market Analysis, Insights and Forecast, 2019-2031
- 12.1. Market Analysis, Insights and Forecast - By Country/Sub-region
- 12.1.1 Germany
- 12.1.2 United Kingdom
- 12.1.3 France
- 12.1.4 Spain
- 12.1.5 Italy
- 12.1.6 Spain
- 12.1.7 Belgium
- 12.1.8 Netherland
- 12.1.9 Nordics
- 12.1.10 Rest of Europe
- 13. Asia Pacific Embedded Analytics Solutions Market Analysis, Insights and Forecast, 2019-2031
- 13.1. Market Analysis, Insights and Forecast - By Country/Sub-region
- 13.1.1 China
- 13.1.2 Japan
- 13.1.3 India
- 13.1.4 South Korea
- 13.1.5 Southeast Asia
- 13.1.6 Australia
- 13.1.7 Indonesia
- 13.1.8 Phillipes
- 13.1.9 Singapore
- 13.1.10 Thailandc
- 13.1.11 Rest of Asia Pacific
- 14. South America Embedded Analytics Solutions Market Analysis, Insights and Forecast, 2019-2031
- 14.1. Market Analysis, Insights and Forecast - By Country/Sub-region
- 14.1.1 Brazil
- 14.1.2 Argentina
- 14.1.3 Peru
- 14.1.4 Chile
- 14.1.5 Colombia
- 14.1.6 Ecuador
- 14.1.7 Venezuela
- 14.1.8 Rest of South America
- 15. North America Embedded Analytics Solutions Market Analysis, Insights and Forecast, 2019-2031
- 15.1. Market Analysis, Insights and Forecast - By Country/Sub-region
- 15.1.1 United States
- 15.1.2 Canada
- 15.1.3 Mexico
- 16. MEA Embedded Analytics Solutions Market Analysis, Insights and Forecast, 2019-2031
- 16.1. Market Analysis, Insights and Forecast - By Country/Sub-region
- 16.1.1 United Arab Emirates
- 16.1.2 Saudi Arabia
- 16.1.3 South Africa
- 16.1.4 Rest of Middle East and Africa
- 17. Competitive Analysis
- 17.1. Global Market Share Analysis 2024
- 17.2. Company Profiles
- 17.2.1 SAS Institute Inc
- 17.2.1.1. Overview
- 17.2.1.2. Products
- 17.2.1.3. SWOT Analysis
- 17.2.1.4. Recent Developments
- 17.2.1.5. Financials (Based on Availability)
- 17.2.2 Yellowfin International Pty Ltd
- 17.2.2.1. Overview
- 17.2.2.2. Products
- 17.2.2.3. SWOT Analysis
- 17.2.2.4. Recent Developments
- 17.2.2.5. Financials (Based on Availability)
- 17.2.3 Vertica Systems Inc (HPE)
- 17.2.3.1. Overview
- 17.2.3.2. Products
- 17.2.3.3. SWOT Analysis
- 17.2.3.4. Recent Developments
- 17.2.3.5. Financials (Based on Availability)
- 17.2.4 TIBCO Software Inc
- 17.2.4.1. Overview
- 17.2.4.2. Products
- 17.2.4.3. SWOT Analysis
- 17.2.4.4. Recent Developments
- 17.2.4.5. Financials (Based on Availability)
- 17.2.5 OpenText Corp
- 17.2.5.1. Overview
- 17.2.5.2. Products
- 17.2.5.3. SWOT Analysis
- 17.2.5.4. Recent Developments
- 17.2.5.5. Financials (Based on Availability)
- 17.2.6 IBM Corporation
- 17.2.6.1. Overview
- 17.2.6.2. Products
- 17.2.6.3. SWOT Analysis
- 17.2.6.4. Recent Developments
- 17.2.6.5. Financials (Based on Availability)
- 17.2.7 WNS Global Services SA (Pty) Ltd
- 17.2.7.1. Overview
- 17.2.7.2. Products
- 17.2.7.3. SWOT Analysis
- 17.2.7.4. Recent Developments
- 17.2.7.5. Financials (Based on Availability)
- 17.2.8 Information Builders Inc
- 17.2.8.1. Overview
- 17.2.8.2. Products
- 17.2.8.3. SWOT Analysis
- 17.2.8.4. Recent Developments
- 17.2.8.5. Financials (Based on Availability)
- 17.2.9 MicroStrategy Incorporated
- 17.2.9.1. Overview
- 17.2.9.2. Products
- 17.2.9.3. SWOT Analysis
- 17.2.9.4. Recent Developments
- 17.2.9.5. Financials (Based on Availability)
- 17.2.10 GoodData Corporation
- 17.2.10.1. Overview
- 17.2.10.2. Products
- 17.2.10.3. SWOT Analysis
- 17.2.10.4. Recent Developments
- 17.2.10.5. Financials (Based on Availability)
- 17.2.11 Microsoft Corporation
- 17.2.11.1. Overview
- 17.2.11.2. Products
- 17.2.11.3. SWOT Analysis
- 17.2.11.4. Recent Developments
- 17.2.11.5. Financials (Based on Availability)
- 17.2.12 QlikTech International AB
- 17.2.12.1. Overview
- 17.2.12.2. Products
- 17.2.12.3. SWOT Analysis
- 17.2.12.4. Recent Developments
- 17.2.12.5. Financials (Based on Availability)
- 17.2.13 Birst Inc (Infor Inc )
- 17.2.13.1. Overview
- 17.2.13.2. Products
- 17.2.13.3. SWOT Analysis
- 17.2.13.4. Recent Developments
- 17.2.13.5. Financials (Based on Availability)
- 17.2.14 Tableau Software (Sales Force Inc )
- 17.2.14.1. Overview
- 17.2.14.2. Products
- 17.2.14.3. SWOT Analysis
- 17.2.14.4. Recent Developments
- 17.2.14.5. Financials (Based on Availability)
- 17.2.15 Oracle Corporation
- 17.2.15.1. Overview
- 17.2.15.2. Products
- 17.2.15.3. SWOT Analysis
- 17.2.15.4. Recent Developments
- 17.2.15.5. Financials (Based on Availability)
- 17.2.16 Logi Analytics Inc
- 17.2.16.1. Overview
- 17.2.16.2. Products
- 17.2.16.3. SWOT Analysis
- 17.2.16.4. Recent Developments
- 17.2.16.5. Financials (Based on Availability)
- 17.2.17 Sisense Inc
- 17.2.17.1. Overview
- 17.2.17.2. Products
- 17.2.17.3. SWOT Analysis
- 17.2.17.4. Recent Developments
- 17.2.17.5. Financials (Based on Availability)
- 17.2.18 Izenda Inc
- 17.2.18.1. Overview
- 17.2.18.2. Products
- 17.2.18.3. SWOT Analysis
- 17.2.18.4. Recent Developments
- 17.2.18.5. Financials (Based on Availability)
- 17.2.19 Exago Inc *List Not Exhaustive
- 17.2.19.1. Overview
- 17.2.19.2. Products
- 17.2.19.3. SWOT Analysis
- 17.2.19.4. Recent Developments
- 17.2.19.5. Financials (Based on Availability)
- 17.2.20 SAP SE
- 17.2.20.1. Overview
- 17.2.20.2. Products
- 17.2.20.3. SWOT Analysis
- 17.2.20.4. Recent Developments
- 17.2.20.5. Financials (Based on Availability)
- 17.2.1 SAS Institute Inc
List of Figures
- Figure 1: Global Embedded Analytics Solutions Market Revenue Breakdown (Million, %) by Region 2024 & 2032
- Figure 2: North America Embedded Analytics Solutions Market Revenue (Million), by Country 2024 & 2032
- Figure 3: North America Embedded Analytics Solutions Market Revenue Share (%), by Country 2024 & 2032
- Figure 4: Europe Embedded Analytics Solutions Market Revenue (Million), by Country 2024 & 2032
- Figure 5: Europe Embedded Analytics Solutions Market Revenue Share (%), by Country 2024 & 2032
- Figure 6: Asia Pacific Embedded Analytics Solutions Market Revenue (Million), by Country 2024 & 2032
- Figure 7: Asia Pacific Embedded Analytics Solutions Market Revenue Share (%), by Country 2024 & 2032
- Figure 8: South America Embedded Analytics Solutions Market Revenue (Million), by Country 2024 & 2032
- Figure 9: South America Embedded Analytics Solutions Market Revenue Share (%), by Country 2024 & 2032
- Figure 10: North America Embedded Analytics Solutions Market Revenue (Million), by Country 2024 & 2032
- Figure 11: North America Embedded Analytics Solutions Market Revenue Share (%), by Country 2024 & 2032
- Figure 12: MEA Embedded Analytics Solutions Market Revenue (Million), by Country 2024 & 2032
- Figure 13: MEA Embedded Analytics Solutions Market Revenue Share (%), by Country 2024 & 2032
- Figure 14: North America Embedded Analytics Solutions Market Revenue (Million), by Solution 2024 & 2032
- Figure 15: North America Embedded Analytics Solutions Market Revenue Share (%), by Solution 2024 & 2032
- Figure 16: North America Embedded Analytics Solutions Market Revenue (Million), by Size of Organisation 2024 & 2032
- Figure 17: North America Embedded Analytics Solutions Market Revenue Share (%), by Size of Organisation 2024 & 2032
- Figure 18: North America Embedded Analytics Solutions Market Revenue (Million), by Deployment 2024 & 2032
- Figure 19: North America Embedded Analytics Solutions Market Revenue Share (%), by Deployment 2024 & 2032
- Figure 20: North America Embedded Analytics Solutions Market Revenue (Million), by End-user Vertical 2024 & 2032
- Figure 21: North America Embedded Analytics Solutions Market Revenue Share (%), by End-user Vertical 2024 & 2032
- Figure 22: North America Embedded Analytics Solutions Market Revenue (Million), by Country 2024 & 2032
- Figure 23: North America Embedded Analytics Solutions Market Revenue Share (%), by Country 2024 & 2032
- Figure 24: Europe Embedded Analytics Solutions Market Revenue (Million), by Solution 2024 & 2032
- Figure 25: Europe Embedded Analytics Solutions Market Revenue Share (%), by Solution 2024 & 2032
- Figure 26: Europe Embedded Analytics Solutions Market Revenue (Million), by Size of Organisation 2024 & 2032
- Figure 27: Europe Embedded Analytics Solutions Market Revenue Share (%), by Size of Organisation 2024 & 2032
- Figure 28: Europe Embedded Analytics Solutions Market Revenue (Million), by Deployment 2024 & 2032
- Figure 29: Europe Embedded Analytics Solutions Market Revenue Share (%), by Deployment 2024 & 2032
- Figure 30: Europe Embedded Analytics Solutions Market Revenue (Million), by End-user Vertical 2024 & 2032
- Figure 31: Europe Embedded Analytics Solutions Market Revenue Share (%), by End-user Vertical 2024 & 2032
- Figure 32: Europe Embedded Analytics Solutions Market Revenue (Million), by Country 2024 & 2032
- Figure 33: Europe Embedded Analytics Solutions Market Revenue Share (%), by Country 2024 & 2032
- Figure 34: Asia Pacific Embedded Analytics Solutions Market Revenue (Million), by Solution 2024 & 2032
- Figure 35: Asia Pacific Embedded Analytics Solutions Market Revenue Share (%), by Solution 2024 & 2032
- Figure 36: Asia Pacific Embedded Analytics Solutions Market Revenue (Million), by Size of Organisation 2024 & 2032
- Figure 37: Asia Pacific Embedded Analytics Solutions Market Revenue Share (%), by Size of Organisation 2024 & 2032
- Figure 38: Asia Pacific Embedded Analytics Solutions Market Revenue (Million), by Deployment 2024 & 2032
- Figure 39: Asia Pacific Embedded Analytics Solutions Market Revenue Share (%), by Deployment 2024 & 2032
- Figure 40: Asia Pacific Embedded Analytics Solutions Market Revenue (Million), by End-user Vertical 2024 & 2032
- Figure 41: Asia Pacific Embedded Analytics Solutions Market Revenue Share (%), by End-user Vertical 2024 & 2032
- Figure 42: Asia Pacific Embedded Analytics Solutions Market Revenue (Million), by Country 2024 & 2032
- Figure 43: Asia Pacific Embedded Analytics Solutions Market Revenue Share (%), by Country 2024 & 2032
- Figure 44: Latin America Embedded Analytics Solutions Market Revenue (Million), by Solution 2024 & 2032
- Figure 45: Latin America Embedded Analytics Solutions Market Revenue Share (%), by Solution 2024 & 2032
- Figure 46: Latin America Embedded Analytics Solutions Market Revenue (Million), by Size of Organisation 2024 & 2032
- Figure 47: Latin America Embedded Analytics Solutions Market Revenue Share (%), by Size of Organisation 2024 & 2032
- Figure 48: Latin America Embedded Analytics Solutions Market Revenue (Million), by Deployment 2024 & 2032
- Figure 49: Latin America Embedded Analytics Solutions Market Revenue Share (%), by Deployment 2024 & 2032
- Figure 50: Latin America Embedded Analytics Solutions Market Revenue (Million), by End-user Vertical 2024 & 2032
- Figure 51: Latin America Embedded Analytics Solutions Market Revenue Share (%), by End-user Vertical 2024 & 2032
- Figure 52: Latin America Embedded Analytics Solutions Market Revenue (Million), by Country 2024 & 2032
- Figure 53: Latin America Embedded Analytics Solutions Market Revenue Share (%), by Country 2024 & 2032
- Figure 54: Middle East and Africa Embedded Analytics Solutions Market Revenue (Million), by Solution 2024 & 2032
- Figure 55: Middle East and Africa Embedded Analytics Solutions Market Revenue Share (%), by Solution 2024 & 2032
- Figure 56: Middle East and Africa Embedded Analytics Solutions Market Revenue (Million), by Size of Organisation 2024 & 2032
- Figure 57: Middle East and Africa Embedded Analytics Solutions Market Revenue Share (%), by Size of Organisation 2024 & 2032
- Figure 58: Middle East and Africa Embedded Analytics Solutions Market Revenue (Million), by Deployment 2024 & 2032
- Figure 59: Middle East and Africa Embedded Analytics Solutions Market Revenue Share (%), by Deployment 2024 & 2032
- Figure 60: Middle East and Africa Embedded Analytics Solutions Market Revenue (Million), by End-user Vertical 2024 & 2032
- Figure 61: Middle East and Africa Embedded Analytics Solutions Market Revenue Share (%), by End-user Vertical 2024 & 2032
- Figure 62: Middle East and Africa Embedded Analytics Solutions Market Revenue (Million), by Country 2024 & 2032
- Figure 63: Middle East and Africa Embedded Analytics Solutions Market Revenue Share (%), by Country 2024 & 2032
List of Tables
- Table 1: Global Embedded Analytics Solutions Market Revenue Million Forecast, by Region 2019 & 2032
- Table 2: Global Embedded Analytics Solutions Market Revenue Million Forecast, by Solution 2019 & 2032
- Table 3: Global Embedded Analytics Solutions Market Revenue Million Forecast, by Size of Organisation 2019 & 2032
- Table 4: Global Embedded Analytics Solutions Market Revenue Million Forecast, by Deployment 2019 & 2032
- Table 5: Global Embedded Analytics Solutions Market Revenue Million Forecast, by End-user Vertical 2019 & 2032
- Table 6: Global Embedded Analytics Solutions Market Revenue Million Forecast, by Region 2019 & 2032
- Table 7: Global Embedded Analytics Solutions Market Revenue Million Forecast, by Country 2019 & 2032
- Table 8: United States Embedded Analytics Solutions Market Revenue (Million) Forecast, by Application 2019 & 2032
- Table 9: Canada Embedded Analytics Solutions Market Revenue (Million) Forecast, by Application 2019 & 2032
- Table 10: Mexico Embedded Analytics Solutions Market Revenue (Million) Forecast, by Application 2019 & 2032
- Table 11: Global Embedded Analytics Solutions Market Revenue Million Forecast, by Country 2019 & 2032
- Table 12: Germany Embedded Analytics Solutions Market Revenue (Million) Forecast, by Application 2019 & 2032
- Table 13: United Kingdom Embedded Analytics Solutions Market Revenue (Million) Forecast, by Application 2019 & 2032
- Table 14: France Embedded Analytics Solutions Market Revenue (Million) Forecast, by Application 2019 & 2032
- Table 15: Spain Embedded Analytics Solutions Market Revenue (Million) Forecast, by Application 2019 & 2032
- Table 16: Italy Embedded Analytics Solutions Market Revenue (Million) Forecast, by Application 2019 & 2032
- Table 17: Spain Embedded Analytics Solutions Market Revenue (Million) Forecast, by Application 2019 & 2032
- Table 18: Belgium Embedded Analytics Solutions Market Revenue (Million) Forecast, by Application 2019 & 2032
- Table 19: Netherland Embedded Analytics Solutions Market Revenue (Million) Forecast, by Application 2019 & 2032
- Table 20: Nordics Embedded Analytics Solutions Market Revenue (Million) Forecast, by Application 2019 & 2032
- Table 21: Rest of Europe Embedded Analytics Solutions Market Revenue (Million) Forecast, by Application 2019 & 2032
- Table 22: Global Embedded Analytics Solutions Market Revenue Million Forecast, by Country 2019 & 2032
- Table 23: China Embedded Analytics Solutions Market Revenue (Million) Forecast, by Application 2019 & 2032
- Table 24: Japan Embedded Analytics Solutions Market Revenue (Million) Forecast, by Application 2019 & 2032
- Table 25: India Embedded Analytics Solutions Market Revenue (Million) Forecast, by Application 2019 & 2032
- Table 26: South Korea Embedded Analytics Solutions Market Revenue (Million) Forecast, by Application 2019 & 2032
- Table 27: Southeast Asia Embedded Analytics Solutions Market Revenue (Million) Forecast, by Application 2019 & 2032
- Table 28: Australia Embedded Analytics Solutions Market Revenue (Million) Forecast, by Application 2019 & 2032
- Table 29: Indonesia Embedded Analytics Solutions Market Revenue (Million) Forecast, by Application 2019 & 2032
- Table 30: Phillipes Embedded Analytics Solutions Market Revenue (Million) Forecast, by Application 2019 & 2032
- Table 31: Singapore Embedded Analytics Solutions Market Revenue (Million) Forecast, by Application 2019 & 2032
- Table 32: Thailandc Embedded Analytics Solutions Market Revenue (Million) Forecast, by Application 2019 & 2032
- Table 33: Rest of Asia Pacific Embedded Analytics Solutions Market Revenue (Million) Forecast, by Application 2019 & 2032
- Table 34: Global Embedded Analytics Solutions Market Revenue Million Forecast, by Country 2019 & 2032
- Table 35: Brazil Embedded Analytics Solutions Market Revenue (Million) Forecast, by Application 2019 & 2032
- Table 36: Argentina Embedded Analytics Solutions Market Revenue (Million) Forecast, by Application 2019 & 2032
- Table 37: Peru Embedded Analytics Solutions Market Revenue (Million) Forecast, by Application 2019 & 2032
- Table 38: Chile Embedded Analytics Solutions Market Revenue (Million) Forecast, by Application 2019 & 2032
- Table 39: Colombia Embedded Analytics Solutions Market Revenue (Million) Forecast, by Application 2019 & 2032
- Table 40: Ecuador Embedded Analytics Solutions Market Revenue (Million) Forecast, by Application 2019 & 2032
- Table 41: Venezuela Embedded Analytics Solutions Market Revenue (Million) Forecast, by Application 2019 & 2032
- Table 42: Rest of South America Embedded Analytics Solutions Market Revenue (Million) Forecast, by Application 2019 & 2032
- Table 43: Global Embedded Analytics Solutions Market Revenue Million Forecast, by Country 2019 & 2032
- Table 44: United States Embedded Analytics Solutions Market Revenue (Million) Forecast, by Application 2019 & 2032
- Table 45: Canada Embedded Analytics Solutions Market Revenue (Million) Forecast, by Application 2019 & 2032
- Table 46: Mexico Embedded Analytics Solutions Market Revenue (Million) Forecast, by Application 2019 & 2032
- Table 47: Global Embedded Analytics Solutions Market Revenue Million Forecast, by Country 2019 & 2032
- Table 48: United Arab Emirates Embedded Analytics Solutions Market Revenue (Million) Forecast, by Application 2019 & 2032
- Table 49: Saudi Arabia Embedded Analytics Solutions Market Revenue (Million) Forecast, by Application 2019 & 2032
- Table 50: South Africa Embedded Analytics Solutions Market Revenue (Million) Forecast, by Application 2019 & 2032
- Table 51: Rest of Middle East and Africa Embedded Analytics Solutions Market Revenue (Million) Forecast, by Application 2019 & 2032
- Table 52: Global Embedded Analytics Solutions Market Revenue Million Forecast, by Solution 2019 & 2032
- Table 53: Global Embedded Analytics Solutions Market Revenue Million Forecast, by Size of Organisation 2019 & 2032
- Table 54: Global Embedded Analytics Solutions Market Revenue Million Forecast, by Deployment 2019 & 2032
- Table 55: Global Embedded Analytics Solutions Market Revenue Million Forecast, by End-user Vertical 2019 & 2032
- Table 56: Global Embedded Analytics Solutions Market Revenue Million Forecast, by Country 2019 & 2032
- Table 57: Global Embedded Analytics Solutions Market Revenue Million Forecast, by Solution 2019 & 2032
- Table 58: Global Embedded Analytics Solutions Market Revenue Million Forecast, by Size of Organisation 2019 & 2032
- Table 59: Global Embedded Analytics Solutions Market Revenue Million Forecast, by Deployment 2019 & 2032
- Table 60: Global Embedded Analytics Solutions Market Revenue Million Forecast, by End-user Vertical 2019 & 2032
- Table 61: Global Embedded Analytics Solutions Market Revenue Million Forecast, by Country 2019 & 2032
- Table 62: Global Embedded Analytics Solutions Market Revenue Million Forecast, by Solution 2019 & 2032
- Table 63: Global Embedded Analytics Solutions Market Revenue Million Forecast, by Size of Organisation 2019 & 2032
- Table 64: Global Embedded Analytics Solutions Market Revenue Million Forecast, by Deployment 2019 & 2032
- Table 65: Global Embedded Analytics Solutions Market Revenue Million Forecast, by End-user Vertical 2019 & 2032
- Table 66: Global Embedded Analytics Solutions Market Revenue Million Forecast, by Country 2019 & 2032
- Table 67: Global Embedded Analytics Solutions Market Revenue Million Forecast, by Solution 2019 & 2032
- Table 68: Global Embedded Analytics Solutions Market Revenue Million Forecast, by Size of Organisation 2019 & 2032
- Table 69: Global Embedded Analytics Solutions Market Revenue Million Forecast, by Deployment 2019 & 2032
- Table 70: Global Embedded Analytics Solutions Market Revenue Million Forecast, by End-user Vertical 2019 & 2032
- Table 71: Global Embedded Analytics Solutions Market Revenue Million Forecast, by Country 2019 & 2032
- Table 72: Global Embedded Analytics Solutions Market Revenue Million Forecast, by Solution 2019 & 2032
- Table 73: Global Embedded Analytics Solutions Market Revenue Million Forecast, by Size of Organisation 2019 & 2032
- Table 74: Global Embedded Analytics Solutions Market Revenue Million Forecast, by Deployment 2019 & 2032
- Table 75: Global Embedded Analytics Solutions Market Revenue Million Forecast, by End-user Vertical 2019 & 2032
- Table 76: Global Embedded Analytics Solutions Market Revenue Million Forecast, by Country 2019 & 2032
Frequently Asked Questions
1. What is the projected Compound Annual Growth Rate (CAGR) of the Embedded Analytics Solutions Market?
The projected CAGR is approximately 13.90%.
2. Which companies are prominent players in the Embedded Analytics Solutions Market?
Key companies in the market include SAS Institute Inc, Yellowfin International Pty Ltd, Vertica Systems Inc (HPE), TIBCO Software Inc, OpenText Corp, IBM Corporation, WNS Global Services SA (Pty) Ltd, Information Builders Inc, MicroStrategy Incorporated, GoodData Corporation, Microsoft Corporation, QlikTech International AB, Birst Inc (Infor Inc ), Tableau Software (Sales Force Inc ), Oracle Corporation, Logi Analytics Inc, Sisense Inc, Izenda Inc, Exago Inc *List Not Exhaustive, SAP SE.
3. What are the main segments of the Embedded Analytics Solutions Market?
The market segments include Solution, Size of Organisation, Deployment, End-user Vertical.
4. Can you provide details about the market size?
The market size is estimated to be USD 68.88 Million as of 2022.
5. What are some drivers contributing to market growth?
Increasing Demand for Advanced Analytical Techniques for Business Data; Increasing number of Data Driven Organizations; Increasing Adoption of Mobile BI and Big Data Analytics; Increasing Use of Mobile Devices and Cloud Computing Technologies.
6. What are the notable trends driving market growth?
Increasing Use of Mobile Devices and Cloud Computing Technologies to Witness Significant Growth.
7. Are there any restraints impacting market growth?
Licensing Challenges and Higher Associated Costs.
8. Can you provide examples of recent developments in the market?
August 2022 - SAS and SingleStore have announced a collaboration to help organizations remove barriers to data access, maximize performance and scalability, and uncover key data-driven insights. SAS Viya with SingleStore enables the use of SAS analytics and AI technology on data stored in SingleStore's cloud-native real-time database. The integration provides flexible, open access to curated data to help accelerate value for cloud, hybrid, and on-premises deployments.
9. What pricing options are available for accessing the report?
Pricing options include single-user, multi-user, and enterprise licenses priced at USD 4750, USD 5250, and USD 8750 respectively.
10. Is the market size provided in terms of value or volume?
The market size is provided in terms of value, measured in Million.
11. Are there any specific market keywords associated with the report?
Yes, the market keyword associated with the report is "Embedded Analytics Solutions Market," which aids in identifying and referencing the specific market segment covered.
12. How do I determine which pricing option suits my needs best?
The pricing options vary based on user requirements and access needs. Individual users may opt for single-user licenses, while businesses requiring broader access may choose multi-user or enterprise licenses for cost-effective access to the report.
13. Are there any additional resources or data provided in the Embedded Analytics Solutions Market report?
While the report offers comprehensive insights, it's advisable to review the specific contents or supplementary materials provided to ascertain if additional resources or data are available.
14. How can I stay updated on further developments or reports in the Embedded Analytics Solutions Market?
To stay informed about further developments, trends, and reports in the Embedded Analytics Solutions Market, consider subscribing to industry newsletters, following relevant companies and organizations, or regularly checking reputable industry news sources and publications.
Methodology
Step 1 - Identification of Relevant Samples Size from Population Database


Step 2 - Approaches for Defining Global Market Size (Value, Volume* & Price*)

Note*: In applicable scenarios
Step 3 - Data Sources
Primary Research
- Web Analytics
- Survey Reports
- Research Institute
- Latest Research Reports
- Opinion Leaders
Secondary Research
- Annual Reports
- White Paper
- Latest Press Release
- Industry Association
- Paid Database
- Investor Presentations

Step 4 - Data Triangulation
Involves using different sources of information in order to increase the validity of a study
These sources are likely to be stakeholders in a program - participants, other researchers, program staff, other community members, and so on.
Then we put all data in single framework & apply various statistical tools to find out the dynamic on the market.
During the analysis stage, feedback from the stakeholder groups would be compared to determine areas of agreement as well as areas of divergence


