
Key Insights
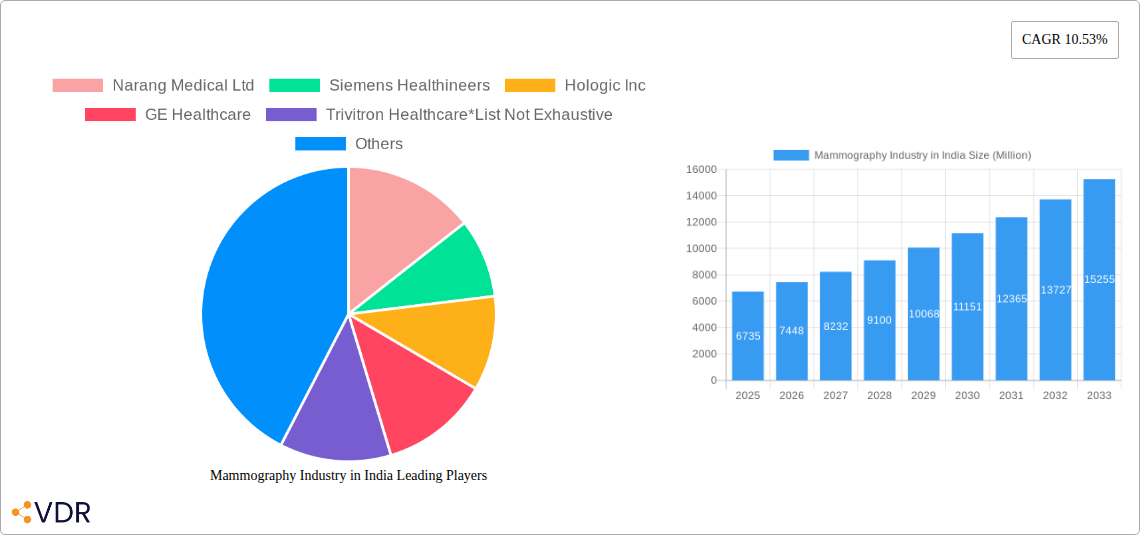
The Indian mammography market, valued at ₹67.35 billion (approximately $8.2 billion USD assuming an exchange rate of ₹82 per USD) in 2025, is poised for robust growth, exhibiting a Compound Annual Growth Rate (CAGR) of 10.53% from 2025 to 2033. This expansion is driven by several factors. Rising prevalence of breast cancer, increasing awareness about early detection and screening, and improvements in healthcare infrastructure are key contributors. Technological advancements, such as the adoption of digital mammography and breast tomosynthesis, offering superior image quality and reduced radiation exposure, are further fueling market growth. The expanding network of hospitals, specialty clinics, and diagnostic centers across India, particularly in urban areas, provides a wider reach for mammography services. However, factors like high equipment costs, limited access to advanced technologies in rural regions, and a shortage of trained radiologists pose challenges to market penetration. The market segmentation reveals a preference for digital systems over analog, reflecting the ongoing technological shift. Hospitals constitute the largest end-user segment, signifying the crucial role of institutional healthcare in driving market demand. Companies like Siemens Healthineers, Hologic Inc., and GE Healthcare are major players, competing based on technological innovation, service offerings, and distribution networks. Future growth will likely be influenced by government initiatives to improve healthcare access, affordability of mammography services, and further technological developments. The increasing affordability of these services and rising awareness among women is also playing an important role.
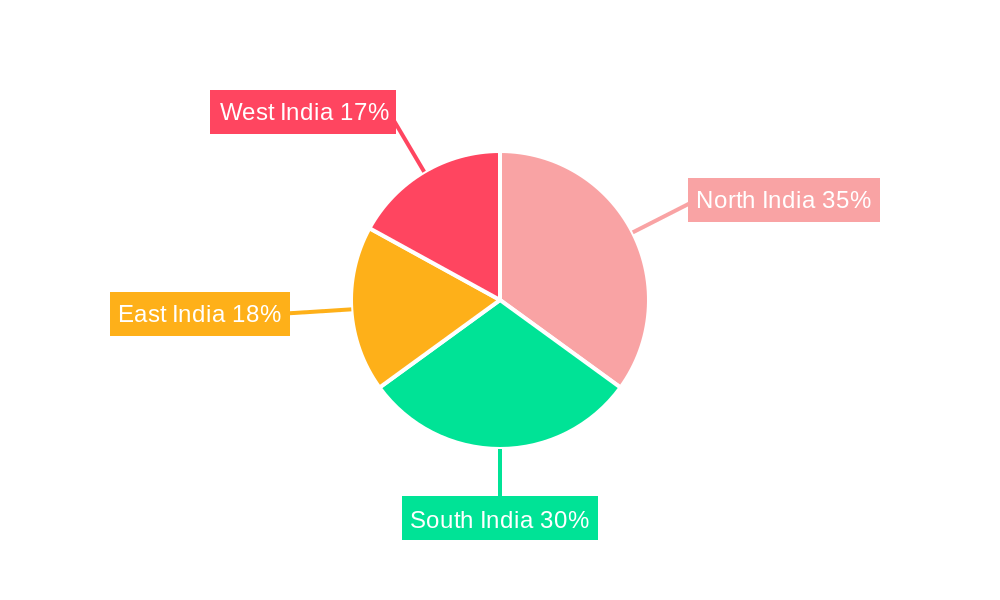
The regional distribution reveals significant variations in market penetration across India's diverse regions. While North and South India likely represent the largest market shares due to higher population density and greater healthcare infrastructure, East and West India offer substantial growth potential as awareness and access to healthcare services improve. Further market analysis indicates the consistent adoption of new technologies and a demand for technologically enhanced systems is expected in this sector. The forecast period of 2025-2033 suggests a promising future for the Indian mammography market, driven by a combination of technological advancements and a growing need for early cancer detection. Market expansion and the continued growth of the existing players are expected to significantly impact the market in the coming years.
Mammography Industry in India: A Comprehensive Market Report (2019-2033)
This in-depth report provides a comprehensive analysis of the Mammography Industry in India, covering market dynamics, growth trends, key players, and future outlook. With a study period spanning 2019-2033, a base year of 2025, and a forecast period of 2025-2033, this report is an essential resource for industry professionals, investors, and strategic decision-makers. The report utilizes data in Million Units.
Mammography Industry in India Market Dynamics & Structure
The Indian mammography market is experiencing significant growth driven by rising breast cancer incidence, increasing healthcare expenditure, and government initiatives promoting early detection. Market concentration is moderate, with a mix of multinational and domestic players. Technological innovation, particularly in digital mammography and tomosynthesis, is a key driver, while regulatory frameworks (e.g., licensing, quality standards) influence market access. Competitive substitutes include ultrasound and MRI, but mammography remains the gold standard for breast cancer screening. End-user demographics are shifting towards a larger proportion of women in higher age brackets and urban settings. M&A activity has been relatively limited (xx deals in the last 5 years), indicating a focus on organic growth among key players.
- Market Concentration: Moderately concentrated, with top 5 players holding approximately xx% market share (2024).
- Technological Innovation: Focus on digital mammography, tomosynthesis, and AI-powered image analysis.
- Regulatory Framework: Stringent licensing and quality control measures impact market entry.
- Competitive Substitutes: Ultrasound and MRI offer alternative breast imaging modalities.
- End-User Demographics: Growing prevalence of breast cancer in women aged 40-60, predominantly in urban areas.
- M&A Trends: Limited M&A activity, with a focus on organic growth strategies.
Mammography Industry in India Growth Trends & Insights
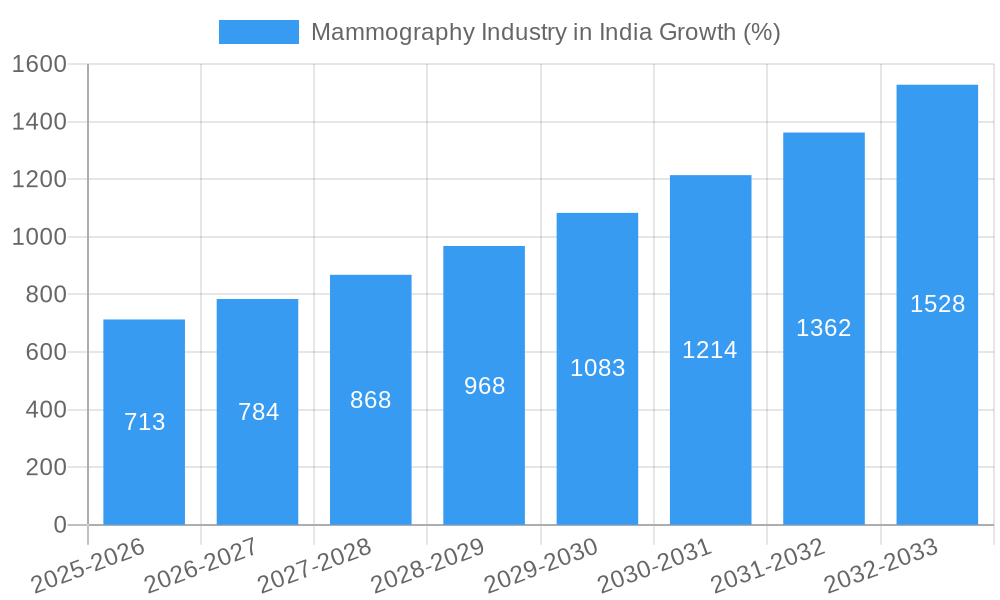
The Indian mammography market exhibited robust growth during the historical period (2019-2024), with a CAGR of xx%. This growth is attributed to factors such as rising awareness about breast cancer, increasing affordability of diagnostic services, and government initiatives promoting preventative healthcare. Market penetration remains relatively low compared to developed nations, offering significant potential for future expansion. Technological disruptions, particularly the adoption of digital mammography and tomosynthesis, are driving improvements in image quality, diagnostic accuracy, and workflow efficiency. Consumer behavior is shifting towards preference for advanced imaging technologies and convenient access to screening services. The estimated market size in 2025 is xx Million Units, projected to reach xx Million Units by 2033, with a CAGR of xx%.
Dominant Regions, Countries, or Segments in Mammography Industry in India
The metropolitan cities of Mumbai, Delhi, Bengaluru, and Chennai lead the Indian mammography market due to higher healthcare infrastructure, skilled professionals, and greater awareness. Among product types, digital mammography systems dominate (xx% market share in 2024), fueled by superior image quality and diagnostic capabilities. Hospitals constitute the largest end-user segment (xx% market share in 2024), followed by diagnostic centers and specialty clinics.
- Key Drivers:
- Rising prevalence of breast cancer.
- Government initiatives promoting early detection.
- Growing disposable incomes and health insurance coverage.
- Development of healthcare infrastructure in urban areas.
- Dominance Factors:
- Higher concentration of healthcare facilities.
- Higher awareness levels.
- Greater access to advanced technologies.
Mammography Industry in India Product Landscape
The Indian mammography market showcases a diverse product landscape, encompassing digital systems, analog systems, breast tomosynthesis systems, and other specialized products. Digital systems offer superior image quality and efficient workflow, while tomosynthesis provides improved lesion detection and reduced recall rates. Continuous innovation is focusing on enhancing image quality, reducing radiation dose, and integrating AI-powered diagnostic tools. Key selling points include ease of use, high diagnostic accuracy, and compact designs tailored to resource-constrained settings.
Key Drivers, Barriers & Challenges in Mammography Industry in India
Key Drivers: Rising breast cancer incidence, government initiatives promoting early detection, technological advancements, and increasing healthcare expenditure. For instance, the Indian government's National Health Policy emphasizes the importance of preventative healthcare, driving demand for mammography services.
Challenges: High initial investment costs for advanced systems, limited access to quality healthcare in rural areas, lack of trained radiologists, and stringent regulatory approvals. The shortage of skilled radiologists impacts service capacity and creates a bottleneck in timely diagnosis.
Emerging Opportunities in Mammography Industry in India
Untapped potential lies in expanding access to mammography services in rural and underserved areas. Mobile mammography units and tele-radiology platforms can address geographical barriers. Increasing adoption of AI-powered diagnostic tools offers scope for improved accuracy and efficiency. Growing focus on personalized medicine presents opportunities for tailoring screening protocols based on individual risk factors.
Growth Accelerators in the Mammography Industry in India Industry
Technological advancements (e.g., AI-powered image analysis, tomosynthesis), strategic partnerships between equipment manufacturers and healthcare providers, and government initiatives promoting preventative healthcare are key growth catalysts. Expanding access to mammography through public-private partnerships and mobile clinics further accelerates market growth.
Key Players Shaping the Mammography Industry in India Market
- Narang Medical Ltd
- Siemens Healthineers
- Hologic Inc
- GE Healthcare
- Trivitron Healthcare
- Allengers Medical Systems Ltd
- Koninklijke Philips NV
- Canon Medical Systems Corporation
- Planmed Oy
- Carestream Health Inc
- Fujifilm Holdings Corporation
Notable Milestones in Mammography Industry in India Sector
- October 2021: Installation of a mammography device at Mahatma Gandhi Memorial Government Hospital (MGMGH), Trichy, Tamil Nadu. This signifies increased government investment in healthcare infrastructure.
- February 2021: Fujifilm Holdings Corporation launched a medical screening service in India, partnering with Dr. Kutty's Healthcare. This highlights the increasing interest of multinational companies in the Indian market.
In-Depth Mammography Industry in India Market Outlook
The Indian mammography market holds immense potential, driven by increasing awareness, rising healthcare spending, and technological advancements. Strategic partnerships, expansion into underserved regions, and adoption of innovative technologies will drive future growth. The focus will be on improving access, affordability, and diagnostic accuracy, leading to significant market expansion over the forecast period.
Mammography Industry in India Segmentation
-
1. Product Type
- 1.1. Digital Systems
- 1.2. Analog Systems
- 1.3. Breast Tomosynthesis
- 1.4. Other Product Types
-
2. End User
- 2.1. Hospitals
- 2.2. Specialty Clinics
- 2.3. Diagnostic Centers
Mammography Industry in India Segmentation By Geography
-
1. North America
- 1.1. United States
- 1.2. Canada
- 1.3. Mexico
-
2. South America
- 2.1. Brazil
- 2.2. Argentina
- 2.3. Rest of South America
-
3. Europe
- 3.1. United Kingdom
- 3.2. Germany
- 3.3. France
- 3.4. Italy
- 3.5. Spain
- 3.6. Russia
- 3.7. Benelux
- 3.8. Nordics
- 3.9. Rest of Europe
-
4. Middle East & Africa
- 4.1. Turkey
- 4.2. Israel
- 4.3. GCC
- 4.4. North Africa
- 4.5. South Africa
- 4.6. Rest of Middle East & Africa
-
5. Asia Pacific
- 5.1. China
- 5.2. India
- 5.3. Japan
- 5.4. South Korea
- 5.5. ASEAN
- 5.6. Oceania
- 5.7. Rest of Asia Pacific
Mammography Industry in India REPORT HIGHLIGHTS
| Aspects | Details |
|---|---|
| Study Period | 2019-2033 |
| Base Year | 2024 |
| Estimated Year | 2025 |
| Forecast Period | 2025-2033 |
| Historical Period | 2019-2024 |
| Growth Rate | CAGR of 10.53% from 2019-2033 |
| Segmentation |
|
Table of Contents
- 1. Introduction
- 1.1. Research Scope
- 1.2. Market Segmentation
- 1.3. Research Methodology
- 1.4. Definitions and Assumptions
- 2. Executive Summary
- 2.1. Introduction
- 3. Market Dynamics
- 3.1. Introduction
- 3.2. Market Drivers
- 3.2.1. Growing Burden of Breast Cancer; Technological Advancements in the Field of Breast Imaging
- 3.3. Market Restrains
- 3.3.1. Risk of Adverse Effects from Radiation Exposure
- 3.4. Market Trends
- 3.4.1. Specialty Clinics are Expected to Witness Steady Growth
- 4. Market Factor Analysis
- 4.1. Porters Five Forces
- 4.2. Supply/Value Chain
- 4.3. PESTEL analysis
- 4.4. Market Entropy
- 4.5. Patent/Trademark Analysis
- 5. Global Mammography Industry in India Analysis, Insights and Forecast, 2019-2031
- 5.1. Market Analysis, Insights and Forecast - by Product Type
- 5.1.1. Digital Systems
- 5.1.2. Analog Systems
- 5.1.3. Breast Tomosynthesis
- 5.1.4. Other Product Types
- 5.2. Market Analysis, Insights and Forecast - by End User
- 5.2.1. Hospitals
- 5.2.2. Specialty Clinics
- 5.2.3. Diagnostic Centers
- 5.3. Market Analysis, Insights and Forecast - by Region
- 5.3.1. North America
- 5.3.2. South America
- 5.3.3. Europe
- 5.3.4. Middle East & Africa
- 5.3.5. Asia Pacific
- 5.1. Market Analysis, Insights and Forecast - by Product Type
- 6. North America Mammography Industry in India Analysis, Insights and Forecast, 2019-2031
- 6.1. Market Analysis, Insights and Forecast - by Product Type
- 6.1.1. Digital Systems
- 6.1.2. Analog Systems
- 6.1.3. Breast Tomosynthesis
- 6.1.4. Other Product Types
- 6.2. Market Analysis, Insights and Forecast - by End User
- 6.2.1. Hospitals
- 6.2.2. Specialty Clinics
- 6.2.3. Diagnostic Centers
- 6.1. Market Analysis, Insights and Forecast - by Product Type
- 7. South America Mammography Industry in India Analysis, Insights and Forecast, 2019-2031
- 7.1. Market Analysis, Insights and Forecast - by Product Type
- 7.1.1. Digital Systems
- 7.1.2. Analog Systems
- 7.1.3. Breast Tomosynthesis
- 7.1.4. Other Product Types
- 7.2. Market Analysis, Insights and Forecast - by End User
- 7.2.1. Hospitals
- 7.2.2. Specialty Clinics
- 7.2.3. Diagnostic Centers
- 7.1. Market Analysis, Insights and Forecast - by Product Type
- 8. Europe Mammography Industry in India Analysis, Insights and Forecast, 2019-2031
- 8.1. Market Analysis, Insights and Forecast - by Product Type
- 8.1.1. Digital Systems
- 8.1.2. Analog Systems
- 8.1.3. Breast Tomosynthesis
- 8.1.4. Other Product Types
- 8.2. Market Analysis, Insights and Forecast - by End User
- 8.2.1. Hospitals
- 8.2.2. Specialty Clinics
- 8.2.3. Diagnostic Centers
- 8.1. Market Analysis, Insights and Forecast - by Product Type
- 9. Middle East & Africa Mammography Industry in India Analysis, Insights and Forecast, 2019-2031
- 9.1. Market Analysis, Insights and Forecast - by Product Type
- 9.1.1. Digital Systems
- 9.1.2. Analog Systems
- 9.1.3. Breast Tomosynthesis
- 9.1.4. Other Product Types
- 9.2. Market Analysis, Insights and Forecast - by End User
- 9.2.1. Hospitals
- 9.2.2. Specialty Clinics
- 9.2.3. Diagnostic Centers
- 9.1. Market Analysis, Insights and Forecast - by Product Type
- 10. Asia Pacific Mammography Industry in India Analysis, Insights and Forecast, 2019-2031
- 10.1. Market Analysis, Insights and Forecast - by Product Type
- 10.1.1. Digital Systems
- 10.1.2. Analog Systems
- 10.1.3. Breast Tomosynthesis
- 10.1.4. Other Product Types
- 10.2. Market Analysis, Insights and Forecast - by End User
- 10.2.1. Hospitals
- 10.2.2. Specialty Clinics
- 10.2.3. Diagnostic Centers
- 10.1. Market Analysis, Insights and Forecast - by Product Type
- 11. North India Mammography Industry in India Analysis, Insights and Forecast, 2019-2031
- 12. South India Mammography Industry in India Analysis, Insights and Forecast, 2019-2031
- 13. East India Mammography Industry in India Analysis, Insights and Forecast, 2019-2031
- 14. West India Mammography Industry in India Analysis, Insights and Forecast, 2019-2031
- 15. Competitive Analysis
- 15.1. Global Market Share Analysis 2024
- 15.2. Company Profiles
- 15.2.1 Narang Medical Ltd
- 15.2.1.1. Overview
- 15.2.1.2. Products
- 15.2.1.3. SWOT Analysis
- 15.2.1.4. Recent Developments
- 15.2.1.5. Financials (Based on Availability)
- 15.2.2 Siemens Healthineers
- 15.2.2.1. Overview
- 15.2.2.2. Products
- 15.2.2.3. SWOT Analysis
- 15.2.2.4. Recent Developments
- 15.2.2.5. Financials (Based on Availability)
- 15.2.3 Hologic Inc
- 15.2.3.1. Overview
- 15.2.3.2. Products
- 15.2.3.3. SWOT Analysis
- 15.2.3.4. Recent Developments
- 15.2.3.5. Financials (Based on Availability)
- 15.2.4 GE Healthcare
- 15.2.4.1. Overview
- 15.2.4.2. Products
- 15.2.4.3. SWOT Analysis
- 15.2.4.4. Recent Developments
- 15.2.4.5. Financials (Based on Availability)
- 15.2.5 Trivitron Healthcare*List Not Exhaustive
- 15.2.5.1. Overview
- 15.2.5.2. Products
- 15.2.5.3. SWOT Analysis
- 15.2.5.4. Recent Developments
- 15.2.5.5. Financials (Based on Availability)
- 15.2.6 Allengers Medical Systems Ltd
- 15.2.6.1. Overview
- 15.2.6.2. Products
- 15.2.6.3. SWOT Analysis
- 15.2.6.4. Recent Developments
- 15.2.6.5. Financials (Based on Availability)
- 15.2.7 Koninklijke Philips NV
- 15.2.7.1. Overview
- 15.2.7.2. Products
- 15.2.7.3. SWOT Analysis
- 15.2.7.4. Recent Developments
- 15.2.7.5. Financials (Based on Availability)
- 15.2.8 Canon Medical Systems Corporation
- 15.2.8.1. Overview
- 15.2.8.2. Products
- 15.2.8.3. SWOT Analysis
- 15.2.8.4. Recent Developments
- 15.2.8.5. Financials (Based on Availability)
- 15.2.9 Planmed Oy
- 15.2.9.1. Overview
- 15.2.9.2. Products
- 15.2.9.3. SWOT Analysis
- 15.2.9.4. Recent Developments
- 15.2.9.5. Financials (Based on Availability)
- 15.2.10 Carestream Health Inc
- 15.2.10.1. Overview
- 15.2.10.2. Products
- 15.2.10.3. SWOT Analysis
- 15.2.10.4. Recent Developments
- 15.2.10.5. Financials (Based on Availability)
- 15.2.11 Fujifilm Holdings Corporation
- 15.2.11.1. Overview
- 15.2.11.2. Products
- 15.2.11.3. SWOT Analysis
- 15.2.11.4. Recent Developments
- 15.2.11.5. Financials (Based on Availability)
- 15.2.1 Narang Medical Ltd
List of Figures
- Figure 1: Global Mammography Industry in India Revenue Breakdown (Million, %) by Region 2024 & 2032
- Figure 2: India Mammography Industry in India Revenue (Million), by Country 2024 & 2032
- Figure 3: India Mammography Industry in India Revenue Share (%), by Country 2024 & 2032
- Figure 4: North America Mammography Industry in India Revenue (Million), by Product Type 2024 & 2032
- Figure 5: North America Mammography Industry in India Revenue Share (%), by Product Type 2024 & 2032
- Figure 6: North America Mammography Industry in India Revenue (Million), by End User 2024 & 2032
- Figure 7: North America Mammography Industry in India Revenue Share (%), by End User 2024 & 2032
- Figure 8: North America Mammography Industry in India Revenue (Million), by Country 2024 & 2032
- Figure 9: North America Mammography Industry in India Revenue Share (%), by Country 2024 & 2032
- Figure 10: South America Mammography Industry in India Revenue (Million), by Product Type 2024 & 2032
- Figure 11: South America Mammography Industry in India Revenue Share (%), by Product Type 2024 & 2032
- Figure 12: South America Mammography Industry in India Revenue (Million), by End User 2024 & 2032
- Figure 13: South America Mammography Industry in India Revenue Share (%), by End User 2024 & 2032
- Figure 14: South America Mammography Industry in India Revenue (Million), by Country 2024 & 2032
- Figure 15: South America Mammography Industry in India Revenue Share (%), by Country 2024 & 2032
- Figure 16: Europe Mammography Industry in India Revenue (Million), by Product Type 2024 & 2032
- Figure 17: Europe Mammography Industry in India Revenue Share (%), by Product Type 2024 & 2032
- Figure 18: Europe Mammography Industry in India Revenue (Million), by End User 2024 & 2032
- Figure 19: Europe Mammography Industry in India Revenue Share (%), by End User 2024 & 2032
- Figure 20: Europe Mammography Industry in India Revenue (Million), by Country 2024 & 2032
- Figure 21: Europe Mammography Industry in India Revenue Share (%), by Country 2024 & 2032
- Figure 22: Middle East & Africa Mammography Industry in India Revenue (Million), by Product Type 2024 & 2032
- Figure 23: Middle East & Africa Mammography Industry in India Revenue Share (%), by Product Type 2024 & 2032
- Figure 24: Middle East & Africa Mammography Industry in India Revenue (Million), by End User 2024 & 2032
- Figure 25: Middle East & Africa Mammography Industry in India Revenue Share (%), by End User 2024 & 2032
- Figure 26: Middle East & Africa Mammography Industry in India Revenue (Million), by Country 2024 & 2032
- Figure 27: Middle East & Africa Mammography Industry in India Revenue Share (%), by Country 2024 & 2032
- Figure 28: Asia Pacific Mammography Industry in India Revenue (Million), by Product Type 2024 & 2032
- Figure 29: Asia Pacific Mammography Industry in India Revenue Share (%), by Product Type 2024 & 2032
- Figure 30: Asia Pacific Mammography Industry in India Revenue (Million), by End User 2024 & 2032
- Figure 31: Asia Pacific Mammography Industry in India Revenue Share (%), by End User 2024 & 2032
- Figure 32: Asia Pacific Mammography Industry in India Revenue (Million), by Country 2024 & 2032
- Figure 33: Asia Pacific Mammography Industry in India Revenue Share (%), by Country 2024 & 2032
List of Tables
- Table 1: Global Mammography Industry in India Revenue Million Forecast, by Region 2019 & 2032
- Table 2: Global Mammography Industry in India Revenue Million Forecast, by Product Type 2019 & 2032
- Table 3: Global Mammography Industry in India Revenue Million Forecast, by End User 2019 & 2032
- Table 4: Global Mammography Industry in India Revenue Million Forecast, by Region 2019 & 2032
- Table 5: Global Mammography Industry in India Revenue Million Forecast, by Country 2019 & 2032
- Table 6: North India Mammography Industry in India Revenue (Million) Forecast, by Application 2019 & 2032
- Table 7: South India Mammography Industry in India Revenue (Million) Forecast, by Application 2019 & 2032
- Table 8: East India Mammography Industry in India Revenue (Million) Forecast, by Application 2019 & 2032
- Table 9: West India Mammography Industry in India Revenue (Million) Forecast, by Application 2019 & 2032
- Table 10: Global Mammography Industry in India Revenue Million Forecast, by Product Type 2019 & 2032
- Table 11: Global Mammography Industry in India Revenue Million Forecast, by End User 2019 & 2032
- Table 12: Global Mammography Industry in India Revenue Million Forecast, by Country 2019 & 2032
- Table 13: United States Mammography Industry in India Revenue (Million) Forecast, by Application 2019 & 2032
- Table 14: Canada Mammography Industry in India Revenue (Million) Forecast, by Application 2019 & 2032
- Table 15: Mexico Mammography Industry in India Revenue (Million) Forecast, by Application 2019 & 2032
- Table 16: Global Mammography Industry in India Revenue Million Forecast, by Product Type 2019 & 2032
- Table 17: Global Mammography Industry in India Revenue Million Forecast, by End User 2019 & 2032
- Table 18: Global Mammography Industry in India Revenue Million Forecast, by Country 2019 & 2032
- Table 19: Brazil Mammography Industry in India Revenue (Million) Forecast, by Application 2019 & 2032
- Table 20: Argentina Mammography Industry in India Revenue (Million) Forecast, by Application 2019 & 2032
- Table 21: Rest of South America Mammography Industry in India Revenue (Million) Forecast, by Application 2019 & 2032
- Table 22: Global Mammography Industry in India Revenue Million Forecast, by Product Type 2019 & 2032
- Table 23: Global Mammography Industry in India Revenue Million Forecast, by End User 2019 & 2032
- Table 24: Global Mammography Industry in India Revenue Million Forecast, by Country 2019 & 2032
- Table 25: United Kingdom Mammography Industry in India Revenue (Million) Forecast, by Application 2019 & 2032
- Table 26: Germany Mammography Industry in India Revenue (Million) Forecast, by Application 2019 & 2032
- Table 27: France Mammography Industry in India Revenue (Million) Forecast, by Application 2019 & 2032
- Table 28: Italy Mammography Industry in India Revenue (Million) Forecast, by Application 2019 & 2032
- Table 29: Spain Mammography Industry in India Revenue (Million) Forecast, by Application 2019 & 2032
- Table 30: Russia Mammography Industry in India Revenue (Million) Forecast, by Application 2019 & 2032
- Table 31: Benelux Mammography Industry in India Revenue (Million) Forecast, by Application 2019 & 2032
- Table 32: Nordics Mammography Industry in India Revenue (Million) Forecast, by Application 2019 & 2032
- Table 33: Rest of Europe Mammography Industry in India Revenue (Million) Forecast, by Application 2019 & 2032
- Table 34: Global Mammography Industry in India Revenue Million Forecast, by Product Type 2019 & 2032
- Table 35: Global Mammography Industry in India Revenue Million Forecast, by End User 2019 & 2032
- Table 36: Global Mammography Industry in India Revenue Million Forecast, by Country 2019 & 2032
- Table 37: Turkey Mammography Industry in India Revenue (Million) Forecast, by Application 2019 & 2032
- Table 38: Israel Mammography Industry in India Revenue (Million) Forecast, by Application 2019 & 2032
- Table 39: GCC Mammography Industry in India Revenue (Million) Forecast, by Application 2019 & 2032
- Table 40: North Africa Mammography Industry in India Revenue (Million) Forecast, by Application 2019 & 2032
- Table 41: South Africa Mammography Industry in India Revenue (Million) Forecast, by Application 2019 & 2032
- Table 42: Rest of Middle East & Africa Mammography Industry in India Revenue (Million) Forecast, by Application 2019 & 2032
- Table 43: Global Mammography Industry in India Revenue Million Forecast, by Product Type 2019 & 2032
- Table 44: Global Mammography Industry in India Revenue Million Forecast, by End User 2019 & 2032
- Table 45: Global Mammography Industry in India Revenue Million Forecast, by Country 2019 & 2032
- Table 46: China Mammography Industry in India Revenue (Million) Forecast, by Application 2019 & 2032
- Table 47: India Mammography Industry in India Revenue (Million) Forecast, by Application 2019 & 2032
- Table 48: Japan Mammography Industry in India Revenue (Million) Forecast, by Application 2019 & 2032
- Table 49: South Korea Mammography Industry in India Revenue (Million) Forecast, by Application 2019 & 2032
- Table 50: ASEAN Mammography Industry in India Revenue (Million) Forecast, by Application 2019 & 2032
- Table 51: Oceania Mammography Industry in India Revenue (Million) Forecast, by Application 2019 & 2032
- Table 52: Rest of Asia Pacific Mammography Industry in India Revenue (Million) Forecast, by Application 2019 & 2032
Frequently Asked Questions
1. What is the projected Compound Annual Growth Rate (CAGR) of the Mammography Industry in India?
The projected CAGR is approximately 10.53%.
2. Which companies are prominent players in the Mammography Industry in India?
Key companies in the market include Narang Medical Ltd, Siemens Healthineers, Hologic Inc, GE Healthcare, Trivitron Healthcare*List Not Exhaustive, Allengers Medical Systems Ltd, Koninklijke Philips NV, Canon Medical Systems Corporation, Planmed Oy, Carestream Health Inc, Fujifilm Holdings Corporation.
3. What are the main segments of the Mammography Industry in India?
The market segments include Product Type, End User.
4. Can you provide details about the market size?
The market size is estimated to be USD 67.35 Million as of 2022.
5. What are some drivers contributing to market growth?
Growing Burden of Breast Cancer; Technological Advancements in the Field of Breast Imaging.
6. What are the notable trends driving market growth?
Specialty Clinics are Expected to Witness Steady Growth.
7. Are there any restraints impacting market growth?
Risk of Adverse Effects from Radiation Exposure.
8. Can you provide examples of recent developments in the market?
In October 2021, the Mahatma Gandhi Memorial Government Hospital (MGMGH) in Trichy, Tamil Nadu, announced that the hospital has installed a mammography device at the facility.
9. What pricing options are available for accessing the report?
Pricing options include single-user, multi-user, and enterprise licenses priced at USD 3800, USD 4500, and USD 5800 respectively.
10. Is the market size provided in terms of value or volume?
The market size is provided in terms of value, measured in Million.
11. Are there any specific market keywords associated with the report?
Yes, the market keyword associated with the report is "Mammography Industry in India," which aids in identifying and referencing the specific market segment covered.
12. How do I determine which pricing option suits my needs best?
The pricing options vary based on user requirements and access needs. Individual users may opt for single-user licenses, while businesses requiring broader access may choose multi-user or enterprise licenses for cost-effective access to the report.
13. Are there any additional resources or data provided in the Mammography Industry in India report?
While the report offers comprehensive insights, it's advisable to review the specific contents or supplementary materials provided to ascertain if additional resources or data are available.
14. How can I stay updated on further developments or reports in the Mammography Industry in India?
To stay informed about further developments, trends, and reports in the Mammography Industry in India, consider subscribing to industry newsletters, following relevant companies and organizations, or regularly checking reputable industry news sources and publications.
Methodology
Step 1 - Identification of Relevant Samples Size from Population Database


Step 2 - Approaches for Defining Global Market Size (Value, Volume* & Price*)

Note*: In applicable scenarios
Step 3 - Data Sources
Primary Research
- Web Analytics
- Survey Reports
- Research Institute
- Latest Research Reports
- Opinion Leaders
Secondary Research
- Annual Reports
- White Paper
- Latest Press Release
- Industry Association
- Paid Database
- Investor Presentations

Step 4 - Data Triangulation
Involves using different sources of information in order to increase the validity of a study
These sources are likely to be stakeholders in a program - participants, other researchers, program staff, other community members, and so on.
Then we put all data in single framework & apply various statistical tools to find out the dynamic on the market.
During the analysis stage, feedback from the stakeholder groups would be compared to determine areas of agreement as well as areas of divergence


