
Key Insights
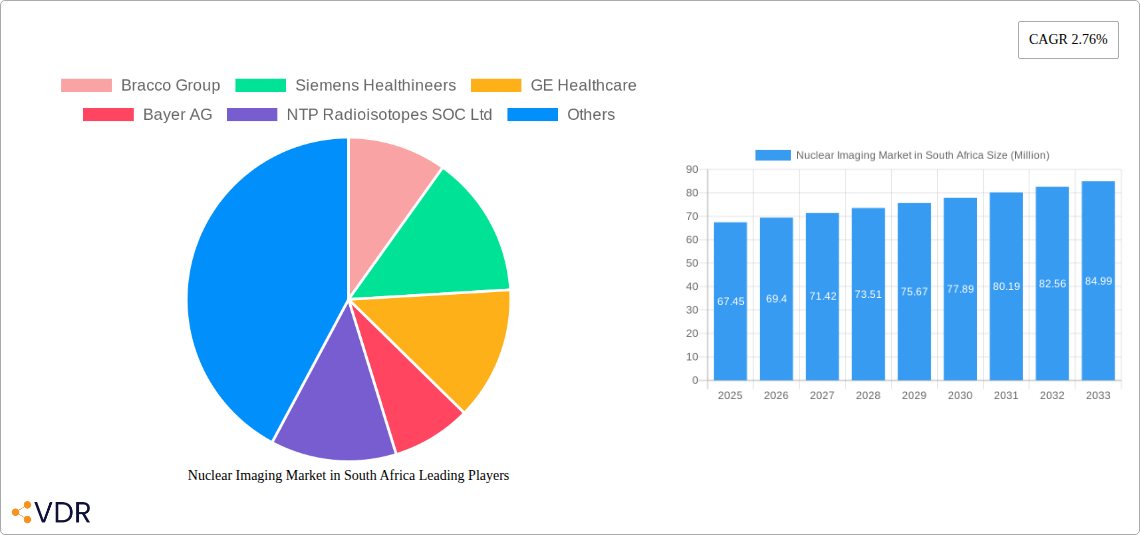
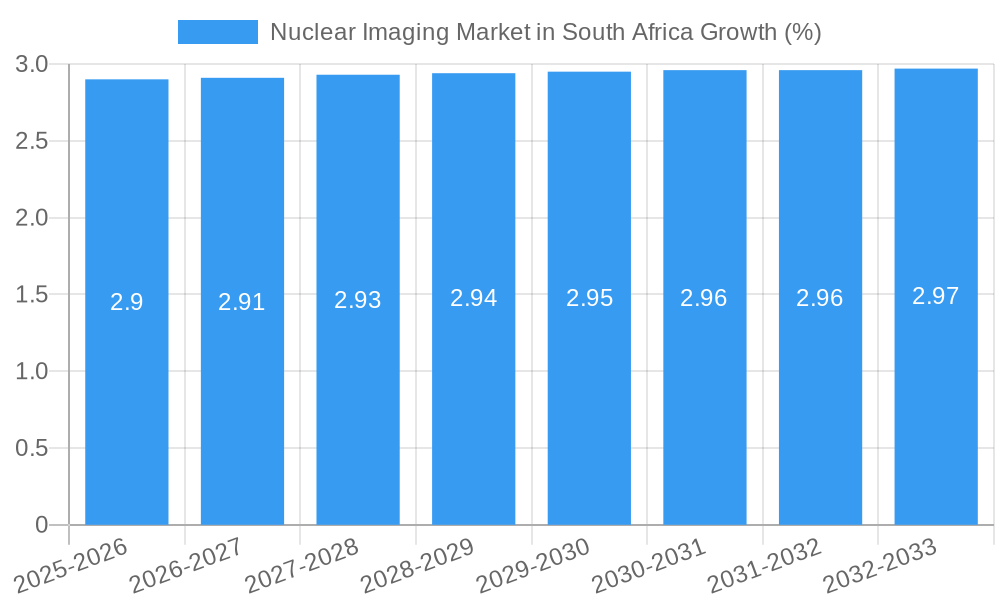
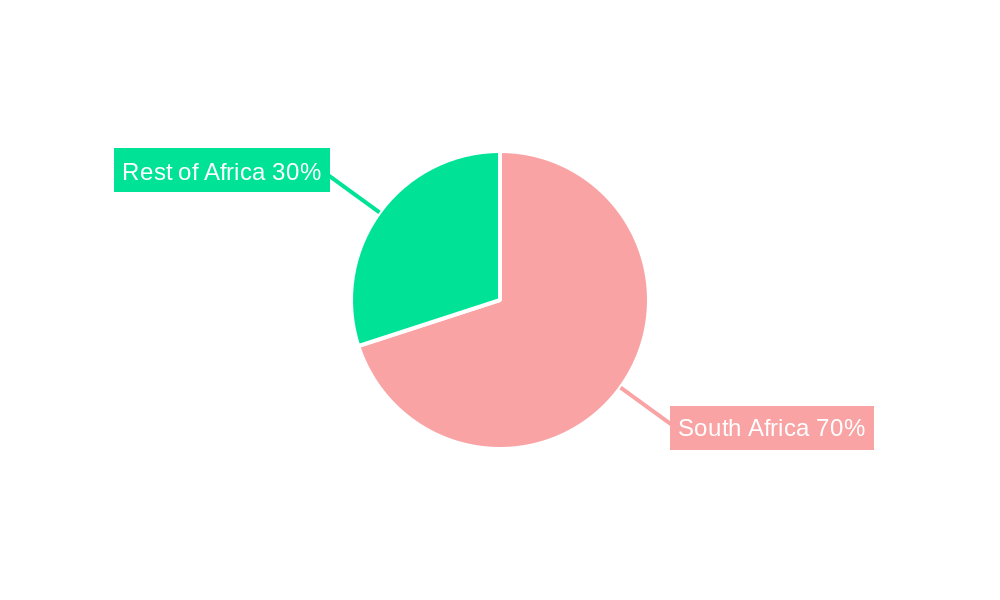
The South African nuclear imaging market, valued at approximately $67.45 million in 2025, is poised for moderate growth, driven by increasing prevalence of chronic diseases like cancer and cardiovascular conditions requiring advanced diagnostic techniques. The market's Compound Annual Growth Rate (CAGR) of 2.76% from 2025-2033 reflects a steady, albeit not explosive, expansion. Key growth drivers include rising healthcare expenditure, government initiatives to improve healthcare infrastructure, and an increasing awareness among both medical professionals and the public about the benefits of nuclear imaging for early diagnosis and treatment planning. The market segmentation reveals significant contributions from both SPECT and PET applications, with equipment sales representing a considerable portion of the overall value. Major players like Bracco Group, Siemens Healthineers, and GE Healthcare are key competitors, offering a range of advanced imaging equipment and radioisotopes. While the market faces potential restraints such as high equipment costs and the need for specialized trained personnel, the long-term outlook remains positive, especially considering the growing demand for sophisticated medical diagnostics across the country. The African region, particularly South Africa, presents a unique opportunity for market expansion due to its relatively developed healthcare infrastructure compared to other African nations.
Growth within specific segments, such as PET imaging, might exceed the overall CAGR, fueled by technological advancements leading to increased sensitivity and specificity in diagnosis. The market’s future trajectory is likely influenced by factors such as the adoption rate of new imaging technologies, government regulations impacting medical device approval and reimbursement, and the ongoing development of more effective and less invasive diagnostic procedures. Competition among established players and potential entry of new companies could also shape the market dynamics. Focusing on strategic partnerships, expansion of service offerings, and effective marketing strategies are crucial for success in the competitive South African nuclear imaging market. Investment in training and education programs to build expertise in nuclear medicine technologies will also be vital for the sustainable growth of this market segment.
Nuclear Imaging Market in South Africa: A Comprehensive Market Report (2019-2033)
This in-depth report provides a comprehensive analysis of the Nuclear Imaging Market in South Africa, offering invaluable insights for industry professionals, investors, and strategic decision-makers. The report covers the period 2019-2033, with a focus on the 2025-2033 forecast period, and utilizes 2025 as the base year. The market is segmented by product (Equipment, Diagnostic Radioisotope) and application (SPECT Applications, PET Applications, Other SPECT Applications), providing a granular understanding of market dynamics. The report's value is in Million units.
Nuclear Imaging Market in South Africa Market Dynamics & Structure
This section analyzes the South African nuclear imaging market's competitive landscape, technological advancements, regulatory environment, and market trends. The market is moderately concentrated, with key players such as Bracco Group, Siemens Healthineers, and GE Healthcare holding significant market share, estimated at xx% collectively in 2025. However, smaller players and local distributors like NTP Radioisotopes SOC Ltd also contribute significantly.
- Market Concentration: Moderate, with a few dominant players and several smaller, specialized firms.
- Technological Innovation: Driven by advancements in SPECT and PET technology, leading to improved image quality, faster scan times, and reduced radiation exposure. However, high initial investment costs and specialized expertise present significant barriers to wider adoption.
- Regulatory Framework: Stringent regulations govern the use of radioactive materials, impacting market access and operational costs. Compliance requirements represent a significant hurdle for smaller companies.
- Competitive Product Substitutes: While limited direct substitutes exist, alternative imaging modalities (e.g., MRI, CT) compete for healthcare budgets.
- End-User Demographics: Growth is driven by increasing prevalence of chronic diseases requiring nuclear imaging and rising healthcare spending. The aging population and improving healthcare infrastructure are also contributing factors.
- M&A Trends: The market has witnessed a moderate level of M&A activity in recent years, primarily focused on expanding distribution networks and enhancing technological capabilities. The number of deals is estimated at xx per year during the historical period, with an anticipated increase to xx per year in the forecast period.
Nuclear Imaging Market in South Africa Growth Trends & Insights
The South African nuclear imaging market experienced steady growth during the historical period (2019-2024), expanding at a CAGR of xx%. This growth is projected to accelerate during the forecast period (2025-2033), reaching a CAGR of xx%, driven by factors such as increasing demand for advanced diagnostic procedures, government initiatives to improve healthcare infrastructure, and technological advancements in imaging technology. Market size in 2025 is estimated at xx Million units and is projected to reach xx Million units by 2033. Increased adoption rates, particularly in private healthcare facilities, are contributing to this upward trend. Technological disruptions, such as the introduction of hybrid imaging systems combining PET and CT, are further fueling market expansion. Changes in consumer behavior, with an increasing preference for minimally invasive procedures and faster diagnostic techniques, are also influencing market growth.
Dominant Regions, Countries, or Segments in Nuclear Imaging Market in South Africa
The Gauteng province, due to its concentration of major hospitals and private healthcare facilities, is the leading region for nuclear imaging in South Africa. Within the product segment, Equipment holds a larger market share compared to Diagnostic Radioisotope due to the higher capital expenditure in hospitals. Among applications, SPECT Applications currently dominates, however PET Applications are experiencing faster growth, driven by increased awareness and rising demand for oncology diagnostics.
- Key Drivers in Gauteng:
- High concentration of healthcare institutions.
- Strong private healthcare sector.
- Better infrastructure and access to advanced technology.
- Market Share & Growth Potential: Gauteng holds approximately xx% of the national market share, with projections of xx% growth in the forecast period. The PET Applications segment is poised for faster growth compared to SPECT, driven by an increasing number of cancer diagnoses.
Nuclear Imaging Market in South Africa Product Landscape
The market features a wide array of equipment, including SPECT and PET scanners, gamma cameras, and related accessories. Diagnostic radioisotopes include various radiopharmaceuticals tailored to specific imaging applications. Recent innovations include advanced detectors, improved image reconstruction software, and the development of novel radiotracers, leading to higher resolution images and more precise diagnoses. These improvements are enhancing diagnostic capabilities and expanding the clinical applications of nuclear imaging techniques. Key selling propositions focus on improved image quality, faster scan times, reduced radiation dosage, and ease of use.
Key Drivers, Barriers & Challenges in Nuclear Imaging Market in South Africa
Key Drivers:
- Rising prevalence of chronic diseases necessitating diagnostic imaging.
- Increasing healthcare expenditure by both public and private sectors.
- Technological advancements enhancing the accuracy and speed of procedures.
- Government initiatives promoting the modernization of healthcare infrastructure.
Challenges & Restraints:
- High initial investment costs for equipment and infrastructure.
- Limited skilled personnel to operate and maintain advanced systems.
- Stringent regulatory requirements and licensing procedures.
- Competition from other diagnostic imaging modalities. This competition is estimated to impact growth by approximately xx% annually in the short term.
Emerging Opportunities in Nuclear Imaging Market in South Africa
- Expansion into rural areas: Addressing the underserved populations in rural areas offers significant growth potential.
- Development of new radiopharmaceuticals: The creation of more specific and sensitive tracers will lead to improved diagnostic accuracy.
- Telemedicine integration: Remote access to nuclear imaging data through telemedicine platforms will enhance patient care.
Growth Accelerators in the Nuclear Imaging Market in South Africa Industry
The South African nuclear imaging market's future growth will be fueled by strategic partnerships between healthcare providers and technology companies, facilitating the adoption of advanced imaging systems. Government investments in healthcare infrastructure and research and development initiatives to foster technological advancements will also play a key role. Furthermore, the increasing awareness of the benefits of nuclear imaging among healthcare professionals and the general population will further accelerate market growth.
Key Players Shaping the Nuclear Imaging Market in South Africa Market
- Bracco Group
- Siemens Healthineers
- GE Healthcare
- Bayer AG
- NTP Radioisotopes SOC Ltd
- Koninklijke Philips NV
- Klydon
- Canon Medical Systems Corporation
- Curium
- Fujifilm Holdings Corporation
Notable Milestones in Nuclear Imaging Market in South Africa Sector
- November 2021: Life Healthcare Group and AXIM Group announced a joint venture to establish a cyclotron-based radiopharmacy business. This significantly impacts the supply chain and accessibility of radioisotopes.
- May 2021: GE Healthcare's partnership with NSIA, Banque Côte d'Ivoire, and IFC to provide medical equipment highlights increased investment in healthcare infrastructure and potential market expansion.
In-Depth Nuclear Imaging Market in South Africa Market Outlook
The South African nuclear imaging market is poised for substantial growth over the next decade. Continued investment in healthcare infrastructure, technological advancements in imaging techniques, and increasing awareness of the benefits of nuclear imaging will fuel market expansion. Strategic partnerships, focusing on improving access to technology and training, will play a vital role in achieving the full potential of this market. The growth will be particularly noticeable in the PET imaging segment, alongside the expansion into previously underserved areas.
Nuclear Imaging Market in South Africa Segmentation
-
1. Product
- 1.1. Equipment
-
1.2. Diagnostic Radioisotope
- 1.2.1. SPECT Radioisotopes
- 1.2.2. PET Radioisotopes
-
2. Application
-
2.1. SPECT Applications
- 2.1.1. Cardiology
- 2.1.2. Neurology
- 2.1.3. Thyroid
- 2.1.4. Other SPECT Applications
-
2.2. PET Applications
- 2.2.1. Oncology
- 2.2.2. Other PET Applications
-
2.1. SPECT Applications
Nuclear Imaging Market in South Africa Segmentation By Geography
-
1. North America
- 1.1. United States
- 1.2. Canada
- 1.3. Mexico
-
2. South America
- 2.1. Brazil
- 2.2. Argentina
- 2.3. Rest of South America
-
3. Europe
- 3.1. United Kingdom
- 3.2. Germany
- 3.3. France
- 3.4. Italy
- 3.5. Spain
- 3.6. Russia
- 3.7. Benelux
- 3.8. Nordics
- 3.9. Rest of Europe
-
4. Middle East & Africa
- 4.1. Turkey
- 4.2. Israel
- 4.3. GCC
- 4.4. North Africa
- 4.5. South Africa
- 4.6. Rest of Middle East & Africa
-
5. Asia Pacific
- 5.1. China
- 5.2. India
- 5.3. Japan
- 5.4. South Korea
- 5.5. ASEAN
- 5.6. Oceania
- 5.7. Rest of Asia Pacific
Nuclear Imaging Market in South Africa REPORT HIGHLIGHTS
| Aspects | Details |
|---|---|
| Study Period | 2019-2033 |
| Base Year | 2024 |
| Estimated Year | 2025 |
| Forecast Period | 2025-2033 |
| Historical Period | 2019-2024 |
| Growth Rate | CAGR of 2.76% from 2019-2033 |
| Segmentation |
|
Table of Contents
- 1. Introduction
- 1.1. Research Scope
- 1.2. Market Segmentation
- 1.3. Research Methodology
- 1.4. Definitions and Assumptions
- 2. Executive Summary
- 2.1. Introduction
- 3. Market Dynamics
- 3.1. Introduction
- 3.2. Market Drivers
- 3.2.1. Increasing Prevalence of Cancer and Cardiac Disorders; Technological Advancements in Nuclear Imaging
- 3.3. Market Restrains
- 3.3.1. Stringent Regulations
- 3.4. Market Trends
- 3.4.1. SPECT Radioisotopes are Expected to Witness Strong Growth Over the Forecast Period
- 4. Market Factor Analysis
- 4.1. Porters Five Forces
- 4.2. Supply/Value Chain
- 4.3. PESTEL analysis
- 4.4. Market Entropy
- 4.5. Patent/Trademark Analysis
- 5. Global Nuclear Imaging Market in South Africa Analysis, Insights and Forecast, 2019-2031
- 5.1. Market Analysis, Insights and Forecast - by Product
- 5.1.1. Equipment
- 5.1.2. Diagnostic Radioisotope
- 5.1.2.1. SPECT Radioisotopes
- 5.1.2.2. PET Radioisotopes
- 5.2. Market Analysis, Insights and Forecast - by Application
- 5.2.1. SPECT Applications
- 5.2.1.1. Cardiology
- 5.2.1.2. Neurology
- 5.2.1.3. Thyroid
- 5.2.1.4. Other SPECT Applications
- 5.2.2. PET Applications
- 5.2.2.1. Oncology
- 5.2.2.2. Other PET Applications
- 5.2.1. SPECT Applications
- 5.3. Market Analysis, Insights and Forecast - by Region
- 5.3.1. North America
- 5.3.2. South America
- 5.3.3. Europe
- 5.3.4. Middle East & Africa
- 5.3.5. Asia Pacific
- 5.1. Market Analysis, Insights and Forecast - by Product
- 6. North America Nuclear Imaging Market in South Africa Analysis, Insights and Forecast, 2019-2031
- 6.1. Market Analysis, Insights and Forecast - by Product
- 6.1.1. Equipment
- 6.1.2. Diagnostic Radioisotope
- 6.1.2.1. SPECT Radioisotopes
- 6.1.2.2. PET Radioisotopes
- 6.2. Market Analysis, Insights and Forecast - by Application
- 6.2.1. SPECT Applications
- 6.2.1.1. Cardiology
- 6.2.1.2. Neurology
- 6.2.1.3. Thyroid
- 6.2.1.4. Other SPECT Applications
- 6.2.2. PET Applications
- 6.2.2.1. Oncology
- 6.2.2.2. Other PET Applications
- 6.2.1. SPECT Applications
- 6.1. Market Analysis, Insights and Forecast - by Product
- 7. South America Nuclear Imaging Market in South Africa Analysis, Insights and Forecast, 2019-2031
- 7.1. Market Analysis, Insights and Forecast - by Product
- 7.1.1. Equipment
- 7.1.2. Diagnostic Radioisotope
- 7.1.2.1. SPECT Radioisotopes
- 7.1.2.2. PET Radioisotopes
- 7.2. Market Analysis, Insights and Forecast - by Application
- 7.2.1. SPECT Applications
- 7.2.1.1. Cardiology
- 7.2.1.2. Neurology
- 7.2.1.3. Thyroid
- 7.2.1.4. Other SPECT Applications
- 7.2.2. PET Applications
- 7.2.2.1. Oncology
- 7.2.2.2. Other PET Applications
- 7.2.1. SPECT Applications
- 7.1. Market Analysis, Insights and Forecast - by Product
- 8. Europe Nuclear Imaging Market in South Africa Analysis, Insights and Forecast, 2019-2031
- 8.1. Market Analysis, Insights and Forecast - by Product
- 8.1.1. Equipment
- 8.1.2. Diagnostic Radioisotope
- 8.1.2.1. SPECT Radioisotopes
- 8.1.2.2. PET Radioisotopes
- 8.2. Market Analysis, Insights and Forecast - by Application
- 8.2.1. SPECT Applications
- 8.2.1.1. Cardiology
- 8.2.1.2. Neurology
- 8.2.1.3. Thyroid
- 8.2.1.4. Other SPECT Applications
- 8.2.2. PET Applications
- 8.2.2.1. Oncology
- 8.2.2.2. Other PET Applications
- 8.2.1. SPECT Applications
- 8.1. Market Analysis, Insights and Forecast - by Product
- 9. Middle East & Africa Nuclear Imaging Market in South Africa Analysis, Insights and Forecast, 2019-2031
- 9.1. Market Analysis, Insights and Forecast - by Product
- 9.1.1. Equipment
- 9.1.2. Diagnostic Radioisotope
- 9.1.2.1. SPECT Radioisotopes
- 9.1.2.2. PET Radioisotopes
- 9.2. Market Analysis, Insights and Forecast - by Application
- 9.2.1. SPECT Applications
- 9.2.1.1. Cardiology
- 9.2.1.2. Neurology
- 9.2.1.3. Thyroid
- 9.2.1.4. Other SPECT Applications
- 9.2.2. PET Applications
- 9.2.2.1. Oncology
- 9.2.2.2. Other PET Applications
- 9.2.1. SPECT Applications
- 9.1. Market Analysis, Insights and Forecast - by Product
- 10. Asia Pacific Nuclear Imaging Market in South Africa Analysis, Insights and Forecast, 2019-2031
- 10.1. Market Analysis, Insights and Forecast - by Product
- 10.1.1. Equipment
- 10.1.2. Diagnostic Radioisotope
- 10.1.2.1. SPECT Radioisotopes
- 10.1.2.2. PET Radioisotopes
- 10.2. Market Analysis, Insights and Forecast - by Application
- 10.2.1. SPECT Applications
- 10.2.1.1. Cardiology
- 10.2.1.2. Neurology
- 10.2.1.3. Thyroid
- 10.2.1.4. Other SPECT Applications
- 10.2.2. PET Applications
- 10.2.2.1. Oncology
- 10.2.2.2. Other PET Applications
- 10.2.1. SPECT Applications
- 10.1. Market Analysis, Insights and Forecast - by Product
- 11. South Africa Nuclear Imaging Market in South Africa Analysis, Insights and Forecast, 2019-2031
- 12. Sudan Nuclear Imaging Market in South Africa Analysis, Insights and Forecast, 2019-2031
- 13. Uganda Nuclear Imaging Market in South Africa Analysis, Insights and Forecast, 2019-2031
- 14. Tanzania Nuclear Imaging Market in South Africa Analysis, Insights and Forecast, 2019-2031
- 15. Kenya Nuclear Imaging Market in South Africa Analysis, Insights and Forecast, 2019-2031
- 16. Rest of Africa Nuclear Imaging Market in South Africa Analysis, Insights and Forecast, 2019-2031
- 17. Competitive Analysis
- 17.1. Global Market Share Analysis 2024
- 17.2. Company Profiles
- 17.2.1 Bracco Group
- 17.2.1.1. Overview
- 17.2.1.2. Products
- 17.2.1.3. SWOT Analysis
- 17.2.1.4. Recent Developments
- 17.2.1.5. Financials (Based on Availability)
- 17.2.2 Siemens Healthineers
- 17.2.2.1. Overview
- 17.2.2.2. Products
- 17.2.2.3. SWOT Analysis
- 17.2.2.4. Recent Developments
- 17.2.2.5. Financials (Based on Availability)
- 17.2.3 GE Healthcare
- 17.2.3.1. Overview
- 17.2.3.2. Products
- 17.2.3.3. SWOT Analysis
- 17.2.3.4. Recent Developments
- 17.2.3.5. Financials (Based on Availability)
- 17.2.4 Bayer AG
- 17.2.4.1. Overview
- 17.2.4.2. Products
- 17.2.4.3. SWOT Analysis
- 17.2.4.4. Recent Developments
- 17.2.4.5. Financials (Based on Availability)
- 17.2.5 NTP Radioisotopes SOC Ltd
- 17.2.5.1. Overview
- 17.2.5.2. Products
- 17.2.5.3. SWOT Analysis
- 17.2.5.4. Recent Developments
- 17.2.5.5. Financials (Based on Availability)
- 17.2.6 Koninklijke Philips NV
- 17.2.6.1. Overview
- 17.2.6.2. Products
- 17.2.6.3. SWOT Analysis
- 17.2.6.4. Recent Developments
- 17.2.6.5. Financials (Based on Availability)
- 17.2.7 Klydon
- 17.2.7.1. Overview
- 17.2.7.2. Products
- 17.2.7.3. SWOT Analysis
- 17.2.7.4. Recent Developments
- 17.2.7.5. Financials (Based on Availability)
- 17.2.8 Canon Medical Systems Corporation
- 17.2.8.1. Overview
- 17.2.8.2. Products
- 17.2.8.3. SWOT Analysis
- 17.2.8.4. Recent Developments
- 17.2.8.5. Financials (Based on Availability)
- 17.2.9 Curium
- 17.2.9.1. Overview
- 17.2.9.2. Products
- 17.2.9.3. SWOT Analysis
- 17.2.9.4. Recent Developments
- 17.2.9.5. Financials (Based on Availability)
- 17.2.10 Fujifilm Holdings Corporation
- 17.2.10.1. Overview
- 17.2.10.2. Products
- 17.2.10.3. SWOT Analysis
- 17.2.10.4. Recent Developments
- 17.2.10.5. Financials (Based on Availability)
- 17.2.1 Bracco Group
List of Figures
- Figure 1: Global Nuclear Imaging Market in South Africa Revenue Breakdown (Million, %) by Region 2024 & 2032
- Figure 2: Africa Nuclear Imaging Market in South Africa Revenue (Million), by Country 2024 & 2032
- Figure 3: Africa Nuclear Imaging Market in South Africa Revenue Share (%), by Country 2024 & 2032
- Figure 4: North America Nuclear Imaging Market in South Africa Revenue (Million), by Product 2024 & 2032
- Figure 5: North America Nuclear Imaging Market in South Africa Revenue Share (%), by Product 2024 & 2032
- Figure 6: North America Nuclear Imaging Market in South Africa Revenue (Million), by Application 2024 & 2032
- Figure 7: North America Nuclear Imaging Market in South Africa Revenue Share (%), by Application 2024 & 2032
- Figure 8: North America Nuclear Imaging Market in South Africa Revenue (Million), by Country 2024 & 2032
- Figure 9: North America Nuclear Imaging Market in South Africa Revenue Share (%), by Country 2024 & 2032
- Figure 10: South America Nuclear Imaging Market in South Africa Revenue (Million), by Product 2024 & 2032
- Figure 11: South America Nuclear Imaging Market in South Africa Revenue Share (%), by Product 2024 & 2032
- Figure 12: South America Nuclear Imaging Market in South Africa Revenue (Million), by Application 2024 & 2032
- Figure 13: South America Nuclear Imaging Market in South Africa Revenue Share (%), by Application 2024 & 2032
- Figure 14: South America Nuclear Imaging Market in South Africa Revenue (Million), by Country 2024 & 2032
- Figure 15: South America Nuclear Imaging Market in South Africa Revenue Share (%), by Country 2024 & 2032
- Figure 16: Europe Nuclear Imaging Market in South Africa Revenue (Million), by Product 2024 & 2032
- Figure 17: Europe Nuclear Imaging Market in South Africa Revenue Share (%), by Product 2024 & 2032
- Figure 18: Europe Nuclear Imaging Market in South Africa Revenue (Million), by Application 2024 & 2032
- Figure 19: Europe Nuclear Imaging Market in South Africa Revenue Share (%), by Application 2024 & 2032
- Figure 20: Europe Nuclear Imaging Market in South Africa Revenue (Million), by Country 2024 & 2032
- Figure 21: Europe Nuclear Imaging Market in South Africa Revenue Share (%), by Country 2024 & 2032
- Figure 22: Middle East & Africa Nuclear Imaging Market in South Africa Revenue (Million), by Product 2024 & 2032
- Figure 23: Middle East & Africa Nuclear Imaging Market in South Africa Revenue Share (%), by Product 2024 & 2032
- Figure 24: Middle East & Africa Nuclear Imaging Market in South Africa Revenue (Million), by Application 2024 & 2032
- Figure 25: Middle East & Africa Nuclear Imaging Market in South Africa Revenue Share (%), by Application 2024 & 2032
- Figure 26: Middle East & Africa Nuclear Imaging Market in South Africa Revenue (Million), by Country 2024 & 2032
- Figure 27: Middle East & Africa Nuclear Imaging Market in South Africa Revenue Share (%), by Country 2024 & 2032
- Figure 28: Asia Pacific Nuclear Imaging Market in South Africa Revenue (Million), by Product 2024 & 2032
- Figure 29: Asia Pacific Nuclear Imaging Market in South Africa Revenue Share (%), by Product 2024 & 2032
- Figure 30: Asia Pacific Nuclear Imaging Market in South Africa Revenue (Million), by Application 2024 & 2032
- Figure 31: Asia Pacific Nuclear Imaging Market in South Africa Revenue Share (%), by Application 2024 & 2032
- Figure 32: Asia Pacific Nuclear Imaging Market in South Africa Revenue (Million), by Country 2024 & 2032
- Figure 33: Asia Pacific Nuclear Imaging Market in South Africa Revenue Share (%), by Country 2024 & 2032
List of Tables
- Table 1: Global Nuclear Imaging Market in South Africa Revenue Million Forecast, by Region 2019 & 2032
- Table 2: Global Nuclear Imaging Market in South Africa Revenue Million Forecast, by Product 2019 & 2032
- Table 3: Global Nuclear Imaging Market in South Africa Revenue Million Forecast, by Application 2019 & 2032
- Table 4: Global Nuclear Imaging Market in South Africa Revenue Million Forecast, by Region 2019 & 2032
- Table 5: Global Nuclear Imaging Market in South Africa Revenue Million Forecast, by Country 2019 & 2032
- Table 6: South Africa Nuclear Imaging Market in South Africa Revenue (Million) Forecast, by Application 2019 & 2032
- Table 7: Sudan Nuclear Imaging Market in South Africa Revenue (Million) Forecast, by Application 2019 & 2032
- Table 8: Uganda Nuclear Imaging Market in South Africa Revenue (Million) Forecast, by Application 2019 & 2032
- Table 9: Tanzania Nuclear Imaging Market in South Africa Revenue (Million) Forecast, by Application 2019 & 2032
- Table 10: Kenya Nuclear Imaging Market in South Africa Revenue (Million) Forecast, by Application 2019 & 2032
- Table 11: Rest of Africa Nuclear Imaging Market in South Africa Revenue (Million) Forecast, by Application 2019 & 2032
- Table 12: Global Nuclear Imaging Market in South Africa Revenue Million Forecast, by Product 2019 & 2032
- Table 13: Global Nuclear Imaging Market in South Africa Revenue Million Forecast, by Application 2019 & 2032
- Table 14: Global Nuclear Imaging Market in South Africa Revenue Million Forecast, by Country 2019 & 2032
- Table 15: United States Nuclear Imaging Market in South Africa Revenue (Million) Forecast, by Application 2019 & 2032
- Table 16: Canada Nuclear Imaging Market in South Africa Revenue (Million) Forecast, by Application 2019 & 2032
- Table 17: Mexico Nuclear Imaging Market in South Africa Revenue (Million) Forecast, by Application 2019 & 2032
- Table 18: Global Nuclear Imaging Market in South Africa Revenue Million Forecast, by Product 2019 & 2032
- Table 19: Global Nuclear Imaging Market in South Africa Revenue Million Forecast, by Application 2019 & 2032
- Table 20: Global Nuclear Imaging Market in South Africa Revenue Million Forecast, by Country 2019 & 2032
- Table 21: Brazil Nuclear Imaging Market in South Africa Revenue (Million) Forecast, by Application 2019 & 2032
- Table 22: Argentina Nuclear Imaging Market in South Africa Revenue (Million) Forecast, by Application 2019 & 2032
- Table 23: Rest of South America Nuclear Imaging Market in South Africa Revenue (Million) Forecast, by Application 2019 & 2032
- Table 24: Global Nuclear Imaging Market in South Africa Revenue Million Forecast, by Product 2019 & 2032
- Table 25: Global Nuclear Imaging Market in South Africa Revenue Million Forecast, by Application 2019 & 2032
- Table 26: Global Nuclear Imaging Market in South Africa Revenue Million Forecast, by Country 2019 & 2032
- Table 27: United Kingdom Nuclear Imaging Market in South Africa Revenue (Million) Forecast, by Application 2019 & 2032
- Table 28: Germany Nuclear Imaging Market in South Africa Revenue (Million) Forecast, by Application 2019 & 2032
- Table 29: France Nuclear Imaging Market in South Africa Revenue (Million) Forecast, by Application 2019 & 2032
- Table 30: Italy Nuclear Imaging Market in South Africa Revenue (Million) Forecast, by Application 2019 & 2032
- Table 31: Spain Nuclear Imaging Market in South Africa Revenue (Million) Forecast, by Application 2019 & 2032
- Table 32: Russia Nuclear Imaging Market in South Africa Revenue (Million) Forecast, by Application 2019 & 2032
- Table 33: Benelux Nuclear Imaging Market in South Africa Revenue (Million) Forecast, by Application 2019 & 2032
- Table 34: Nordics Nuclear Imaging Market in South Africa Revenue (Million) Forecast, by Application 2019 & 2032
- Table 35: Rest of Europe Nuclear Imaging Market in South Africa Revenue (Million) Forecast, by Application 2019 & 2032
- Table 36: Global Nuclear Imaging Market in South Africa Revenue Million Forecast, by Product 2019 & 2032
- Table 37: Global Nuclear Imaging Market in South Africa Revenue Million Forecast, by Application 2019 & 2032
- Table 38: Global Nuclear Imaging Market in South Africa Revenue Million Forecast, by Country 2019 & 2032
- Table 39: Turkey Nuclear Imaging Market in South Africa Revenue (Million) Forecast, by Application 2019 & 2032
- Table 40: Israel Nuclear Imaging Market in South Africa Revenue (Million) Forecast, by Application 2019 & 2032
- Table 41: GCC Nuclear Imaging Market in South Africa Revenue (Million) Forecast, by Application 2019 & 2032
- Table 42: North Africa Nuclear Imaging Market in South Africa Revenue (Million) Forecast, by Application 2019 & 2032
- Table 43: South Africa Nuclear Imaging Market in South Africa Revenue (Million) Forecast, by Application 2019 & 2032
- Table 44: Rest of Middle East & Africa Nuclear Imaging Market in South Africa Revenue (Million) Forecast, by Application 2019 & 2032
- Table 45: Global Nuclear Imaging Market in South Africa Revenue Million Forecast, by Product 2019 & 2032
- Table 46: Global Nuclear Imaging Market in South Africa Revenue Million Forecast, by Application 2019 & 2032
- Table 47: Global Nuclear Imaging Market in South Africa Revenue Million Forecast, by Country 2019 & 2032
- Table 48: China Nuclear Imaging Market in South Africa Revenue (Million) Forecast, by Application 2019 & 2032
- Table 49: India Nuclear Imaging Market in South Africa Revenue (Million) Forecast, by Application 2019 & 2032
- Table 50: Japan Nuclear Imaging Market in South Africa Revenue (Million) Forecast, by Application 2019 & 2032
- Table 51: South Korea Nuclear Imaging Market in South Africa Revenue (Million) Forecast, by Application 2019 & 2032
- Table 52: ASEAN Nuclear Imaging Market in South Africa Revenue (Million) Forecast, by Application 2019 & 2032
- Table 53: Oceania Nuclear Imaging Market in South Africa Revenue (Million) Forecast, by Application 2019 & 2032
- Table 54: Rest of Asia Pacific Nuclear Imaging Market in South Africa Revenue (Million) Forecast, by Application 2019 & 2032
Frequently Asked Questions
1. What is the projected Compound Annual Growth Rate (CAGR) of the Nuclear Imaging Market in South Africa?
The projected CAGR is approximately 2.76%.
2. Which companies are prominent players in the Nuclear Imaging Market in South Africa?
Key companies in the market include Bracco Group, Siemens Healthineers, GE Healthcare, Bayer AG, NTP Radioisotopes SOC Ltd, Koninklijke Philips NV, Klydon, Canon Medical Systems Corporation, Curium, Fujifilm Holdings Corporation.
3. What are the main segments of the Nuclear Imaging Market in South Africa?
The market segments include Product, Application.
4. Can you provide details about the market size?
The market size is estimated to be USD 67.45 Million as of 2022.
5. What are some drivers contributing to market growth?
Increasing Prevalence of Cancer and Cardiac Disorders; Technological Advancements in Nuclear Imaging.
6. What are the notable trends driving market growth?
SPECT Radioisotopes are Expected to Witness Strong Growth Over the Forecast Period.
7. Are there any restraints impacting market growth?
Stringent Regulations.
8. Can you provide examples of recent developments in the market?
In November 2021, Life Healthcare Group, a healthcare organization in South Africa, and the AXIM Group of Companies, Sub-Saharan Africa's medical equipment, device, and consumable distributor, have signed a head of terms agreement to form a joint venture to establish a cyclotron based radiopharmacy business across South and Southern Africa.
9. What pricing options are available for accessing the report?
Pricing options include single-user, multi-user, and enterprise licenses priced at USD 3800, USD 4500, and USD 5800 respectively.
10. Is the market size provided in terms of value or volume?
The market size is provided in terms of value, measured in Million.
11. Are there any specific market keywords associated with the report?
Yes, the market keyword associated with the report is "Nuclear Imaging Market in South Africa," which aids in identifying and referencing the specific market segment covered.
12. How do I determine which pricing option suits my needs best?
The pricing options vary based on user requirements and access needs. Individual users may opt for single-user licenses, while businesses requiring broader access may choose multi-user or enterprise licenses for cost-effective access to the report.
13. Are there any additional resources or data provided in the Nuclear Imaging Market in South Africa report?
While the report offers comprehensive insights, it's advisable to review the specific contents or supplementary materials provided to ascertain if additional resources or data are available.
14. How can I stay updated on further developments or reports in the Nuclear Imaging Market in South Africa?
To stay informed about further developments, trends, and reports in the Nuclear Imaging Market in South Africa, consider subscribing to industry newsletters, following relevant companies and organizations, or regularly checking reputable industry news sources and publications.
Methodology
Step 1 - Identification of Relevant Samples Size from Population Database


Step 2 - Approaches for Defining Global Market Size (Value, Volume* & Price*)

Note*: In applicable scenarios
Step 3 - Data Sources
Primary Research
- Web Analytics
- Survey Reports
- Research Institute
- Latest Research Reports
- Opinion Leaders
Secondary Research
- Annual Reports
- White Paper
- Latest Press Release
- Industry Association
- Paid Database
- Investor Presentations

Step 4 - Data Triangulation
Involves using different sources of information in order to increase the validity of a study
These sources are likely to be stakeholders in a program - participants, other researchers, program staff, other community members, and so on.
Then we put all data in single framework & apply various statistical tools to find out the dynamic on the market.
During the analysis stage, feedback from the stakeholder groups would be compared to determine areas of agreement as well as areas of divergence


