

Key Insights
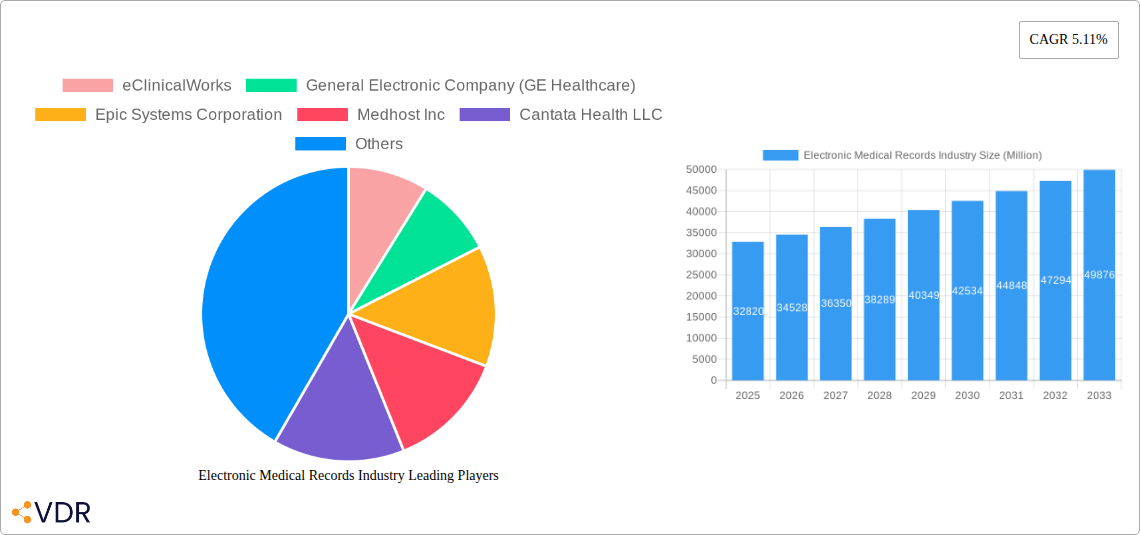
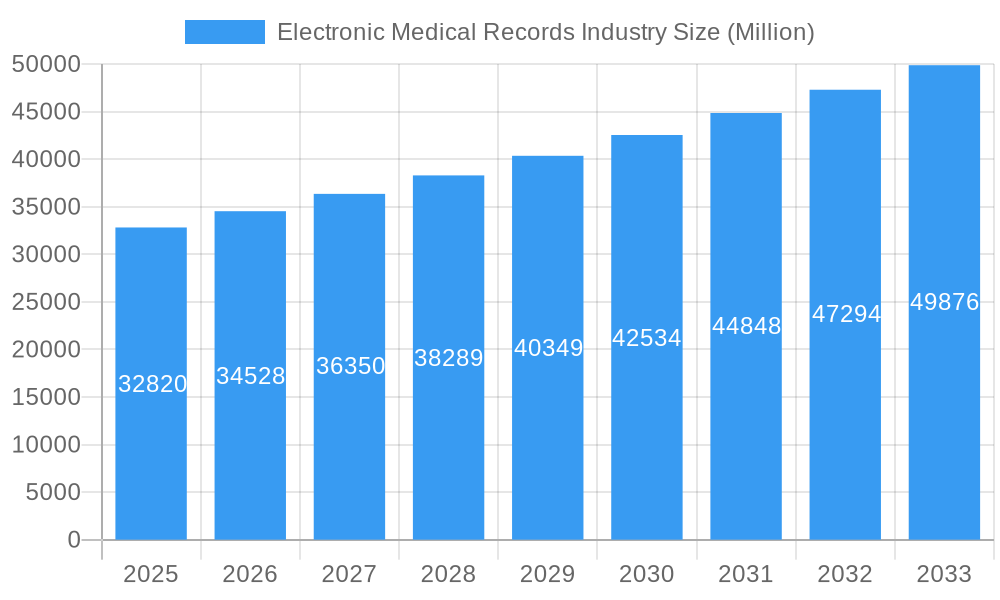
The Electronic Medical Records (EMR) market, valued at $32.82 billion in 2025, is projected to experience robust growth, driven by increasing healthcare data digitization, rising adoption of cloud-based solutions, and the growing need for interoperability among healthcare systems. The market's Compound Annual Growth Rate (CAGR) of 5.11% from 2019 to 2024 indicates a steady upward trajectory, expected to continue through 2033. Key drivers include government initiatives promoting electronic health records, the rising prevalence of chronic diseases requiring efficient data management, and the increasing demand for improved patient care through better data accessibility. Significant market segmentation exists across components (hardware, software, services), end-users (hospitals, physicians), applications (cardiology, oncology, etc.), EMR types (traditional, speech-enabled, interoperable), and delivery modes (cloud, on-premise). The competitive landscape is highly fragmented, with major players like Epic Systems, Cerner, Allscripts, and eClinicalWorks vying for market share through innovation and strategic partnerships. The North American market currently holds a significant share due to advanced healthcare infrastructure and early adoption of EMR technology, but growth in Asia Pacific and other emerging regions is expected to accelerate as healthcare infrastructure develops and digital health initiatives gain momentum.
Electronic Medical Records Industry Market Size (In Billion)
The continued growth of the EMR market is fueled by several key trends. These include the increasing integration of artificial intelligence (AI) and machine learning (ML) for improved diagnostics and treatment planning, the rise of telehealth and remote patient monitoring requiring seamless EMR integration, and the growing importance of data security and compliance with regulations like HIPAA. While factors such as high implementation costs and the need for extensive staff training pose challenges, the long-term benefits of enhanced efficiency, reduced medical errors, and improved patient outcomes are driving wider adoption. The market is expected to witness a shift towards cloud-based EMR solutions due to their scalability, cost-effectiveness, and accessibility. Furthermore, the increasing demand for interoperable EMR systems will play a vital role in shaping the market's future, fostering seamless data exchange among different healthcare providers. The forecast period of 2025-2033 will likely see further consolidation among market players as companies strategize to capture a larger share of this expanding market.
Electronic Medical Records Industry Company Market Share
Electronic Medical Records (EMR) Industry Market Dynamics & Structure
This comprehensive report analyzes the Electronic Medical Records (EMR) industry, encompassing its market structure, dynamics, and future trajectory from 2019-2033. The industry is characterized by a moderately concentrated market with key players like Epic Systems Corporation, Cerner Corporation (Oracle), and Allscripts Healthcare Solutions Inc. holding significant market share. However, a dynamic landscape exists with ongoing mergers and acquisitions (M&A) activity, fostering both consolidation and innovation. The global EMR market size in 2025 is estimated at $XX Billion.
- Market Concentration: The top 5 players hold an estimated xx% market share in 2025, indicating moderate concentration.
- Technological Innovation: AI, machine learning, and interoperability are key drivers, pushing toward more sophisticated and integrated EMR systems.
- Regulatory Frameworks: HIPAA compliance and data privacy regulations significantly influence market dynamics and technological development.
- Competitive Substitutes: While direct substitutes are limited, other healthcare IT solutions compete for budget allocation.
- End-User Demographics: Growth is driven by increasing adoption among hospitals, physician practices, and specialized clinics.
- M&A Trends: The past five years have witnessed xx major M&A deals, demonstrating a trend of consolidation and expansion of service offerings within the industry. Deal value is estimated at $XX Billion over the past 5 years.
Electronic Medical Records Industry Growth Trends & Insights
The global Electronic Medical Records (EMR) market exhibits robust growth, driven by rising healthcare expenditure, government initiatives promoting digital health, and the increasing need for efficient patient care management. The market is expected to experience a Compound Annual Growth Rate (CAGR) of xx% during the forecast period (2025-2033), expanding from an estimated $XX billion in 2025 to $XX billion by 2033. This growth is fueled by several factors including the increasing adoption of cloud-based EMR systems, the integration of advanced technologies like artificial intelligence (AI) and machine learning (ML), and the growing demand for interoperable EMR systems across healthcare settings. The shift from traditional on-premise models to cloud-based solutions is particularly significant, offering scalability, cost-effectiveness, and improved accessibility. Furthermore, increasing government regulations and incentives supporting EMR adoption are catalyzing market expansion. Consumer behavior also plays a crucial role, with patients increasingly demanding access to their medical records and a more streamlined healthcare experience.
Dominant Regions, Countries, or Segments in Electronic Medical Records Industry
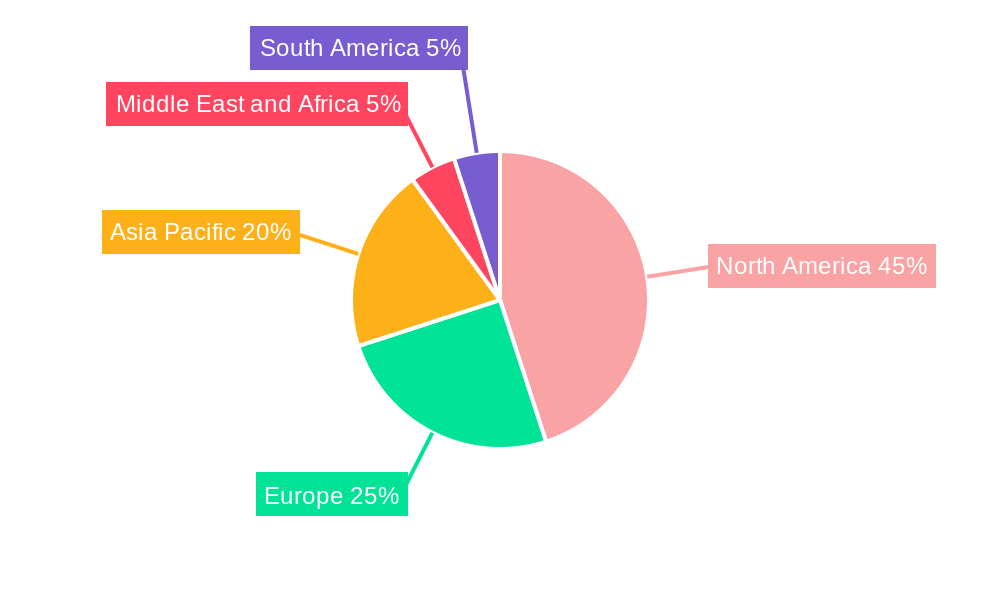
North America currently dominates the Electronic Medical Records (EMR) market, driven by high healthcare expenditure, advanced technological infrastructure, and early adoption of EMR systems. However, significant growth potential exists in the Asia-Pacific region, particularly in countries like India and China, due to expanding healthcare infrastructure and increasing government investments in digital health initiatives.
- Leading Segment: Software solutions currently hold the largest market share, followed by services. Growth is driven by the rising adoption of advanced software features, such as AI, ML, and interoperability.
- Dominant End-User: Hospital-based EMR currently dominates market share due to large-scale deployments and greater technological investments. However, Physician-based EMR is projected to exhibit high growth in the forecast period.
- Key Application: Cardiology and Oncology show high adoption rates, but all application segments show strong growth potential.
- Market Drivers:
- North America: High healthcare spending, strong regulatory support, and advanced technology adoption.
- Asia-Pacific: Rapidly expanding healthcare infrastructure, rising government investments, and growing adoption of digital technologies.
- Europe: Growing adoption of cloud-based EMR systems, increasing focus on interoperability, and stringent data privacy regulations.
Electronic Medical Records Industry Product Landscape
The EMR product landscape is characterized by a diverse range of solutions, including traditional EMRs, speech-enabled EMRs, and interoperable EMRs, offered through cloud-based and on-premise models. Innovative features like AI-powered diagnostic support, predictive analytics for patient risk stratification, and advanced patient portals are becoming increasingly common, enhancing the efficiency and effectiveness of healthcare delivery. Key performance indicators include ease of use, integration capabilities, data security features, and overall cost-effectiveness.
Key Drivers, Barriers & Challenges in Electronic Medical Records Industry
Key Drivers: The increasing need for improved patient care coordination, rising healthcare costs, and government mandates for electronic health records are primary drivers. Technological advancements like AI and cloud computing are further accelerating adoption.
Challenges & Restraints: High initial investment costs, concerns regarding data security and privacy, and the complexity of implementing and integrating EMR systems pose significant challenges. Interoperability issues between different EMR systems also hinder widespread adoption. The estimated cost of implementation and integration for a medium-sized hospital is approximately $XX Million.
Emerging Opportunities in Electronic Medical Records Industry
Emerging opportunities include the integration of telehealth platforms, the development of specialized EMR solutions for specific medical areas, and the expansion into untapped markets in developing economies. The increasing demand for remote patient monitoring and personalized medicine presents lucrative avenues for growth.
Growth Accelerators in the Electronic Medical Records Industry
Strategic partnerships between EMR vendors and healthcare providers are crucial for accelerating adoption. Government incentives and policies supporting EMR implementation play a pivotal role. Technological advancements, particularly in AI and cloud computing, significantly enhance the functionality and efficiency of EMR systems.
Key Players Shaping the Electronic Medical Records Industry Market
- eClinicalWorks
- General Electric Company (GE Healthcare)
- Epic Systems Corporation
- Medhost Inc
- Cantata Health LLC
- CareCloud Inc
- Computer Programs and Systems Inc
- Intersystems Corporation
- Meditech
- Greenway Health LLC
- Allscripts Healthcare Solutions Inc
- McKesson Corporation
- Cerner Corporation (Oracle)
- NextGen Healthcare Inc
- Athenahealth Inc
Notable Milestones in Electronic Medical Records Industry Sector
- November 2022: CareArc, a federally qualified health center (FQHC) in Kansas, launched an Epic EHR implementation through a partnership with Health Choice Network (HCN) to improve the patient experience. This highlights the ongoing adoption of leading EMR solutions by healthcare providers of various sizes.
- November 2022: Anumana acquired NeuTrace. This acquisition signifies the increasing integration of AI and advanced analytics into EMR systems, focusing on specialized applications like cardiac electrophysiology.
In-Depth Electronic Medical Records Industry Market Outlook
The EMR market is poised for continued growth, driven by technological innovation, increasing adoption rates, and favorable regulatory environments. Opportunities abound in expanding into new markets, developing specialized solutions, and leveraging AI to enhance patient care and operational efficiency. Strategic partnerships and investments in research and development will be crucial for maintaining a competitive edge in this rapidly evolving landscape.
Electronic Medical Records Industry Segmentation
-
1. Component
- 1.1. Hardware
- 1.2. Software
- 1.3. Services
-
2. End User
- 2.1. Hospital-based EMR
- 2.2. Physician-based EMR
-
3. Application
- 3.1. Cardiology
- 3.2. Neurology
- 3.3. Radiology
- 3.4. Oncology
- 3.5. Other Applications
-
4. Type
- 4.1. Traditional EMRs
- 4.2. Speech enabled EMRs
- 4.3. Interoperable EMRs
- 4.4. Other Types
-
5. Mode of Delivery
- 5.1. Cloud-based
- 5.2. On-premise Model
Electronic Medical Records Industry Segmentation By Geography
-
1. North America
- 1.1. United States
- 1.2. Canada
- 1.3. Mexico
-
2. Europe
- 2.1. Germany
- 2.2. United Kingdom
- 2.3. France
- 2.4. Italy
- 2.5. Spain
- 2.6. Rest of Europe
-
3. Asia Pacific
- 3.1. China
- 3.2. Japan
- 3.3. India
- 3.4. Australia
- 3.5. South Korea
- 3.6. Rest of Asia Pacific
-
4. Middle East and Africa
- 4.1. GCC
- 4.2. South Africa
- 4.3. Rest of Middle East and Africa
-
5. South America
- 5.1. Brazil
- 5.2. Argentina
- 5.3. Rest of South America
Electronic Medical Records Industry Regional Market Share
Geographic Coverage of Electronic Medical Records Industry
Electronic Medical Records Industry REPORT HIGHLIGHTS
| Aspects | Details |
|---|---|
| Study Period | 2020-2034 |
| Base Year | 2025 |
| Estimated Year | 2026 |
| Forecast Period | 2026-2034 |
| Historical Period | 2020-2025 |
| Growth Rate | CAGR of 5.11% from 2020-2034 |
| Segmentation |
|
Table of Contents
- 1. Introduction
- 1.1. Research Scope
- 1.2. Market Segmentation
- 1.3. Research Objective
- 1.4. Definitions and Assumptions
- 2. Executive Summary
- 2.1. Market Snapshot
- 3. Market Dynamics
- 3.1. Market Drivers
- 3.2. Market Restrains
- 3.3. Market Trends
- 3.4. Market Opportunities
- 4. Market Factor Analysis
- 4.1. Porters Five Forces
- 4.1.1. Bargaining Power of Suppliers
- 4.1.2. Bargaining Power of Buyers
- 4.1.3. Threat of New Entrants
- 4.1.4. Threat of Substitutes
- 4.1.5. Competitive Rivalry
- 4.2. PESTEL analysis
- 4.3. BCG Analysis
- 4.3.1. Stars (High Growth, High Market Share)
- 4.3.2. Cash Cows (Low Growth, High Market Share)
- 4.3.3. Question Mark (High Growth, Low Market Share)
- 4.3.4. Dogs (Low Growth, Low Market Share)
- 4.4. Ansoff Matrix Analysis
- 4.5. Supply Chain Analysis
- 4.6. Regulatory Landscape
- 4.7. Current Market Potential and Opportunity Assessment (TAM–SAM–SOM Framework)
- 4.8. VDR Analyst Note
- 4.1. Porters Five Forces
- 5. Market Analysis, Insights and Forecast 2021-2033
- 5.1. Market Analysis, Insights and Forecast - by Component
- 5.1.1. Hardware
- 5.1.2. Software
- 5.1.3. Services
- 5.2. Market Analysis, Insights and Forecast - by End User
- 5.2.1. Hospital-based EMR
- 5.2.2. Physician-based EMR
- 5.3. Market Analysis, Insights and Forecast - by Application
- 5.3.1. Cardiology
- 5.3.2. Neurology
- 5.3.3. Radiology
- 5.3.4. Oncology
- 5.3.5. Other Applications
- 5.4. Market Analysis, Insights and Forecast - by Type
- 5.4.1. Traditional EMRs
- 5.4.2. Speech enabled EMRs
- 5.4.3. Interoperable EMRs
- 5.4.4. Other Types
- 5.5. Market Analysis, Insights and Forecast - by Mode of Delivery
- 5.5.1. Cloud-based
- 5.5.2. On-premise Model
- 5.6. Market Analysis, Insights and Forecast - by Region
- 5.6.1. North America
- 5.6.2. Europe
- 5.6.3. Asia Pacific
- 5.6.4. Middle East and Africa
- 5.6.5. South America
- 5.1. Market Analysis, Insights and Forecast - by Component
- 6. Global Electronic Medical Records Industry Analysis, Insights and Forecast, 2021-2033
- 6.1. Market Analysis, Insights and Forecast - by Component
- 6.1.1. Hardware
- 6.1.2. Software
- 6.1.3. Services
- 6.2. Market Analysis, Insights and Forecast - by End User
- 6.2.1. Hospital-based EMR
- 6.2.2. Physician-based EMR
- 6.3. Market Analysis, Insights and Forecast - by Application
- 6.3.1. Cardiology
- 6.3.2. Neurology
- 6.3.3. Radiology
- 6.3.4. Oncology
- 6.3.5. Other Applications
- 6.4. Market Analysis, Insights and Forecast - by Type
- 6.4.1. Traditional EMRs
- 6.4.2. Speech enabled EMRs
- 6.4.3. Interoperable EMRs
- 6.4.4. Other Types
- 6.5. Market Analysis, Insights and Forecast - by Mode of Delivery
- 6.5.1. Cloud-based
- 6.5.2. On-premise Model
- 6.1. Market Analysis, Insights and Forecast - by Component
- 7. North America Electronic Medical Records Industry Analysis, Insights and Forecast, 2021-2033
- 7.1. Market Analysis, Insights and Forecast - by Component
- 7.1.1. Hardware
- 7.1.2. Software
- 7.1.3. Services
- 7.2. Market Analysis, Insights and Forecast - by End User
- 7.2.1. Hospital-based EMR
- 7.2.2. Physician-based EMR
- 7.3. Market Analysis, Insights and Forecast - by Application
- 7.3.1. Cardiology
- 7.3.2. Neurology
- 7.3.3. Radiology
- 7.3.4. Oncology
- 7.3.5. Other Applications
- 7.4. Market Analysis, Insights and Forecast - by Type
- 7.4.1. Traditional EMRs
- 7.4.2. Speech enabled EMRs
- 7.4.3. Interoperable EMRs
- 7.4.4. Other Types
- 7.5. Market Analysis, Insights and Forecast - by Mode of Delivery
- 7.5.1. Cloud-based
- 7.5.2. On-premise Model
- 7.1. Market Analysis, Insights and Forecast - by Component
- 8. Europe Electronic Medical Records Industry Analysis, Insights and Forecast, 2021-2033
- 8.1. Market Analysis, Insights and Forecast - by Component
- 8.1.1. Hardware
- 8.1.2. Software
- 8.1.3. Services
- 8.2. Market Analysis, Insights and Forecast - by End User
- 8.2.1. Hospital-based EMR
- 8.2.2. Physician-based EMR
- 8.3. Market Analysis, Insights and Forecast - by Application
- 8.3.1. Cardiology
- 8.3.2. Neurology
- 8.3.3. Radiology
- 8.3.4. Oncology
- 8.3.5. Other Applications
- 8.4. Market Analysis, Insights and Forecast - by Type
- 8.4.1. Traditional EMRs
- 8.4.2. Speech enabled EMRs
- 8.4.3. Interoperable EMRs
- 8.4.4. Other Types
- 8.5. Market Analysis, Insights and Forecast - by Mode of Delivery
- 8.5.1. Cloud-based
- 8.5.2. On-premise Model
- 8.1. Market Analysis, Insights and Forecast - by Component
- 9. Asia Pacific Electronic Medical Records Industry Analysis, Insights and Forecast, 2021-2033
- 9.1. Market Analysis, Insights and Forecast - by Component
- 9.1.1. Hardware
- 9.1.2. Software
- 9.1.3. Services
- 9.2. Market Analysis, Insights and Forecast - by End User
- 9.2.1. Hospital-based EMR
- 9.2.2. Physician-based EMR
- 9.3. Market Analysis, Insights and Forecast - by Application
- 9.3.1. Cardiology
- 9.3.2. Neurology
- 9.3.3. Radiology
- 9.3.4. Oncology
- 9.3.5. Other Applications
- 9.4. Market Analysis, Insights and Forecast - by Type
- 9.4.1. Traditional EMRs
- 9.4.2. Speech enabled EMRs
- 9.4.3. Interoperable EMRs
- 9.4.4. Other Types
- 9.5. Market Analysis, Insights and Forecast - by Mode of Delivery
- 9.5.1. Cloud-based
- 9.5.2. On-premise Model
- 9.1. Market Analysis, Insights and Forecast - by Component
- 10. Middle East and Africa Electronic Medical Records Industry Analysis, Insights and Forecast, 2021-2033
- 10.1. Market Analysis, Insights and Forecast - by Component
- 10.1.1. Hardware
- 10.1.2. Software
- 10.1.3. Services
- 10.2. Market Analysis, Insights and Forecast - by End User
- 10.2.1. Hospital-based EMR
- 10.2.2. Physician-based EMR
- 10.3. Market Analysis, Insights and Forecast - by Application
- 10.3.1. Cardiology
- 10.3.2. Neurology
- 10.3.3. Radiology
- 10.3.4. Oncology
- 10.3.5. Other Applications
- 10.4. Market Analysis, Insights and Forecast - by Type
- 10.4.1. Traditional EMRs
- 10.4.2. Speech enabled EMRs
- 10.4.3. Interoperable EMRs
- 10.4.4. Other Types
- 10.5. Market Analysis, Insights and Forecast - by Mode of Delivery
- 10.5.1. Cloud-based
- 10.5.2. On-premise Model
- 10.1. Market Analysis, Insights and Forecast - by Component
- 11. South America Electronic Medical Records Industry Analysis, Insights and Forecast, 2021-2033
- 11.1. Market Analysis, Insights and Forecast - by Component
- 11.1.1. Hardware
- 11.1.2. Software
- 11.1.3. Services
- 11.2. Market Analysis, Insights and Forecast - by End User
- 11.2.1. Hospital-based EMR
- 11.2.2. Physician-based EMR
- 11.3. Market Analysis, Insights and Forecast - by Application
- 11.3.1. Cardiology
- 11.3.2. Neurology
- 11.3.3. Radiology
- 11.3.4. Oncology
- 11.3.5. Other Applications
- 11.4. Market Analysis, Insights and Forecast - by Type
- 11.4.1. Traditional EMRs
- 11.4.2. Speech enabled EMRs
- 11.4.3. Interoperable EMRs
- 11.4.4. Other Types
- 11.5. Market Analysis, Insights and Forecast - by Mode of Delivery
- 11.5.1. Cloud-based
- 11.5.2. On-premise Model
- 11.1. Market Analysis, Insights and Forecast - by Component
- 12. Competitive Analysis
- 12.1. Company Profiles
- 12.1.1 eClinicalWorks
- 12.1.1.1. Company Overview
- 12.1.1.2. Products
- 12.1.1.3. Company Financials
- 12.1.1.4. SWOT Analysis
- 12.1.2 General Electronic Company (GE Healthcare)
- 12.1.2.1. Company Overview
- 12.1.2.2. Products
- 12.1.2.3. Company Financials
- 12.1.2.4. SWOT Analysis
- 12.1.3 Epic Systems Corporation
- 12.1.3.1. Company Overview
- 12.1.3.2. Products
- 12.1.3.3. Company Financials
- 12.1.3.4. SWOT Analysis
- 12.1.4 Medhost Inc
- 12.1.4.1. Company Overview
- 12.1.4.2. Products
- 12.1.4.3. Company Financials
- 12.1.4.4. SWOT Analysis
- 12.1.5 Cantata Health LLC
- 12.1.5.1. Company Overview
- 12.1.5.2. Products
- 12.1.5.3. Company Financials
- 12.1.5.4. SWOT Analysis
- 12.1.6 CareCloud Inc
- 12.1.6.1. Company Overview
- 12.1.6.2. Products
- 12.1.6.3. Company Financials
- 12.1.6.4. SWOT Analysis
- 12.1.7 Computer Programs and Systems Inc
- 12.1.7.1. Company Overview
- 12.1.7.2. Products
- 12.1.7.3. Company Financials
- 12.1.7.4. SWOT Analysis
- 12.1.8 Intersystems Corporation
- 12.1.8.1. Company Overview
- 12.1.8.2. Products
- 12.1.8.3. Company Financials
- 12.1.8.4. SWOT Analysis
- 12.1.9 Meditech
- 12.1.9.1. Company Overview
- 12.1.9.2. Products
- 12.1.9.3. Company Financials
- 12.1.9.4. SWOT Analysis
- 12.1.10 Greenway Health LLC
- 12.1.10.1. Company Overview
- 12.1.10.2. Products
- 12.1.10.3. Company Financials
- 12.1.10.4. SWOT Analysis
- 12.1.11 Allscripts Healthcare Solutions Inc
- 12.1.11.1. Company Overview
- 12.1.11.2. Products
- 12.1.11.3. Company Financials
- 12.1.11.4. SWOT Analysis
- 12.1.12 McKesson Corporation
- 12.1.12.1. Company Overview
- 12.1.12.2. Products
- 12.1.12.3. Company Financials
- 12.1.12.4. SWOT Analysis
- 12.1.13 Cerner Corporation (Oracle)
- 12.1.13.1. Company Overview
- 12.1.13.2. Products
- 12.1.13.3. Company Financials
- 12.1.13.4. SWOT Analysis
- 12.1.14 NextGen Healthcare Inc
- 12.1.14.1. Company Overview
- 12.1.14.2. Products
- 12.1.14.3. Company Financials
- 12.1.14.4. SWOT Analysis
- 12.1.15 Athenahealth Inc
- 12.1.15.1. Company Overview
- 12.1.15.2. Products
- 12.1.15.3. Company Financials
- 12.1.15.4. SWOT Analysis
- 12.1.1 eClinicalWorks
- 12.2. Market Entropy
- 12.2.1 Company's Key Areas Served
- 12.2.2 Recent Developments
- 12.3. Company Market Share Analysis 2025
- 12.3.1 Top 5 Companies Market Share Analysis
- 12.3.2 Top 3 Companies Market Share Analysis
- 12.4. List of Potential Customers
- 13. Research Methodology
List of Figures
- Figure 1: Global Electronic Medical Records Industry Revenue Breakdown (Million, %) by Region 2025 & 2033
- Figure 2: Global Electronic Medical Records Industry Volume Breakdown (K Unit, %) by Region 2025 & 2033
- Figure 3: North America Electronic Medical Records Industry Revenue (Million), by Component 2025 & 2033
- Figure 4: North America Electronic Medical Records Industry Volume (K Unit), by Component 2025 & 2033
- Figure 5: North America Electronic Medical Records Industry Revenue Share (%), by Component 2025 & 2033
- Figure 6: North America Electronic Medical Records Industry Volume Share (%), by Component 2025 & 2033
- Figure 7: North America Electronic Medical Records Industry Revenue (Million), by End User 2025 & 2033
- Figure 8: North America Electronic Medical Records Industry Volume (K Unit), by End User 2025 & 2033
- Figure 9: North America Electronic Medical Records Industry Revenue Share (%), by End User 2025 & 2033
- Figure 10: North America Electronic Medical Records Industry Volume Share (%), by End User 2025 & 2033
- Figure 11: North America Electronic Medical Records Industry Revenue (Million), by Application 2025 & 2033
- Figure 12: North America Electronic Medical Records Industry Volume (K Unit), by Application 2025 & 2033
- Figure 13: North America Electronic Medical Records Industry Revenue Share (%), by Application 2025 & 2033
- Figure 14: North America Electronic Medical Records Industry Volume Share (%), by Application 2025 & 2033
- Figure 15: North America Electronic Medical Records Industry Revenue (Million), by Type 2025 & 2033
- Figure 16: North America Electronic Medical Records Industry Volume (K Unit), by Type 2025 & 2033
- Figure 17: North America Electronic Medical Records Industry Revenue Share (%), by Type 2025 & 2033
- Figure 18: North America Electronic Medical Records Industry Volume Share (%), by Type 2025 & 2033
- Figure 19: North America Electronic Medical Records Industry Revenue (Million), by Mode of Delivery 2025 & 2033
- Figure 20: North America Electronic Medical Records Industry Volume (K Unit), by Mode of Delivery 2025 & 2033
- Figure 21: North America Electronic Medical Records Industry Revenue Share (%), by Mode of Delivery 2025 & 2033
- Figure 22: North America Electronic Medical Records Industry Volume Share (%), by Mode of Delivery 2025 & 2033
- Figure 23: North America Electronic Medical Records Industry Revenue (Million), by Country 2025 & 2033
- Figure 24: North America Electronic Medical Records Industry Volume (K Unit), by Country 2025 & 2033
- Figure 25: North America Electronic Medical Records Industry Revenue Share (%), by Country 2025 & 2033
- Figure 26: North America Electronic Medical Records Industry Volume Share (%), by Country 2025 & 2033
- Figure 27: Europe Electronic Medical Records Industry Revenue (Million), by Component 2025 & 2033
- Figure 28: Europe Electronic Medical Records Industry Volume (K Unit), by Component 2025 & 2033
- Figure 29: Europe Electronic Medical Records Industry Revenue Share (%), by Component 2025 & 2033
- Figure 30: Europe Electronic Medical Records Industry Volume Share (%), by Component 2025 & 2033
- Figure 31: Europe Electronic Medical Records Industry Revenue (Million), by End User 2025 & 2033
- Figure 32: Europe Electronic Medical Records Industry Volume (K Unit), by End User 2025 & 2033
- Figure 33: Europe Electronic Medical Records Industry Revenue Share (%), by End User 2025 & 2033
- Figure 34: Europe Electronic Medical Records Industry Volume Share (%), by End User 2025 & 2033
- Figure 35: Europe Electronic Medical Records Industry Revenue (Million), by Application 2025 & 2033
- Figure 36: Europe Electronic Medical Records Industry Volume (K Unit), by Application 2025 & 2033
- Figure 37: Europe Electronic Medical Records Industry Revenue Share (%), by Application 2025 & 2033
- Figure 38: Europe Electronic Medical Records Industry Volume Share (%), by Application 2025 & 2033
- Figure 39: Europe Electronic Medical Records Industry Revenue (Million), by Type 2025 & 2033
- Figure 40: Europe Electronic Medical Records Industry Volume (K Unit), by Type 2025 & 2033
- Figure 41: Europe Electronic Medical Records Industry Revenue Share (%), by Type 2025 & 2033
- Figure 42: Europe Electronic Medical Records Industry Volume Share (%), by Type 2025 & 2033
- Figure 43: Europe Electronic Medical Records Industry Revenue (Million), by Mode of Delivery 2025 & 2033
- Figure 44: Europe Electronic Medical Records Industry Volume (K Unit), by Mode of Delivery 2025 & 2033
- Figure 45: Europe Electronic Medical Records Industry Revenue Share (%), by Mode of Delivery 2025 & 2033
- Figure 46: Europe Electronic Medical Records Industry Volume Share (%), by Mode of Delivery 2025 & 2033
- Figure 47: Europe Electronic Medical Records Industry Revenue (Million), by Country 2025 & 2033
- Figure 48: Europe Electronic Medical Records Industry Volume (K Unit), by Country 2025 & 2033
- Figure 49: Europe Electronic Medical Records Industry Revenue Share (%), by Country 2025 & 2033
- Figure 50: Europe Electronic Medical Records Industry Volume Share (%), by Country 2025 & 2033
- Figure 51: Asia Pacific Electronic Medical Records Industry Revenue (Million), by Component 2025 & 2033
- Figure 52: Asia Pacific Electronic Medical Records Industry Volume (K Unit), by Component 2025 & 2033
- Figure 53: Asia Pacific Electronic Medical Records Industry Revenue Share (%), by Component 2025 & 2033
- Figure 54: Asia Pacific Electronic Medical Records Industry Volume Share (%), by Component 2025 & 2033
- Figure 55: Asia Pacific Electronic Medical Records Industry Revenue (Million), by End User 2025 & 2033
- Figure 56: Asia Pacific Electronic Medical Records Industry Volume (K Unit), by End User 2025 & 2033
- Figure 57: Asia Pacific Electronic Medical Records Industry Revenue Share (%), by End User 2025 & 2033
- Figure 58: Asia Pacific Electronic Medical Records Industry Volume Share (%), by End User 2025 & 2033
- Figure 59: Asia Pacific Electronic Medical Records Industry Revenue (Million), by Application 2025 & 2033
- Figure 60: Asia Pacific Electronic Medical Records Industry Volume (K Unit), by Application 2025 & 2033
- Figure 61: Asia Pacific Electronic Medical Records Industry Revenue Share (%), by Application 2025 & 2033
- Figure 62: Asia Pacific Electronic Medical Records Industry Volume Share (%), by Application 2025 & 2033
- Figure 63: Asia Pacific Electronic Medical Records Industry Revenue (Million), by Type 2025 & 2033
- Figure 64: Asia Pacific Electronic Medical Records Industry Volume (K Unit), by Type 2025 & 2033
- Figure 65: Asia Pacific Electronic Medical Records Industry Revenue Share (%), by Type 2025 & 2033
- Figure 66: Asia Pacific Electronic Medical Records Industry Volume Share (%), by Type 2025 & 2033
- Figure 67: Asia Pacific Electronic Medical Records Industry Revenue (Million), by Mode of Delivery 2025 & 2033
- Figure 68: Asia Pacific Electronic Medical Records Industry Volume (K Unit), by Mode of Delivery 2025 & 2033
- Figure 69: Asia Pacific Electronic Medical Records Industry Revenue Share (%), by Mode of Delivery 2025 & 2033
- Figure 70: Asia Pacific Electronic Medical Records Industry Volume Share (%), by Mode of Delivery 2025 & 2033
- Figure 71: Asia Pacific Electronic Medical Records Industry Revenue (Million), by Country 2025 & 2033
- Figure 72: Asia Pacific Electronic Medical Records Industry Volume (K Unit), by Country 2025 & 2033
- Figure 73: Asia Pacific Electronic Medical Records Industry Revenue Share (%), by Country 2025 & 2033
- Figure 74: Asia Pacific Electronic Medical Records Industry Volume Share (%), by Country 2025 & 2033
- Figure 75: Middle East and Africa Electronic Medical Records Industry Revenue (Million), by Component 2025 & 2033
- Figure 76: Middle East and Africa Electronic Medical Records Industry Volume (K Unit), by Component 2025 & 2033
- Figure 77: Middle East and Africa Electronic Medical Records Industry Revenue Share (%), by Component 2025 & 2033
- Figure 78: Middle East and Africa Electronic Medical Records Industry Volume Share (%), by Component 2025 & 2033
- Figure 79: Middle East and Africa Electronic Medical Records Industry Revenue (Million), by End User 2025 & 2033
- Figure 80: Middle East and Africa Electronic Medical Records Industry Volume (K Unit), by End User 2025 & 2033
- Figure 81: Middle East and Africa Electronic Medical Records Industry Revenue Share (%), by End User 2025 & 2033
- Figure 82: Middle East and Africa Electronic Medical Records Industry Volume Share (%), by End User 2025 & 2033
- Figure 83: Middle East and Africa Electronic Medical Records Industry Revenue (Million), by Application 2025 & 2033
- Figure 84: Middle East and Africa Electronic Medical Records Industry Volume (K Unit), by Application 2025 & 2033
- Figure 85: Middle East and Africa Electronic Medical Records Industry Revenue Share (%), by Application 2025 & 2033
- Figure 86: Middle East and Africa Electronic Medical Records Industry Volume Share (%), by Application 2025 & 2033
- Figure 87: Middle East and Africa Electronic Medical Records Industry Revenue (Million), by Type 2025 & 2033
- Figure 88: Middle East and Africa Electronic Medical Records Industry Volume (K Unit), by Type 2025 & 2033
- Figure 89: Middle East and Africa Electronic Medical Records Industry Revenue Share (%), by Type 2025 & 2033
- Figure 90: Middle East and Africa Electronic Medical Records Industry Volume Share (%), by Type 2025 & 2033
- Figure 91: Middle East and Africa Electronic Medical Records Industry Revenue (Million), by Mode of Delivery 2025 & 2033
- Figure 92: Middle East and Africa Electronic Medical Records Industry Volume (K Unit), by Mode of Delivery 2025 & 2033
- Figure 93: Middle East and Africa Electronic Medical Records Industry Revenue Share (%), by Mode of Delivery 2025 & 2033
- Figure 94: Middle East and Africa Electronic Medical Records Industry Volume Share (%), by Mode of Delivery 2025 & 2033
- Figure 95: Middle East and Africa Electronic Medical Records Industry Revenue (Million), by Country 2025 & 2033
- Figure 96: Middle East and Africa Electronic Medical Records Industry Volume (K Unit), by Country 2025 & 2033
- Figure 97: Middle East and Africa Electronic Medical Records Industry Revenue Share (%), by Country 2025 & 2033
- Figure 98: Middle East and Africa Electronic Medical Records Industry Volume Share (%), by Country 2025 & 2033
- Figure 99: South America Electronic Medical Records Industry Revenue (Million), by Component 2025 & 2033
- Figure 100: South America Electronic Medical Records Industry Volume (K Unit), by Component 2025 & 2033
- Figure 101: South America Electronic Medical Records Industry Revenue Share (%), by Component 2025 & 2033
- Figure 102: South America Electronic Medical Records Industry Volume Share (%), by Component 2025 & 2033
- Figure 103: South America Electronic Medical Records Industry Revenue (Million), by End User 2025 & 2033
- Figure 104: South America Electronic Medical Records Industry Volume (K Unit), by End User 2025 & 2033
- Figure 105: South America Electronic Medical Records Industry Revenue Share (%), by End User 2025 & 2033
- Figure 106: South America Electronic Medical Records Industry Volume Share (%), by End User 2025 & 2033
- Figure 107: South America Electronic Medical Records Industry Revenue (Million), by Application 2025 & 2033
- Figure 108: South America Electronic Medical Records Industry Volume (K Unit), by Application 2025 & 2033
- Figure 109: South America Electronic Medical Records Industry Revenue Share (%), by Application 2025 & 2033
- Figure 110: South America Electronic Medical Records Industry Volume Share (%), by Application 2025 & 2033
- Figure 111: South America Electronic Medical Records Industry Revenue (Million), by Type 2025 & 2033
- Figure 112: South America Electronic Medical Records Industry Volume (K Unit), by Type 2025 & 2033
- Figure 113: South America Electronic Medical Records Industry Revenue Share (%), by Type 2025 & 2033
- Figure 114: South America Electronic Medical Records Industry Volume Share (%), by Type 2025 & 2033
- Figure 115: South America Electronic Medical Records Industry Revenue (Million), by Mode of Delivery 2025 & 2033
- Figure 116: South America Electronic Medical Records Industry Volume (K Unit), by Mode of Delivery 2025 & 2033
- Figure 117: South America Electronic Medical Records Industry Revenue Share (%), by Mode of Delivery 2025 & 2033
- Figure 118: South America Electronic Medical Records Industry Volume Share (%), by Mode of Delivery 2025 & 2033
- Figure 119: South America Electronic Medical Records Industry Revenue (Million), by Country 2025 & 2033
- Figure 120: South America Electronic Medical Records Industry Volume (K Unit), by Country 2025 & 2033
- Figure 121: South America Electronic Medical Records Industry Revenue Share (%), by Country 2025 & 2033
- Figure 122: South America Electronic Medical Records Industry Volume Share (%), by Country 2025 & 2033
List of Tables
- Table 1: Global Electronic Medical Records Industry Revenue Million Forecast, by Component 2020 & 2033
- Table 2: Global Electronic Medical Records Industry Volume K Unit Forecast, by Component 2020 & 2033
- Table 3: Global Electronic Medical Records Industry Revenue Million Forecast, by End User 2020 & 2033
- Table 4: Global Electronic Medical Records Industry Volume K Unit Forecast, by End User 2020 & 2033
- Table 5: Global Electronic Medical Records Industry Revenue Million Forecast, by Application 2020 & 2033
- Table 6: Global Electronic Medical Records Industry Volume K Unit Forecast, by Application 2020 & 2033
- Table 7: Global Electronic Medical Records Industry Revenue Million Forecast, by Type 2020 & 2033
- Table 8: Global Electronic Medical Records Industry Volume K Unit Forecast, by Type 2020 & 2033
- Table 9: Global Electronic Medical Records Industry Revenue Million Forecast, by Mode of Delivery 2020 & 2033
- Table 10: Global Electronic Medical Records Industry Volume K Unit Forecast, by Mode of Delivery 2020 & 2033
- Table 11: Global Electronic Medical Records Industry Revenue Million Forecast, by Region 2020 & 2033
- Table 12: Global Electronic Medical Records Industry Volume K Unit Forecast, by Region 2020 & 2033
- Table 13: Global Electronic Medical Records Industry Revenue Million Forecast, by Component 2020 & 2033
- Table 14: Global Electronic Medical Records Industry Volume K Unit Forecast, by Component 2020 & 2033
- Table 15: Global Electronic Medical Records Industry Revenue Million Forecast, by End User 2020 & 2033
- Table 16: Global Electronic Medical Records Industry Volume K Unit Forecast, by End User 2020 & 2033
- Table 17: Global Electronic Medical Records Industry Revenue Million Forecast, by Application 2020 & 2033
- Table 18: Global Electronic Medical Records Industry Volume K Unit Forecast, by Application 2020 & 2033
- Table 19: Global Electronic Medical Records Industry Revenue Million Forecast, by Type 2020 & 2033
- Table 20: Global Electronic Medical Records Industry Volume K Unit Forecast, by Type 2020 & 2033
- Table 21: Global Electronic Medical Records Industry Revenue Million Forecast, by Mode of Delivery 2020 & 2033
- Table 22: Global Electronic Medical Records Industry Volume K Unit Forecast, by Mode of Delivery 2020 & 2033
- Table 23: Global Electronic Medical Records Industry Revenue Million Forecast, by Country 2020 & 2033
- Table 24: Global Electronic Medical Records Industry Volume K Unit Forecast, by Country 2020 & 2033
- Table 25: United States Electronic Medical Records Industry Revenue (Million) Forecast, by Application 2020 & 2033
- Table 26: United States Electronic Medical Records Industry Volume (K Unit) Forecast, by Application 2020 & 2033
- Table 27: Canada Electronic Medical Records Industry Revenue (Million) Forecast, by Application 2020 & 2033
- Table 28: Canada Electronic Medical Records Industry Volume (K Unit) Forecast, by Application 2020 & 2033
- Table 29: Mexico Electronic Medical Records Industry Revenue (Million) Forecast, by Application 2020 & 2033
- Table 30: Mexico Electronic Medical Records Industry Volume (K Unit) Forecast, by Application 2020 & 2033
- Table 31: Global Electronic Medical Records Industry Revenue Million Forecast, by Component 2020 & 2033
- Table 32: Global Electronic Medical Records Industry Volume K Unit Forecast, by Component 2020 & 2033
- Table 33: Global Electronic Medical Records Industry Revenue Million Forecast, by End User 2020 & 2033
- Table 34: Global Electronic Medical Records Industry Volume K Unit Forecast, by End User 2020 & 2033
- Table 35: Global Electronic Medical Records Industry Revenue Million Forecast, by Application 2020 & 2033
- Table 36: Global Electronic Medical Records Industry Volume K Unit Forecast, by Application 2020 & 2033
- Table 37: Global Electronic Medical Records Industry Revenue Million Forecast, by Type 2020 & 2033
- Table 38: Global Electronic Medical Records Industry Volume K Unit Forecast, by Type 2020 & 2033
- Table 39: Global Electronic Medical Records Industry Revenue Million Forecast, by Mode of Delivery 2020 & 2033
- Table 40: Global Electronic Medical Records Industry Volume K Unit Forecast, by Mode of Delivery 2020 & 2033
- Table 41: Global Electronic Medical Records Industry Revenue Million Forecast, by Country 2020 & 2033
- Table 42: Global Electronic Medical Records Industry Volume K Unit Forecast, by Country 2020 & 2033
- Table 43: Germany Electronic Medical Records Industry Revenue (Million) Forecast, by Application 2020 & 2033
- Table 44: Germany Electronic Medical Records Industry Volume (K Unit) Forecast, by Application 2020 & 2033
- Table 45: United Kingdom Electronic Medical Records Industry Revenue (Million) Forecast, by Application 2020 & 2033
- Table 46: United Kingdom Electronic Medical Records Industry Volume (K Unit) Forecast, by Application 2020 & 2033
- Table 47: France Electronic Medical Records Industry Revenue (Million) Forecast, by Application 2020 & 2033
- Table 48: France Electronic Medical Records Industry Volume (K Unit) Forecast, by Application 2020 & 2033
- Table 49: Italy Electronic Medical Records Industry Revenue (Million) Forecast, by Application 2020 & 2033
- Table 50: Italy Electronic Medical Records Industry Volume (K Unit) Forecast, by Application 2020 & 2033
- Table 51: Spain Electronic Medical Records Industry Revenue (Million) Forecast, by Application 2020 & 2033
- Table 52: Spain Electronic Medical Records Industry Volume (K Unit) Forecast, by Application 2020 & 2033
- Table 53: Rest of Europe Electronic Medical Records Industry Revenue (Million) Forecast, by Application 2020 & 2033
- Table 54: Rest of Europe Electronic Medical Records Industry Volume (K Unit) Forecast, by Application 2020 & 2033
- Table 55: Global Electronic Medical Records Industry Revenue Million Forecast, by Component 2020 & 2033
- Table 56: Global Electronic Medical Records Industry Volume K Unit Forecast, by Component 2020 & 2033
- Table 57: Global Electronic Medical Records Industry Revenue Million Forecast, by End User 2020 & 2033
- Table 58: Global Electronic Medical Records Industry Volume K Unit Forecast, by End User 2020 & 2033
- Table 59: Global Electronic Medical Records Industry Revenue Million Forecast, by Application 2020 & 2033
- Table 60: Global Electronic Medical Records Industry Volume K Unit Forecast, by Application 2020 & 2033
- Table 61: Global Electronic Medical Records Industry Revenue Million Forecast, by Type 2020 & 2033
- Table 62: Global Electronic Medical Records Industry Volume K Unit Forecast, by Type 2020 & 2033
- Table 63: Global Electronic Medical Records Industry Revenue Million Forecast, by Mode of Delivery 2020 & 2033
- Table 64: Global Electronic Medical Records Industry Volume K Unit Forecast, by Mode of Delivery 2020 & 2033
- Table 65: Global Electronic Medical Records Industry Revenue Million Forecast, by Country 2020 & 2033
- Table 66: Global Electronic Medical Records Industry Volume K Unit Forecast, by Country 2020 & 2033
- Table 67: China Electronic Medical Records Industry Revenue (Million) Forecast, by Application 2020 & 2033
- Table 68: China Electronic Medical Records Industry Volume (K Unit) Forecast, by Application 2020 & 2033
- Table 69: Japan Electronic Medical Records Industry Revenue (Million) Forecast, by Application 2020 & 2033
- Table 70: Japan Electronic Medical Records Industry Volume (K Unit) Forecast, by Application 2020 & 2033
- Table 71: India Electronic Medical Records Industry Revenue (Million) Forecast, by Application 2020 & 2033
- Table 72: India Electronic Medical Records Industry Volume (K Unit) Forecast, by Application 2020 & 2033
- Table 73: Australia Electronic Medical Records Industry Revenue (Million) Forecast, by Application 2020 & 2033
- Table 74: Australia Electronic Medical Records Industry Volume (K Unit) Forecast, by Application 2020 & 2033
- Table 75: South Korea Electronic Medical Records Industry Revenue (Million) Forecast, by Application 2020 & 2033
- Table 76: South Korea Electronic Medical Records Industry Volume (K Unit) Forecast, by Application 2020 & 2033
- Table 77: Rest of Asia Pacific Electronic Medical Records Industry Revenue (Million) Forecast, by Application 2020 & 2033
- Table 78: Rest of Asia Pacific Electronic Medical Records Industry Volume (K Unit) Forecast, by Application 2020 & 2033
- Table 79: Global Electronic Medical Records Industry Revenue Million Forecast, by Component 2020 & 2033
- Table 80: Global Electronic Medical Records Industry Volume K Unit Forecast, by Component 2020 & 2033
- Table 81: Global Electronic Medical Records Industry Revenue Million Forecast, by End User 2020 & 2033
- Table 82: Global Electronic Medical Records Industry Volume K Unit Forecast, by End User 2020 & 2033
- Table 83: Global Electronic Medical Records Industry Revenue Million Forecast, by Application 2020 & 2033
- Table 84: Global Electronic Medical Records Industry Volume K Unit Forecast, by Application 2020 & 2033
- Table 85: Global Electronic Medical Records Industry Revenue Million Forecast, by Type 2020 & 2033
- Table 86: Global Electronic Medical Records Industry Volume K Unit Forecast, by Type 2020 & 2033
- Table 87: Global Electronic Medical Records Industry Revenue Million Forecast, by Mode of Delivery 2020 & 2033
- Table 88: Global Electronic Medical Records Industry Volume K Unit Forecast, by Mode of Delivery 2020 & 2033
- Table 89: Global Electronic Medical Records Industry Revenue Million Forecast, by Country 2020 & 2033
- Table 90: Global Electronic Medical Records Industry Volume K Unit Forecast, by Country 2020 & 2033
- Table 91: GCC Electronic Medical Records Industry Revenue (Million) Forecast, by Application 2020 & 2033
- Table 92: GCC Electronic Medical Records Industry Volume (K Unit) Forecast, by Application 2020 & 2033
- Table 93: South Africa Electronic Medical Records Industry Revenue (Million) Forecast, by Application 2020 & 2033
- Table 94: South Africa Electronic Medical Records Industry Volume (K Unit) Forecast, by Application 2020 & 2033
- Table 95: Rest of Middle East and Africa Electronic Medical Records Industry Revenue (Million) Forecast, by Application 2020 & 2033
- Table 96: Rest of Middle East and Africa Electronic Medical Records Industry Volume (K Unit) Forecast, by Application 2020 & 2033
- Table 97: Global Electronic Medical Records Industry Revenue Million Forecast, by Component 2020 & 2033
- Table 98: Global Electronic Medical Records Industry Volume K Unit Forecast, by Component 2020 & 2033
- Table 99: Global Electronic Medical Records Industry Revenue Million Forecast, by End User 2020 & 2033
- Table 100: Global Electronic Medical Records Industry Volume K Unit Forecast, by End User 2020 & 2033
- Table 101: Global Electronic Medical Records Industry Revenue Million Forecast, by Application 2020 & 2033
- Table 102: Global Electronic Medical Records Industry Volume K Unit Forecast, by Application 2020 & 2033
- Table 103: Global Electronic Medical Records Industry Revenue Million Forecast, by Type 2020 & 2033
- Table 104: Global Electronic Medical Records Industry Volume K Unit Forecast, by Type 2020 & 2033
- Table 105: Global Electronic Medical Records Industry Revenue Million Forecast, by Mode of Delivery 2020 & 2033
- Table 106: Global Electronic Medical Records Industry Volume K Unit Forecast, by Mode of Delivery 2020 & 2033
- Table 107: Global Electronic Medical Records Industry Revenue Million Forecast, by Country 2020 & 2033
- Table 108: Global Electronic Medical Records Industry Volume K Unit Forecast, by Country 2020 & 2033
- Table 109: Brazil Electronic Medical Records Industry Revenue (Million) Forecast, by Application 2020 & 2033
- Table 110: Brazil Electronic Medical Records Industry Volume (K Unit) Forecast, by Application 2020 & 2033
- Table 111: Argentina Electronic Medical Records Industry Revenue (Million) Forecast, by Application 2020 & 2033
- Table 112: Argentina Electronic Medical Records Industry Volume (K Unit) Forecast, by Application 2020 & 2033
- Table 113: Rest of South America Electronic Medical Records Industry Revenue (Million) Forecast, by Application 2020 & 2033
- Table 114: Rest of South America Electronic Medical Records Industry Volume (K Unit) Forecast, by Application 2020 & 2033
Frequently Asked Questions
1. What is the projected Compound Annual Growth Rate (CAGR) of the Electronic Medical Records Industry?
The projected CAGR is approximately 5.11%.
2. Which companies are prominent players in the Electronic Medical Records Industry?
Key companies in the market include eClinicalWorks, General Electronic Company (GE Healthcare), Epic Systems Corporation, Medhost Inc, Cantata Health LLC, CareCloud Inc, Computer Programs and Systems Inc, Intersystems Corporation, Meditech, Greenway Health LLC, Allscripts Healthcare Solutions Inc, McKesson Corporation, Cerner Corporation (Oracle), NextGen Healthcare Inc, Athenahealth Inc.
3. What are the main segments of the Electronic Medical Records Industry?
The market segments include Component, End User, Application, Type, Mode of Delivery.
4. Can you provide details about the market size?
The market size is estimated to be USD 32.82 Million as of 2022.
5. What are some drivers contributing to market growth?
Initiatives by the Governments; Technological Advancements; Low Maintenance and Wider Accessibility.
6. What are the notable trends driving market growth?
The Cloud Based Segment is Expected to Witness Significant Growth Over the Forecast Period.
7. Are there any restraints impacting market growth?
Data Breaching; Shortage of Proper Trained Staff.
8. Can you provide examples of recent developments in the market?
November 2022- CareArc, a federally qualified health center (FQHC) in Kansas, launched an Epic EHR implementation through a partnership with Health Choice Network (HCN) to improve the patient experience.
9. What pricing options are available for accessing the report?
Pricing options include single-user, multi-user, and enterprise licenses priced at USD 4750, USD 5250, and USD 8750 respectively.
10. Is the market size provided in terms of value or volume?
The market size is provided in terms of value, measured in Million and volume, measured in K Unit.
11. Are there any specific market keywords associated with the report?
Yes, the market keyword associated with the report is "Electronic Medical Records Industry," which aids in identifying and referencing the specific market segment covered.
12. How do I determine which pricing option suits my needs best?
The pricing options vary based on user requirements and access needs. Individual users may opt for single-user licenses, while businesses requiring broader access may choose multi-user or enterprise licenses for cost-effective access to the report.
13. Are there any additional resources or data provided in the Electronic Medical Records Industry report?
While the report offers comprehensive insights, it's advisable to review the specific contents or supplementary materials provided to ascertain if additional resources or data are available.
14. How can I stay updated on further developments or reports in the Electronic Medical Records Industry?
To stay informed about further developments, trends, and reports in the Electronic Medical Records Industry, consider subscribing to industry newsletters, following relevant companies and organizations, or regularly checking reputable industry news sources and publications.
Methodology
Step 1 - Identification of Relevant Samples Size from Population Database


Step 2 - Approaches for Defining Global Market Size (Value, Volume* & Price*)

Note*: In applicable scenarios
Step 3 - Data Sources
Primary Research
- Web Analytics
- Survey Reports
- Research Institute
- Latest Research Reports
- Opinion Leaders
Secondary Research
- Annual Reports
- White Paper
- Latest Press Release
- Industry Association
- Paid Database
- Investor Presentations

Step 4 - Data Triangulation
Involves using different sources of information in order to increase the validity of a study
These sources are likely to be stakeholders in a program - participants, other researchers, program staff, other community members, and so on.
Then we put all data in single framework & apply various statistical tools to find out the dynamic on the market.
During the analysis stage, feedback from the stakeholder groups would be compared to determine areas of agreement as well as areas of divergence