
Key Insights
The global spinal cord stimulation (SCS) devices market is experiencing robust growth, driven by an aging population, increasing prevalence of chronic pain conditions like degenerative disk disease and failed back syndrome, and advancements in SCS technology. The market's compound annual growth rate (CAGR) of 8.50% from 2019 to 2024 suggests a significant expansion, projected to continue through 2033. Rechargeable devices are gaining traction due to improved patient comfort and longer battery life, compared to their non-rechargeable counterparts. The application segment for degenerative disk disease and failed back surgery dominates the market, reflecting the high incidence of these conditions. However, the "Others" segment, encompassing a range of indications, holds substantial potential for future expansion as clinical research expands and broader applications are approved. Key players like Medtronic, Boston Scientific, and Abbott Laboratories are at the forefront of innovation, constantly striving to improve device efficacy and minimize side effects. Regional analysis reveals that North America currently holds the largest market share, driven by high healthcare expenditure and technological advancements, followed by Europe and Asia Pacific. However, emerging economies in Asia Pacific are expected to witness significant growth in the coming years due to rising awareness and affordability of advanced medical technologies. The market is further shaped by factors such as increasing healthcare spending, rising disposable incomes in developing countries, and growing government initiatives aimed at improving healthcare infrastructure. Despite the positive outlook, market restraints include the high cost of SCS devices, potential side effects, and the limited availability of skilled professionals.
The forecast period (2025-2033) anticipates continued market expansion, fueled by technological innovation, especially in the development of targeted SCS therapies. This will likely lead to increased adoption across a wider range of pain conditions. Strategic partnerships, mergers, and acquisitions among key market players will further consolidate market dominance while driving competition. Furthermore, improved reimbursement policies and rising awareness among patients about the benefits of SCS are expected to further fuel market growth in the coming years. The market segmentation, encompassing various device types and applications, indicates significant opportunities for specialized treatment strategies and tailored device development. The ongoing research and development efforts toward personalized medicine and advanced diagnostic tools will contribute significantly to the market's continued growth.
Global Spinal Cord Stimulation Devices Market: A Comprehensive Report (2019-2033)
This comprehensive report provides an in-depth analysis of the global spinal cord stimulation (SCS) devices market, encompassing market dynamics, growth trends, regional segmentation, product landscape, key players, and future outlook. The report covers the period from 2019 to 2033, with 2025 serving as the base year and forecast period spanning 2025-2033. The historical period analyzed is 2019-2024. This report is crucial for investors, manufacturers, and healthcare professionals seeking to understand and capitalize on opportunities within this rapidly evolving medical technology sector. The parent market is the broader neuromodulation devices market, while the child market is specifically SCS devices for various applications. The total market size in 2025 is estimated at XXX million units.
Global Spinal Cord Stimulation Devices Market Dynamics & Structure
The global spinal cord stimulation devices market is characterized by moderate concentration, with several key players holding significant market share. Technological innovation, particularly in areas such as rechargeable devices and improved MRI compatibility, is a major growth driver. Stringent regulatory frameworks, such as FDA approvals, influence market access and adoption. Competitive substitutes include other pain management therapies like opioids and nerve blocks, impacting market penetration. End-user demographics are heavily influenced by the aging population and increasing prevalence of chronic pain conditions. M&A activity in the sector is moderate, with strategic acquisitions aimed at expanding product portfolios and market reach.
- Market Concentration: Moderately concentrated, with top 5 players holding approximately xx% market share in 2025.
- Technological Innovation: Focus on rechargeable devices, advanced lead technology, and improved MRI compatibility.
- Regulatory Frameworks: FDA approvals and CE markings are crucial for market entry and expansion.
- Competitive Substitutes: Opioid analgesics, nerve blocks, and other pain management techniques.
- End-User Demographics: Aging population and rise in chronic pain conditions drive demand.
- M&A Activity: xx major M&A deals recorded between 2019-2024, primarily focused on enhancing product portfolios and geographical reach.
Global Spinal Cord Stimulation Devices Market Growth Trends & Insights
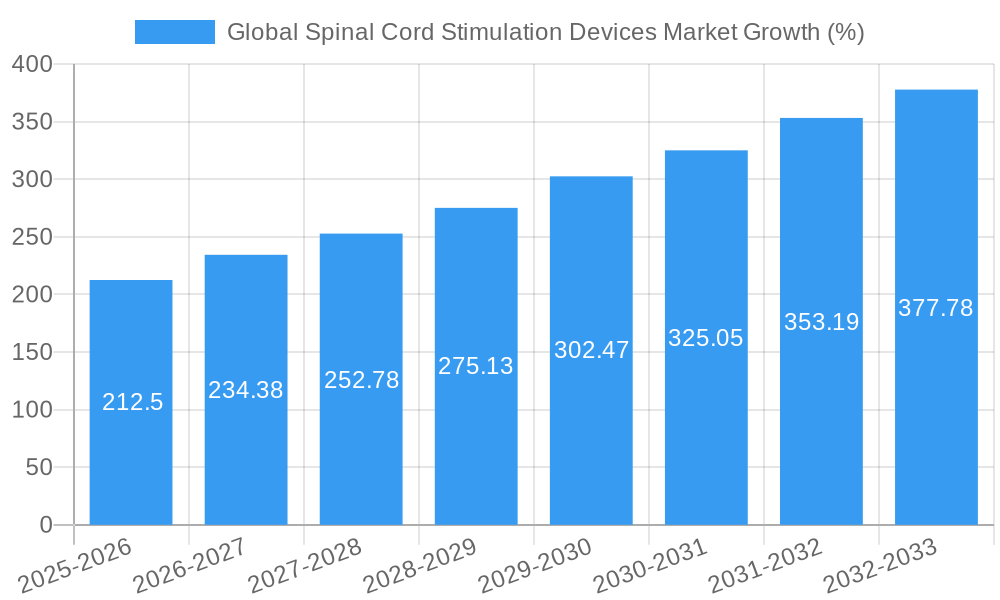
The global spinal cord stimulation devices market exhibits strong growth potential, driven by factors such as the rising prevalence of chronic pain conditions like failed back syndrome and degenerative disc disease. The market size is projected to experience a CAGR of xx% during the forecast period (2025-2033), reaching an estimated value of XXX million units by 2033. Increased adoption rates, particularly in developed regions, and technological advancements contributing to improved efficacy and safety profiles are key growth drivers. Shifts in consumer preference towards minimally invasive procedures are also contributing factors. Technological disruptions, particularly in the areas of wireless and implantable devices, are expected to reshape the market landscape.
Dominant Regions, Countries, or Segments in Global Spinal Cord Stimulation Devices Market
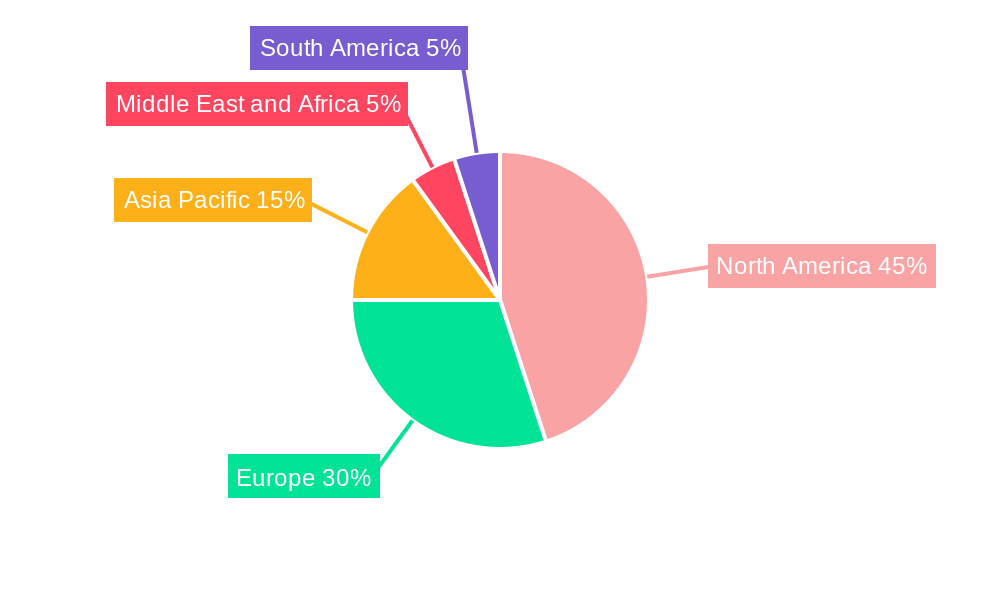
North America currently holds the largest market share, driven by high healthcare expenditure, advanced healthcare infrastructure, and early adoption of new technologies. Within device types, rechargeable SCS devices dominate the market due to improved patient convenience and longevity. The application segment of failed back syndrome represents a significant portion of the market, owing to its high prevalence and limited alternative treatment options.
- Leading Region: North America (xx% market share in 2025).
- Key Country: United States (largest market within North America).
- Dominant Device Type: Rechargeable (xx% market share in 2025).
- Leading Application: Failed Back Syndrome (xx% market share in 2025).
- Growth Drivers: High prevalence of chronic pain, advanced healthcare infrastructure, favorable reimbursement policies.
Global Spinal Cord Stimulation Devices Market Product Landscape
The market features a range of SCS devices, including rechargeable and non-rechargeable systems, varying in lead configurations, pulse generators, and implant techniques. Recent innovations focus on enhancing MRI compatibility, improving battery life, and providing more personalized therapy options through advanced programming features. Key selling propositions revolve around improved patient comfort, longer device lifespan, and enhanced efficacy in pain management. The integration of advanced features such as directional leads and closed-loop systems is transforming the SCS therapy landscape.
Key Drivers, Barriers & Challenges in Global Spinal Cord Stimulation Devices Market
Key Drivers:
- Rising prevalence of chronic pain conditions
- Technological advancements leading to improved device efficacy and safety.
- Favorable reimbursement policies in several countries.
- Increasing awareness among patients and physicians regarding SCS therapy.
Key Barriers & Challenges:
- High cost of devices and implantation procedures
- Potential complications associated with SCS implantation
- Limited reimbursement in certain regions
- Competition from alternative pain management therapies. The high cost of devices limits accessibility, particularly in emerging markets.
Emerging Opportunities in Global Spinal Cord Stimulation Devices Market
- Expansion into untapped markets in emerging economies.
- Development of innovative applications for SCS technology, including treatment of other neurological conditions.
- Personalized medicine approaches tailoring SCS therapy to individual patient needs.
- Growing demand for minimally invasive and remote monitoring capabilities.
Growth Accelerators in the Global Spinal Cord Stimulation Devices Market Industry
Technological breakthroughs in areas such as wireless and implantable devices are expected to significantly accelerate market growth. Strategic partnerships between device manufacturers and healthcare providers will facilitate improved market penetration and wider adoption. Furthermore, market expansion strategies targeting emerging economies with high unmet needs will contribute to long-term growth potential.
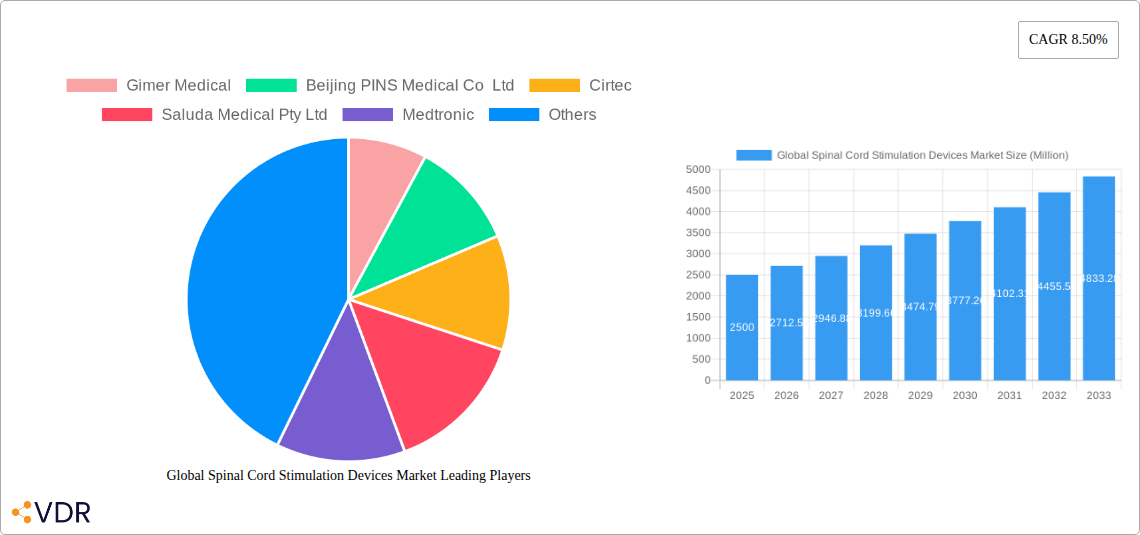
Key Players Shaping the Global Spinal Cord Stimulation Devices Market Market
- Gimer Medical
- Beijing PINS Medical Co Ltd
- Cirtec
- Saluda Medical Pty Ltd
- Medtronic
- Stimwave Technologies Inc
- NEVRO CORP
- Nalu Medical
- SYNAPSE BIOMEDICAL INC
- Abbott Laboratories Inc
- Boston Scientific Corporation
Notable Milestones in Global Spinal Cord Stimulation Devices Market Sector
- January 2022: Abbott received FDA approval for expanded MRI compatibility for its Proclaim XR SCS System.
- January 2022: Medtronic received FDA approval for its Intellis and Vanta spinal cord stimulators for diabetic neuropathy pain.
In-Depth Global Spinal Cord Stimulation Devices Market Market Outlook
The global spinal cord stimulation devices market is poised for continued growth, driven by technological advancements, expanding indications, and increased adoption rates. Strategic partnerships, investments in R&D, and focused market expansion strategies will be pivotal for companies to capitalize on the significant opportunities presented by this dynamic sector. The market's future potential is particularly strong in emerging economies and for novel applications of SCS technology.
Global Spinal Cord Stimulation Devices Market Segmentation
-
1. Device Type
- 1.1. Rechargeable
- 1.2. Non-rechargeable
-
2. Application
- 2.1. Degenerative Disk Disease
- 2.2. Failed Back Syndrome
- 2.3. Unsuccessful Disk Surgery
- 2.4. Others
Global Spinal Cord Stimulation Devices Market Segmentation By Geography
-
1. North America
- 1.1. United States
- 1.2. Canada
- 1.3. Mexico
-
2. Europe
- 2.1. Germany
- 2.2. United Kingdom
- 2.3. France
- 2.4. Italy
- 2.5. Spain
- 2.6. Rest of Europe
-
3. Asia Pacific
- 3.1. China
- 3.2. Japan
- 3.3. India
- 3.4. Australia
- 3.5. South Korea
- 3.6. Rest of Asia Pacific
-
4. Middle East and Africa
- 4.1. GCC
- 4.2. South Africa
- 4.3. Rest of Middle East and Africa
-
5. South America
- 5.1. Brazil
- 5.2. Argentina
- 5.3. Rest of South America
Global Spinal Cord Stimulation Devices Market REPORT HIGHLIGHTS
| Aspects | Details |
|---|---|
| Study Period | 2019-2033 |
| Base Year | 2024 |
| Estimated Year | 2025 |
| Forecast Period | 2025-2033 |
| Historical Period | 2019-2024 |
| Growth Rate | CAGR of 8.50% from 2019-2033 |
| Segmentation |
|
Table of Contents
- 1. Introduction
- 1.1. Research Scope
- 1.2. Market Segmentation
- 1.3. Research Methodology
- 1.4. Definitions and Assumptions
- 2. Executive Summary
- 2.1. Introduction
- 3. Market Dynamics
- 3.1. Introduction
- 3.2. Market Drivers
- 3.2.1. Rising Burden of Spinal Disorders; Availability of Medical Reimbursements
- 3.3. Market Restrains
- 3.3.1. Risks Associated with Spinal Cord Stimulation Devices
- 3.4. Market Trends
- 3.4.1. Degenerative Disk Disease Segment is Expected to Hold a Significant Market Share Over the Forecast Period
- 4. Market Factor Analysis
- 4.1. Porters Five Forces
- 4.2. Supply/Value Chain
- 4.3. PESTEL analysis
- 4.4. Market Entropy
- 4.5. Patent/Trademark Analysis
- 5. Global Spinal Cord Stimulation Devices Market Analysis, Insights and Forecast, 2019-2031
- 5.1. Market Analysis, Insights and Forecast - by Device Type
- 5.1.1. Rechargeable
- 5.1.2. Non-rechargeable
- 5.2. Market Analysis, Insights and Forecast - by Application
- 5.2.1. Degenerative Disk Disease
- 5.2.2. Failed Back Syndrome
- 5.2.3. Unsuccessful Disk Surgery
- 5.2.4. Others
- 5.3. Market Analysis, Insights and Forecast - by Region
- 5.3.1. North America
- 5.3.2. Europe
- 5.3.3. Asia Pacific
- 5.3.4. Middle East and Africa
- 5.3.5. South America
- 5.1. Market Analysis, Insights and Forecast - by Device Type
- 6. North America Global Spinal Cord Stimulation Devices Market Analysis, Insights and Forecast, 2019-2031
- 6.1. Market Analysis, Insights and Forecast - by Device Type
- 6.1.1. Rechargeable
- 6.1.2. Non-rechargeable
- 6.2. Market Analysis, Insights and Forecast - by Application
- 6.2.1. Degenerative Disk Disease
- 6.2.2. Failed Back Syndrome
- 6.2.3. Unsuccessful Disk Surgery
- 6.2.4. Others
- 6.1. Market Analysis, Insights and Forecast - by Device Type
- 7. Europe Global Spinal Cord Stimulation Devices Market Analysis, Insights and Forecast, 2019-2031
- 7.1. Market Analysis, Insights and Forecast - by Device Type
- 7.1.1. Rechargeable
- 7.1.2. Non-rechargeable
- 7.2. Market Analysis, Insights and Forecast - by Application
- 7.2.1. Degenerative Disk Disease
- 7.2.2. Failed Back Syndrome
- 7.2.3. Unsuccessful Disk Surgery
- 7.2.4. Others
- 7.1. Market Analysis, Insights and Forecast - by Device Type
- 8. Asia Pacific Global Spinal Cord Stimulation Devices Market Analysis, Insights and Forecast, 2019-2031
- 8.1. Market Analysis, Insights and Forecast - by Device Type
- 8.1.1. Rechargeable
- 8.1.2. Non-rechargeable
- 8.2. Market Analysis, Insights and Forecast - by Application
- 8.2.1. Degenerative Disk Disease
- 8.2.2. Failed Back Syndrome
- 8.2.3. Unsuccessful Disk Surgery
- 8.2.4. Others
- 8.1. Market Analysis, Insights and Forecast - by Device Type
- 9. Middle East and Africa Global Spinal Cord Stimulation Devices Market Analysis, Insights and Forecast, 2019-2031
- 9.1. Market Analysis, Insights and Forecast - by Device Type
- 9.1.1. Rechargeable
- 9.1.2. Non-rechargeable
- 9.2. Market Analysis, Insights and Forecast - by Application
- 9.2.1. Degenerative Disk Disease
- 9.2.2. Failed Back Syndrome
- 9.2.3. Unsuccessful Disk Surgery
- 9.2.4. Others
- 9.1. Market Analysis, Insights and Forecast - by Device Type
- 10. South America Global Spinal Cord Stimulation Devices Market Analysis, Insights and Forecast, 2019-2031
- 10.1. Market Analysis, Insights and Forecast - by Device Type
- 10.1.1. Rechargeable
- 10.1.2. Non-rechargeable
- 10.2. Market Analysis, Insights and Forecast - by Application
- 10.2.1. Degenerative Disk Disease
- 10.2.2. Failed Back Syndrome
- 10.2.3. Unsuccessful Disk Surgery
- 10.2.4. Others
- 10.1. Market Analysis, Insights and Forecast - by Device Type
- 11. North America Global Spinal Cord Stimulation Devices Market Analysis, Insights and Forecast, 2019-2031
- 11.1. Market Analysis, Insights and Forecast - By Country/Sub-region
- 11.1.1 United States
- 11.1.2 Canada
- 11.1.3 Mexico
- 12. Europe Global Spinal Cord Stimulation Devices Market Analysis, Insights and Forecast, 2019-2031
- 12.1. Market Analysis, Insights and Forecast - By Country/Sub-region
- 12.1.1 Germany
- 12.1.2 United Kingdom
- 12.1.3 France
- 12.1.4 Italy
- 12.1.5 Spain
- 12.1.6 Rest of Europe
- 13. Asia Pacific Global Spinal Cord Stimulation Devices Market Analysis, Insights and Forecast, 2019-2031
- 13.1. Market Analysis, Insights and Forecast - By Country/Sub-region
- 13.1.1 China
- 13.1.2 Japan
- 13.1.3 India
- 13.1.4 Australia
- 13.1.5 South Korea
- 13.1.6 Rest of Asia Pacific
- 14. Middle East and Africa Global Spinal Cord Stimulation Devices Market Analysis, Insights and Forecast, 2019-2031
- 14.1. Market Analysis, Insights and Forecast - By Country/Sub-region
- 14.1.1 GCC
- 14.1.2 South Africa
- 14.1.3 Rest of Middle East and Africa
- 15. South America Global Spinal Cord Stimulation Devices Market Analysis, Insights and Forecast, 2019-2031
- 15.1. Market Analysis, Insights and Forecast - By Country/Sub-region
- 15.1.1 Brazil
- 15.1.2 Argentina
- 15.1.3 Rest of South America
- 16. Competitive Analysis
- 16.1. Market Share Analysis 2024
- 16.2. Company Profiles
- 16.2.1 Gimer Medical
- 16.2.1.1. Overview
- 16.2.1.2. Products
- 16.2.1.3. SWOT Analysis
- 16.2.1.4. Recent Developments
- 16.2.1.5. Financials (Based on Availability)
- 16.2.2 Beijing PINS Medical Co Ltd
- 16.2.2.1. Overview
- 16.2.2.2. Products
- 16.2.2.3. SWOT Analysis
- 16.2.2.4. Recent Developments
- 16.2.2.5. Financials (Based on Availability)
- 16.2.3 Cirtec
- 16.2.3.1. Overview
- 16.2.3.2. Products
- 16.2.3.3. SWOT Analysis
- 16.2.3.4. Recent Developments
- 16.2.3.5. Financials (Based on Availability)
- 16.2.4 Saluda Medical Pty Ltd
- 16.2.4.1. Overview
- 16.2.4.2. Products
- 16.2.4.3. SWOT Analysis
- 16.2.4.4. Recent Developments
- 16.2.4.5. Financials (Based on Availability)
- 16.2.5 Medtronic
- 16.2.5.1. Overview
- 16.2.5.2. Products
- 16.2.5.3. SWOT Analysis
- 16.2.5.4. Recent Developments
- 16.2.5.5. Financials (Based on Availability)
- 16.2.6 Stimwave Technologies Inc
- 16.2.6.1. Overview
- 16.2.6.2. Products
- 16.2.6.3. SWOT Analysis
- 16.2.6.4. Recent Developments
- 16.2.6.5. Financials (Based on Availability)
- 16.2.7 NEVRO CORP
- 16.2.7.1. Overview
- 16.2.7.2. Products
- 16.2.7.3. SWOT Analysis
- 16.2.7.4. Recent Developments
- 16.2.7.5. Financials (Based on Availability)
- 16.2.8 Nalu Medical
- 16.2.8.1. Overview
- 16.2.8.2. Products
- 16.2.8.3. SWOT Analysis
- 16.2.8.4. Recent Developments
- 16.2.8.5. Financials (Based on Availability)
- 16.2.9 SYNAPSE BIOMEDICAL INC
- 16.2.9.1. Overview
- 16.2.9.2. Products
- 16.2.9.3. SWOT Analysis
- 16.2.9.4. Recent Developments
- 16.2.9.5. Financials (Based on Availability)
- 16.2.10 Abbott Laboratories Inc
- 16.2.10.1. Overview
- 16.2.10.2. Products
- 16.2.10.3. SWOT Analysis
- 16.2.10.4. Recent Developments
- 16.2.10.5. Financials (Based on Availability)
- 16.2.11 Boston Scientific Corporation
- 16.2.11.1. Overview
- 16.2.11.2. Products
- 16.2.11.3. SWOT Analysis
- 16.2.11.4. Recent Developments
- 16.2.11.5. Financials (Based on Availability)
- 16.2.1 Gimer Medical
List of Figures
- Figure 1: Global Global Spinal Cord Stimulation Devices Market Revenue Breakdown (Million, %) by Region 2024 & 2032
- Figure 2: Global Global Spinal Cord Stimulation Devices Market Volume Breakdown (K Unit, %) by Region 2024 & 2032
- Figure 3: North America Global Spinal Cord Stimulation Devices Market Revenue (Million), by Country 2024 & 2032
- Figure 4: North America Global Spinal Cord Stimulation Devices Market Volume (K Unit), by Country 2024 & 2032
- Figure 5: North America Global Spinal Cord Stimulation Devices Market Revenue Share (%), by Country 2024 & 2032
- Figure 6: North America Global Spinal Cord Stimulation Devices Market Volume Share (%), by Country 2024 & 2032
- Figure 7: Europe Global Spinal Cord Stimulation Devices Market Revenue (Million), by Country 2024 & 2032
- Figure 8: Europe Global Spinal Cord Stimulation Devices Market Volume (K Unit), by Country 2024 & 2032
- Figure 9: Europe Global Spinal Cord Stimulation Devices Market Revenue Share (%), by Country 2024 & 2032
- Figure 10: Europe Global Spinal Cord Stimulation Devices Market Volume Share (%), by Country 2024 & 2032
- Figure 11: Asia Pacific Global Spinal Cord Stimulation Devices Market Revenue (Million), by Country 2024 & 2032
- Figure 12: Asia Pacific Global Spinal Cord Stimulation Devices Market Volume (K Unit), by Country 2024 & 2032
- Figure 13: Asia Pacific Global Spinal Cord Stimulation Devices Market Revenue Share (%), by Country 2024 & 2032
- Figure 14: Asia Pacific Global Spinal Cord Stimulation Devices Market Volume Share (%), by Country 2024 & 2032
- Figure 15: Middle East and Africa Global Spinal Cord Stimulation Devices Market Revenue (Million), by Country 2024 & 2032
- Figure 16: Middle East and Africa Global Spinal Cord Stimulation Devices Market Volume (K Unit), by Country 2024 & 2032
- Figure 17: Middle East and Africa Global Spinal Cord Stimulation Devices Market Revenue Share (%), by Country 2024 & 2032
- Figure 18: Middle East and Africa Global Spinal Cord Stimulation Devices Market Volume Share (%), by Country 2024 & 2032
- Figure 19: South America Global Spinal Cord Stimulation Devices Market Revenue (Million), by Country 2024 & 2032
- Figure 20: South America Global Spinal Cord Stimulation Devices Market Volume (K Unit), by Country 2024 & 2032
- Figure 21: South America Global Spinal Cord Stimulation Devices Market Revenue Share (%), by Country 2024 & 2032
- Figure 22: South America Global Spinal Cord Stimulation Devices Market Volume Share (%), by Country 2024 & 2032
- Figure 23: North America Global Spinal Cord Stimulation Devices Market Revenue (Million), by Device Type 2024 & 2032
- Figure 24: North America Global Spinal Cord Stimulation Devices Market Volume (K Unit), by Device Type 2024 & 2032
- Figure 25: North America Global Spinal Cord Stimulation Devices Market Revenue Share (%), by Device Type 2024 & 2032
- Figure 26: North America Global Spinal Cord Stimulation Devices Market Volume Share (%), by Device Type 2024 & 2032
- Figure 27: North America Global Spinal Cord Stimulation Devices Market Revenue (Million), by Application 2024 & 2032
- Figure 28: North America Global Spinal Cord Stimulation Devices Market Volume (K Unit), by Application 2024 & 2032
- Figure 29: North America Global Spinal Cord Stimulation Devices Market Revenue Share (%), by Application 2024 & 2032
- Figure 30: North America Global Spinal Cord Stimulation Devices Market Volume Share (%), by Application 2024 & 2032
- Figure 31: North America Global Spinal Cord Stimulation Devices Market Revenue (Million), by Country 2024 & 2032
- Figure 32: North America Global Spinal Cord Stimulation Devices Market Volume (K Unit), by Country 2024 & 2032
- Figure 33: North America Global Spinal Cord Stimulation Devices Market Revenue Share (%), by Country 2024 & 2032
- Figure 34: North America Global Spinal Cord Stimulation Devices Market Volume Share (%), by Country 2024 & 2032
- Figure 35: Europe Global Spinal Cord Stimulation Devices Market Revenue (Million), by Device Type 2024 & 2032
- Figure 36: Europe Global Spinal Cord Stimulation Devices Market Volume (K Unit), by Device Type 2024 & 2032
- Figure 37: Europe Global Spinal Cord Stimulation Devices Market Revenue Share (%), by Device Type 2024 & 2032
- Figure 38: Europe Global Spinal Cord Stimulation Devices Market Volume Share (%), by Device Type 2024 & 2032
- Figure 39: Europe Global Spinal Cord Stimulation Devices Market Revenue (Million), by Application 2024 & 2032
- Figure 40: Europe Global Spinal Cord Stimulation Devices Market Volume (K Unit), by Application 2024 & 2032
- Figure 41: Europe Global Spinal Cord Stimulation Devices Market Revenue Share (%), by Application 2024 & 2032
- Figure 42: Europe Global Spinal Cord Stimulation Devices Market Volume Share (%), by Application 2024 & 2032
- Figure 43: Europe Global Spinal Cord Stimulation Devices Market Revenue (Million), by Country 2024 & 2032
- Figure 44: Europe Global Spinal Cord Stimulation Devices Market Volume (K Unit), by Country 2024 & 2032
- Figure 45: Europe Global Spinal Cord Stimulation Devices Market Revenue Share (%), by Country 2024 & 2032
- Figure 46: Europe Global Spinal Cord Stimulation Devices Market Volume Share (%), by Country 2024 & 2032
- Figure 47: Asia Pacific Global Spinal Cord Stimulation Devices Market Revenue (Million), by Device Type 2024 & 2032
- Figure 48: Asia Pacific Global Spinal Cord Stimulation Devices Market Volume (K Unit), by Device Type 2024 & 2032
- Figure 49: Asia Pacific Global Spinal Cord Stimulation Devices Market Revenue Share (%), by Device Type 2024 & 2032
- Figure 50: Asia Pacific Global Spinal Cord Stimulation Devices Market Volume Share (%), by Device Type 2024 & 2032
- Figure 51: Asia Pacific Global Spinal Cord Stimulation Devices Market Revenue (Million), by Application 2024 & 2032
- Figure 52: Asia Pacific Global Spinal Cord Stimulation Devices Market Volume (K Unit), by Application 2024 & 2032
- Figure 53: Asia Pacific Global Spinal Cord Stimulation Devices Market Revenue Share (%), by Application 2024 & 2032
- Figure 54: Asia Pacific Global Spinal Cord Stimulation Devices Market Volume Share (%), by Application 2024 & 2032
- Figure 55: Asia Pacific Global Spinal Cord Stimulation Devices Market Revenue (Million), by Country 2024 & 2032
- Figure 56: Asia Pacific Global Spinal Cord Stimulation Devices Market Volume (K Unit), by Country 2024 & 2032
- Figure 57: Asia Pacific Global Spinal Cord Stimulation Devices Market Revenue Share (%), by Country 2024 & 2032
- Figure 58: Asia Pacific Global Spinal Cord Stimulation Devices Market Volume Share (%), by Country 2024 & 2032
- Figure 59: Middle East and Africa Global Spinal Cord Stimulation Devices Market Revenue (Million), by Device Type 2024 & 2032
- Figure 60: Middle East and Africa Global Spinal Cord Stimulation Devices Market Volume (K Unit), by Device Type 2024 & 2032
- Figure 61: Middle East and Africa Global Spinal Cord Stimulation Devices Market Revenue Share (%), by Device Type 2024 & 2032
- Figure 62: Middle East and Africa Global Spinal Cord Stimulation Devices Market Volume Share (%), by Device Type 2024 & 2032
- Figure 63: Middle East and Africa Global Spinal Cord Stimulation Devices Market Revenue (Million), by Application 2024 & 2032
- Figure 64: Middle East and Africa Global Spinal Cord Stimulation Devices Market Volume (K Unit), by Application 2024 & 2032
- Figure 65: Middle East and Africa Global Spinal Cord Stimulation Devices Market Revenue Share (%), by Application 2024 & 2032
- Figure 66: Middle East and Africa Global Spinal Cord Stimulation Devices Market Volume Share (%), by Application 2024 & 2032
- Figure 67: Middle East and Africa Global Spinal Cord Stimulation Devices Market Revenue (Million), by Country 2024 & 2032
- Figure 68: Middle East and Africa Global Spinal Cord Stimulation Devices Market Volume (K Unit), by Country 2024 & 2032
- Figure 69: Middle East and Africa Global Spinal Cord Stimulation Devices Market Revenue Share (%), by Country 2024 & 2032
- Figure 70: Middle East and Africa Global Spinal Cord Stimulation Devices Market Volume Share (%), by Country 2024 & 2032
- Figure 71: South America Global Spinal Cord Stimulation Devices Market Revenue (Million), by Device Type 2024 & 2032
- Figure 72: South America Global Spinal Cord Stimulation Devices Market Volume (K Unit), by Device Type 2024 & 2032
- Figure 73: South America Global Spinal Cord Stimulation Devices Market Revenue Share (%), by Device Type 2024 & 2032
- Figure 74: South America Global Spinal Cord Stimulation Devices Market Volume Share (%), by Device Type 2024 & 2032
- Figure 75: South America Global Spinal Cord Stimulation Devices Market Revenue (Million), by Application 2024 & 2032
- Figure 76: South America Global Spinal Cord Stimulation Devices Market Volume (K Unit), by Application 2024 & 2032
- Figure 77: South America Global Spinal Cord Stimulation Devices Market Revenue Share (%), by Application 2024 & 2032
- Figure 78: South America Global Spinal Cord Stimulation Devices Market Volume Share (%), by Application 2024 & 2032
- Figure 79: South America Global Spinal Cord Stimulation Devices Market Revenue (Million), by Country 2024 & 2032
- Figure 80: South America Global Spinal Cord Stimulation Devices Market Volume (K Unit), by Country 2024 & 2032
- Figure 81: South America Global Spinal Cord Stimulation Devices Market Revenue Share (%), by Country 2024 & 2032
- Figure 82: South America Global Spinal Cord Stimulation Devices Market Volume Share (%), by Country 2024 & 2032
List of Tables
- Table 1: Global Spinal Cord Stimulation Devices Market Revenue Million Forecast, by Region 2019 & 2032
- Table 2: Global Spinal Cord Stimulation Devices Market Volume K Unit Forecast, by Region 2019 & 2032
- Table 3: Global Spinal Cord Stimulation Devices Market Revenue Million Forecast, by Device Type 2019 & 2032
- Table 4: Global Spinal Cord Stimulation Devices Market Volume K Unit Forecast, by Device Type 2019 & 2032
- Table 5: Global Spinal Cord Stimulation Devices Market Revenue Million Forecast, by Application 2019 & 2032
- Table 6: Global Spinal Cord Stimulation Devices Market Volume K Unit Forecast, by Application 2019 & 2032
- Table 7: Global Spinal Cord Stimulation Devices Market Revenue Million Forecast, by Region 2019 & 2032
- Table 8: Global Spinal Cord Stimulation Devices Market Volume K Unit Forecast, by Region 2019 & 2032
- Table 9: Global Spinal Cord Stimulation Devices Market Revenue Million Forecast, by Country 2019 & 2032
- Table 10: Global Spinal Cord Stimulation Devices Market Volume K Unit Forecast, by Country 2019 & 2032
- Table 11: United States Global Spinal Cord Stimulation Devices Market Revenue (Million) Forecast, by Application 2019 & 2032
- Table 12: United States Global Spinal Cord Stimulation Devices Market Volume (K Unit) Forecast, by Application 2019 & 2032
- Table 13: Canada Global Spinal Cord Stimulation Devices Market Revenue (Million) Forecast, by Application 2019 & 2032
- Table 14: Canada Global Spinal Cord Stimulation Devices Market Volume (K Unit) Forecast, by Application 2019 & 2032
- Table 15: Mexico Global Spinal Cord Stimulation Devices Market Revenue (Million) Forecast, by Application 2019 & 2032
- Table 16: Mexico Global Spinal Cord Stimulation Devices Market Volume (K Unit) Forecast, by Application 2019 & 2032
- Table 17: Global Spinal Cord Stimulation Devices Market Revenue Million Forecast, by Country 2019 & 2032
- Table 18: Global Spinal Cord Stimulation Devices Market Volume K Unit Forecast, by Country 2019 & 2032
- Table 19: Germany Global Spinal Cord Stimulation Devices Market Revenue (Million) Forecast, by Application 2019 & 2032
- Table 20: Germany Global Spinal Cord Stimulation Devices Market Volume (K Unit) Forecast, by Application 2019 & 2032
- Table 21: United Kingdom Global Spinal Cord Stimulation Devices Market Revenue (Million) Forecast, by Application 2019 & 2032
- Table 22: United Kingdom Global Spinal Cord Stimulation Devices Market Volume (K Unit) Forecast, by Application 2019 & 2032
- Table 23: France Global Spinal Cord Stimulation Devices Market Revenue (Million) Forecast, by Application 2019 & 2032
- Table 24: France Global Spinal Cord Stimulation Devices Market Volume (K Unit) Forecast, by Application 2019 & 2032
- Table 25: Italy Global Spinal Cord Stimulation Devices Market Revenue (Million) Forecast, by Application 2019 & 2032
- Table 26: Italy Global Spinal Cord Stimulation Devices Market Volume (K Unit) Forecast, by Application 2019 & 2032
- Table 27: Spain Global Spinal Cord Stimulation Devices Market Revenue (Million) Forecast, by Application 2019 & 2032
- Table 28: Spain Global Spinal Cord Stimulation Devices Market Volume (K Unit) Forecast, by Application 2019 & 2032
- Table 29: Rest of Europe Global Spinal Cord Stimulation Devices Market Revenue (Million) Forecast, by Application 2019 & 2032
- Table 30: Rest of Europe Global Spinal Cord Stimulation Devices Market Volume (K Unit) Forecast, by Application 2019 & 2032
- Table 31: Global Spinal Cord Stimulation Devices Market Revenue Million Forecast, by Country 2019 & 2032
- Table 32: Global Spinal Cord Stimulation Devices Market Volume K Unit Forecast, by Country 2019 & 2032
- Table 33: China Global Spinal Cord Stimulation Devices Market Revenue (Million) Forecast, by Application 2019 & 2032
- Table 34: China Global Spinal Cord Stimulation Devices Market Volume (K Unit) Forecast, by Application 2019 & 2032
- Table 35: Japan Global Spinal Cord Stimulation Devices Market Revenue (Million) Forecast, by Application 2019 & 2032
- Table 36: Japan Global Spinal Cord Stimulation Devices Market Volume (K Unit) Forecast, by Application 2019 & 2032
- Table 37: India Global Spinal Cord Stimulation Devices Market Revenue (Million) Forecast, by Application 2019 & 2032
- Table 38: India Global Spinal Cord Stimulation Devices Market Volume (K Unit) Forecast, by Application 2019 & 2032
- Table 39: Australia Global Spinal Cord Stimulation Devices Market Revenue (Million) Forecast, by Application 2019 & 2032
- Table 40: Australia Global Spinal Cord Stimulation Devices Market Volume (K Unit) Forecast, by Application 2019 & 2032
- Table 41: South Korea Global Spinal Cord Stimulation Devices Market Revenue (Million) Forecast, by Application 2019 & 2032
- Table 42: South Korea Global Spinal Cord Stimulation Devices Market Volume (K Unit) Forecast, by Application 2019 & 2032
- Table 43: Rest of Asia Pacific Global Spinal Cord Stimulation Devices Market Revenue (Million) Forecast, by Application 2019 & 2032
- Table 44: Rest of Asia Pacific Global Spinal Cord Stimulation Devices Market Volume (K Unit) Forecast, by Application 2019 & 2032
- Table 45: Global Spinal Cord Stimulation Devices Market Revenue Million Forecast, by Country 2019 & 2032
- Table 46: Global Spinal Cord Stimulation Devices Market Volume K Unit Forecast, by Country 2019 & 2032
- Table 47: GCC Global Spinal Cord Stimulation Devices Market Revenue (Million) Forecast, by Application 2019 & 2032
- Table 48: GCC Global Spinal Cord Stimulation Devices Market Volume (K Unit) Forecast, by Application 2019 & 2032
- Table 49: South Africa Global Spinal Cord Stimulation Devices Market Revenue (Million) Forecast, by Application 2019 & 2032
- Table 50: South Africa Global Spinal Cord Stimulation Devices Market Volume (K Unit) Forecast, by Application 2019 & 2032
- Table 51: Rest of Middle East and Africa Global Spinal Cord Stimulation Devices Market Revenue (Million) Forecast, by Application 2019 & 2032
- Table 52: Rest of Middle East and Africa Global Spinal Cord Stimulation Devices Market Volume (K Unit) Forecast, by Application 2019 & 2032
- Table 53: Global Spinal Cord Stimulation Devices Market Revenue Million Forecast, by Country 2019 & 2032
- Table 54: Global Spinal Cord Stimulation Devices Market Volume K Unit Forecast, by Country 2019 & 2032
- Table 55: Brazil Global Spinal Cord Stimulation Devices Market Revenue (Million) Forecast, by Application 2019 & 2032
- Table 56: Brazil Global Spinal Cord Stimulation Devices Market Volume (K Unit) Forecast, by Application 2019 & 2032
- Table 57: Argentina Global Spinal Cord Stimulation Devices Market Revenue (Million) Forecast, by Application 2019 & 2032
- Table 58: Argentina Global Spinal Cord Stimulation Devices Market Volume (K Unit) Forecast, by Application 2019 & 2032
- Table 59: Rest of South America Global Spinal Cord Stimulation Devices Market Revenue (Million) Forecast, by Application 2019 & 2032
- Table 60: Rest of South America Global Spinal Cord Stimulation Devices Market Volume (K Unit) Forecast, by Application 2019 & 2032
- Table 61: Global Spinal Cord Stimulation Devices Market Revenue Million Forecast, by Device Type 2019 & 2032
- Table 62: Global Spinal Cord Stimulation Devices Market Volume K Unit Forecast, by Device Type 2019 & 2032
- Table 63: Global Spinal Cord Stimulation Devices Market Revenue Million Forecast, by Application 2019 & 2032
- Table 64: Global Spinal Cord Stimulation Devices Market Volume K Unit Forecast, by Application 2019 & 2032
- Table 65: Global Spinal Cord Stimulation Devices Market Revenue Million Forecast, by Country 2019 & 2032
- Table 66: Global Spinal Cord Stimulation Devices Market Volume K Unit Forecast, by Country 2019 & 2032
- Table 67: United States Global Spinal Cord Stimulation Devices Market Revenue (Million) Forecast, by Application 2019 & 2032
- Table 68: United States Global Spinal Cord Stimulation Devices Market Volume (K Unit) Forecast, by Application 2019 & 2032
- Table 69: Canada Global Spinal Cord Stimulation Devices Market Revenue (Million) Forecast, by Application 2019 & 2032
- Table 70: Canada Global Spinal Cord Stimulation Devices Market Volume (K Unit) Forecast, by Application 2019 & 2032
- Table 71: Mexico Global Spinal Cord Stimulation Devices Market Revenue (Million) Forecast, by Application 2019 & 2032
- Table 72: Mexico Global Spinal Cord Stimulation Devices Market Volume (K Unit) Forecast, by Application 2019 & 2032
- Table 73: Global Spinal Cord Stimulation Devices Market Revenue Million Forecast, by Device Type 2019 & 2032
- Table 74: Global Spinal Cord Stimulation Devices Market Volume K Unit Forecast, by Device Type 2019 & 2032
- Table 75: Global Spinal Cord Stimulation Devices Market Revenue Million Forecast, by Application 2019 & 2032
- Table 76: Global Spinal Cord Stimulation Devices Market Volume K Unit Forecast, by Application 2019 & 2032
- Table 77: Global Spinal Cord Stimulation Devices Market Revenue Million Forecast, by Country 2019 & 2032
- Table 78: Global Spinal Cord Stimulation Devices Market Volume K Unit Forecast, by Country 2019 & 2032
- Table 79: Germany Global Spinal Cord Stimulation Devices Market Revenue (Million) Forecast, by Application 2019 & 2032
- Table 80: Germany Global Spinal Cord Stimulation Devices Market Volume (K Unit) Forecast, by Application 2019 & 2032
- Table 81: United Kingdom Global Spinal Cord Stimulation Devices Market Revenue (Million) Forecast, by Application 2019 & 2032
- Table 82: United Kingdom Global Spinal Cord Stimulation Devices Market Volume (K Unit) Forecast, by Application 2019 & 2032
- Table 83: France Global Spinal Cord Stimulation Devices Market Revenue (Million) Forecast, by Application 2019 & 2032
- Table 84: France Global Spinal Cord Stimulation Devices Market Volume (K Unit) Forecast, by Application 2019 & 2032
- Table 85: Italy Global Spinal Cord Stimulation Devices Market Revenue (Million) Forecast, by Application 2019 & 2032
- Table 86: Italy Global Spinal Cord Stimulation Devices Market Volume (K Unit) Forecast, by Application 2019 & 2032
- Table 87: Spain Global Spinal Cord Stimulation Devices Market Revenue (Million) Forecast, by Application 2019 & 2032
- Table 88: Spain Global Spinal Cord Stimulation Devices Market Volume (K Unit) Forecast, by Application 2019 & 2032
- Table 89: Rest of Europe Global Spinal Cord Stimulation Devices Market Revenue (Million) Forecast, by Application 2019 & 2032
- Table 90: Rest of Europe Global Spinal Cord Stimulation Devices Market Volume (K Unit) Forecast, by Application 2019 & 2032
- Table 91: Global Spinal Cord Stimulation Devices Market Revenue Million Forecast, by Device Type 2019 & 2032
- Table 92: Global Spinal Cord Stimulation Devices Market Volume K Unit Forecast, by Device Type 2019 & 2032
- Table 93: Global Spinal Cord Stimulation Devices Market Revenue Million Forecast, by Application 2019 & 2032
- Table 94: Global Spinal Cord Stimulation Devices Market Volume K Unit Forecast, by Application 2019 & 2032
- Table 95: Global Spinal Cord Stimulation Devices Market Revenue Million Forecast, by Country 2019 & 2032
- Table 96: Global Spinal Cord Stimulation Devices Market Volume K Unit Forecast, by Country 2019 & 2032
- Table 97: China Global Spinal Cord Stimulation Devices Market Revenue (Million) Forecast, by Application 2019 & 2032
- Table 98: China Global Spinal Cord Stimulation Devices Market Volume (K Unit) Forecast, by Application 2019 & 2032
- Table 99: Japan Global Spinal Cord Stimulation Devices Market Revenue (Million) Forecast, by Application 2019 & 2032
- Table 100: Japan Global Spinal Cord Stimulation Devices Market Volume (K Unit) Forecast, by Application 2019 & 2032
- Table 101: India Global Spinal Cord Stimulation Devices Market Revenue (Million) Forecast, by Application 2019 & 2032
- Table 102: India Global Spinal Cord Stimulation Devices Market Volume (K Unit) Forecast, by Application 2019 & 2032
- Table 103: Australia Global Spinal Cord Stimulation Devices Market Revenue (Million) Forecast, by Application 2019 & 2032
- Table 104: Australia Global Spinal Cord Stimulation Devices Market Volume (K Unit) Forecast, by Application 2019 & 2032
- Table 105: South Korea Global Spinal Cord Stimulation Devices Market Revenue (Million) Forecast, by Application 2019 & 2032
- Table 106: South Korea Global Spinal Cord Stimulation Devices Market Volume (K Unit) Forecast, by Application 2019 & 2032
- Table 107: Rest of Asia Pacific Global Spinal Cord Stimulation Devices Market Revenue (Million) Forecast, by Application 2019 & 2032
- Table 108: Rest of Asia Pacific Global Spinal Cord Stimulation Devices Market Volume (K Unit) Forecast, by Application 2019 & 2032
- Table 109: Global Spinal Cord Stimulation Devices Market Revenue Million Forecast, by Device Type 2019 & 2032
- Table 110: Global Spinal Cord Stimulation Devices Market Volume K Unit Forecast, by Device Type 2019 & 2032
- Table 111: Global Spinal Cord Stimulation Devices Market Revenue Million Forecast, by Application 2019 & 2032
- Table 112: Global Spinal Cord Stimulation Devices Market Volume K Unit Forecast, by Application 2019 & 2032
- Table 113: Global Spinal Cord Stimulation Devices Market Revenue Million Forecast, by Country 2019 & 2032
- Table 114: Global Spinal Cord Stimulation Devices Market Volume K Unit Forecast, by Country 2019 & 2032
- Table 115: GCC Global Spinal Cord Stimulation Devices Market Revenue (Million) Forecast, by Application 2019 & 2032
- Table 116: GCC Global Spinal Cord Stimulation Devices Market Volume (K Unit) Forecast, by Application 2019 & 2032
- Table 117: South Africa Global Spinal Cord Stimulation Devices Market Revenue (Million) Forecast, by Application 2019 & 2032
- Table 118: South Africa Global Spinal Cord Stimulation Devices Market Volume (K Unit) Forecast, by Application 2019 & 2032
- Table 119: Rest of Middle East and Africa Global Spinal Cord Stimulation Devices Market Revenue (Million) Forecast, by Application 2019 & 2032
- Table 120: Rest of Middle East and Africa Global Spinal Cord Stimulation Devices Market Volume (K Unit) Forecast, by Application 2019 & 2032
- Table 121: Global Spinal Cord Stimulation Devices Market Revenue Million Forecast, by Device Type 2019 & 2032
- Table 122: Global Spinal Cord Stimulation Devices Market Volume K Unit Forecast, by Device Type 2019 & 2032
- Table 123: Global Spinal Cord Stimulation Devices Market Revenue Million Forecast, by Application 2019 & 2032
- Table 124: Global Spinal Cord Stimulation Devices Market Volume K Unit Forecast, by Application 2019 & 2032
- Table 125: Global Spinal Cord Stimulation Devices Market Revenue Million Forecast, by Country 2019 & 2032
- Table 126: Global Spinal Cord Stimulation Devices Market Volume K Unit Forecast, by Country 2019 & 2032
- Table 127: Brazil Global Spinal Cord Stimulation Devices Market Revenue (Million) Forecast, by Application 2019 & 2032
- Table 128: Brazil Global Spinal Cord Stimulation Devices Market Volume (K Unit) Forecast, by Application 2019 & 2032
- Table 129: Argentina Global Spinal Cord Stimulation Devices Market Revenue (Million) Forecast, by Application 2019 & 2032
- Table 130: Argentina Global Spinal Cord Stimulation Devices Market Volume (K Unit) Forecast, by Application 2019 & 2032
- Table 131: Rest of South America Global Spinal Cord Stimulation Devices Market Revenue (Million) Forecast, by Application 2019 & 2032
- Table 132: Rest of South America Global Spinal Cord Stimulation Devices Market Volume (K Unit) Forecast, by Application 2019 & 2032
Frequently Asked Questions
1. What is the projected Compound Annual Growth Rate (CAGR) of the Global Spinal Cord Stimulation Devices Market?
The projected CAGR is approximately 8.50%.
2. Which companies are prominent players in the Global Spinal Cord Stimulation Devices Market?
Key companies in the market include Gimer Medical, Beijing PINS Medical Co Ltd, Cirtec, Saluda Medical Pty Ltd, Medtronic, Stimwave Technologies Inc, NEVRO CORP, Nalu Medical, SYNAPSE BIOMEDICAL INC , Abbott Laboratories Inc, Boston Scientific Corporation.
3. What are the main segments of the Global Spinal Cord Stimulation Devices Market?
The market segments include Device Type, Application.
4. Can you provide details about the market size?
The market size is estimated to be USD XX Million as of 2022.
5. What are some drivers contributing to market growth?
Rising Burden of Spinal Disorders; Availability of Medical Reimbursements.
6. What are the notable trends driving market growth?
Degenerative Disk Disease Segment is Expected to Hold a Significant Market Share Over the Forecast Period.
7. Are there any restraints impacting market growth?
Risks Associated with Spinal Cord Stimulation Devices.
8. Can you provide examples of recent developments in the market?
In January 2022, Abbott received the United States Food and Drug Administration (FDA) approval for new expanded magnetic resonance imaging (MRI) compatibility for its Proclaim XR Spinal Cord Stimulation (SCS) System with Octrode leads.
9. What pricing options are available for accessing the report?
Pricing options include single-user, multi-user, and enterprise licenses priced at USD 4750, USD 5250, and USD 8750 respectively.
10. Is the market size provided in terms of value or volume?
The market size is provided in terms of value, measured in Million and volume, measured in K Unit.
11. Are there any specific market keywords associated with the report?
Yes, the market keyword associated with the report is "Global Spinal Cord Stimulation Devices Market," which aids in identifying and referencing the specific market segment covered.
12. How do I determine which pricing option suits my needs best?
The pricing options vary based on user requirements and access needs. Individual users may opt for single-user licenses, while businesses requiring broader access may choose multi-user or enterprise licenses for cost-effective access to the report.
13. Are there any additional resources or data provided in the Global Spinal Cord Stimulation Devices Market report?
While the report offers comprehensive insights, it's advisable to review the specific contents or supplementary materials provided to ascertain if additional resources or data are available.
14. How can I stay updated on further developments or reports in the Global Spinal Cord Stimulation Devices Market?
To stay informed about further developments, trends, and reports in the Global Spinal Cord Stimulation Devices Market, consider subscribing to industry newsletters, following relevant companies and organizations, or regularly checking reputable industry news sources and publications.
Methodology
Step 1 - Identification of Relevant Samples Size from Population Database


Step 2 - Approaches for Defining Global Market Size (Value, Volume* & Price*)

Note*: In applicable scenarios
Step 3 - Data Sources
Primary Research
- Web Analytics
- Survey Reports
- Research Institute
- Latest Research Reports
- Opinion Leaders
Secondary Research
- Annual Reports
- White Paper
- Latest Press Release
- Industry Association
- Paid Database
- Investor Presentations

Step 4 - Data Triangulation
Involves using different sources of information in order to increase the validity of a study
These sources are likely to be stakeholders in a program - participants, other researchers, program staff, other community members, and so on.
Then we put all data in single framework & apply various statistical tools to find out the dynamic on the market.
During the analysis stage, feedback from the stakeholder groups would be compared to determine areas of agreement as well as areas of divergence


