
Key Insights
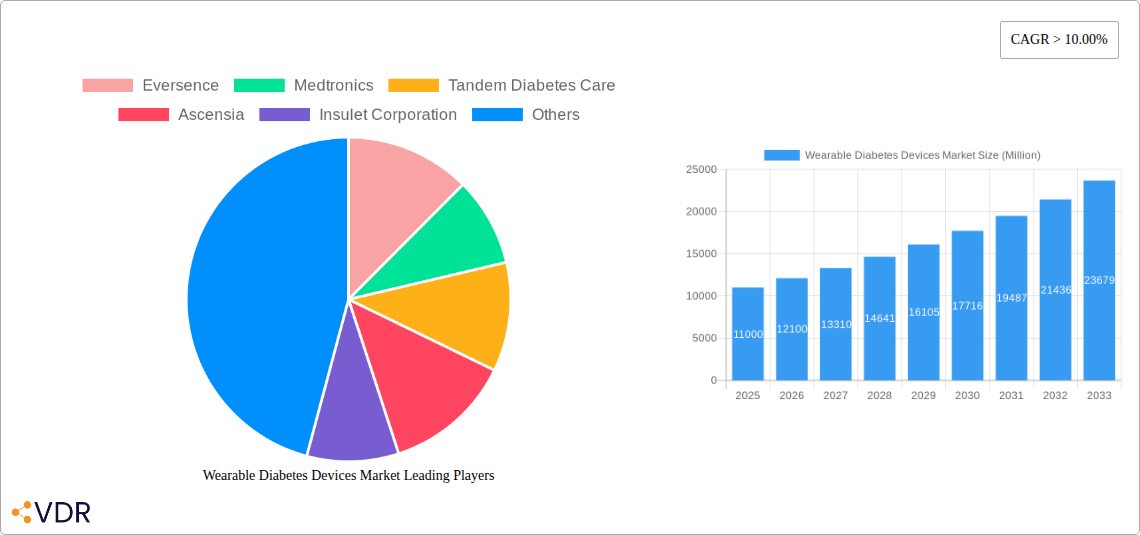
The global wearable diabetes devices market, valued at approximately $11 billion in 2025, is projected to experience robust growth, exceeding a 10% compound annual growth rate (CAGR) through 2033. This expansion is fueled by several key drivers. The rising prevalence of diabetes worldwide, particularly type 1 and type 2 diabetes, creates significant demand for effective and convenient glucose monitoring and insulin delivery systems. Technological advancements, such as the development of more accurate, smaller, and user-friendly continuous glucose monitoring (CGM) devices and insulin pumps, are further accelerating market growth. The increasing adoption of telehealth and remote patient monitoring further contributes to market expansion, enabling better diabetes management and improved patient outcomes. The market segmentation reveals strong growth in non-invasive glucose monitoring devices, driven by consumer preference for less painful and more convenient testing methods. The home/personal end-user segment is also experiencing rapid growth, reflecting the increasing preference for self-management of diabetes outside of traditional clinical settings. Leading companies like Dexcom, Medtronic, and Abbott are actively investing in research and development, launching innovative products, and expanding their market presence through strategic partnerships and acquisitions.
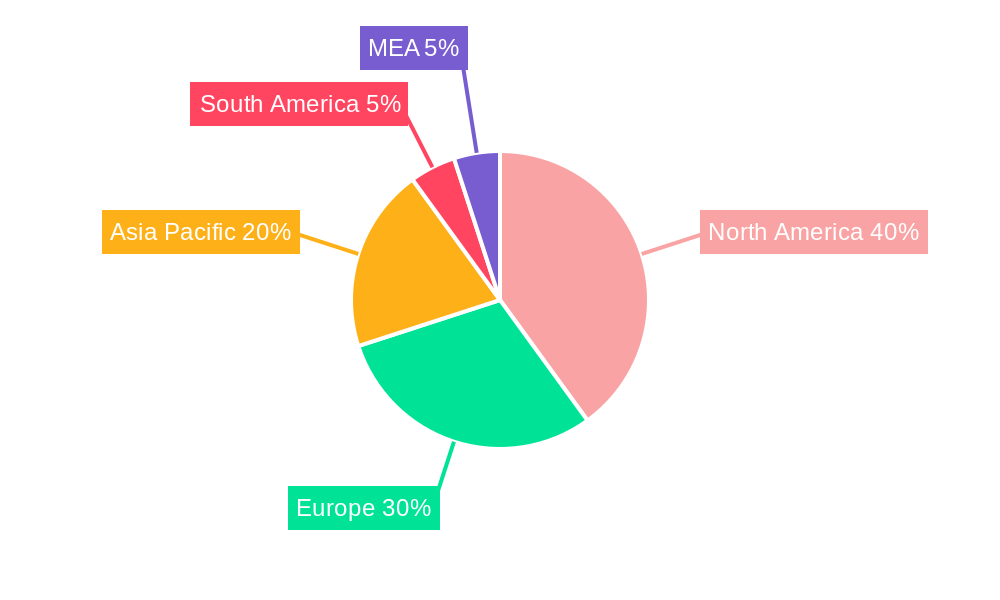
Geographical distribution reveals strong market presence in North America and Europe, driven by high diabetes prevalence rates and advanced healthcare infrastructure. However, Asia Pacific is expected to exhibit significant growth potential over the forecast period, driven by increasing diabetes awareness, rising disposable incomes, and expanding healthcare access in emerging economies. While challenges exist, such as high device costs and potential regulatory hurdles, the overall market outlook remains positive. Continued innovation in device technology, combined with greater affordability and improved healthcare access, will likely drive further market expansion in the coming years. The market's growth trajectory is poised to continue its upward trend, making it an attractive sector for investors and stakeholders in the healthcare industry.
Wearable Diabetes Devices Market: A Comprehensive Report (2019-2033)
This in-depth report provides a comprehensive analysis of the Wearable Diabetes Devices market, encompassing market dynamics, growth trends, regional dominance, product landscape, key players, and future outlook. The study period spans from 2019 to 2033, with 2025 serving as the base and estimated year. The report segments the market into Durables (Insulin Pumps), Types (Non-Invasive & Invasive Glucose Monitoring Devices), End Users (Hospital/Clinics, Home/Personal), and Devices (Continuous Glucose Monitoring Devices), offering granular insights into each segment's performance and growth trajectory. The market is projected to reach xx Million units by 2033.
Wearable Diabetes Devices Market Dynamics & Structure
The Wearable Diabetes Devices market is characterized by moderate concentration, with key players like Medtronic, Abbott, and Dexcom holding significant market share. However, the landscape is dynamic, driven by continuous technological innovation, particularly in continuous glucose monitoring (CGM) and automated insulin delivery (AID) systems. Stringent regulatory frameworks, primarily overseen by the FDA in the US and equivalent bodies globally, significantly impact market entry and product approval. Competitive pressures stem from both established players and emerging companies introducing innovative solutions. The market experiences considerable M&A activity, consolidating market share and fostering technological advancements. The end-user demographic skews toward individuals with type 1 and type 2 diabetes, with a growing emphasis on home/personal use.
- Market Concentration: Moderately concentrated, with top 5 players holding approximately xx% market share in 2025.
- Technological Innovation: Focus on miniaturization, improved accuracy, and seamless integration with smartphones.
- Regulatory Landscape: Stringent FDA approvals (and equivalent international regulations) influence market entry and product development.
- Competitive Substitutes: Limited direct substitutes, but alternative diabetes management strategies (e.g., diet, exercise) exist.
- End-User Demographics: Predominantly individuals with type 1 and type 2 diabetes, growing adoption among older populations.
- M&A Trends: Consolidation through acquisitions and partnerships driving innovation and market expansion; xx M&A deals observed between 2019-2024.
Wearable Diabetes Devices Market Growth Trends & Insights
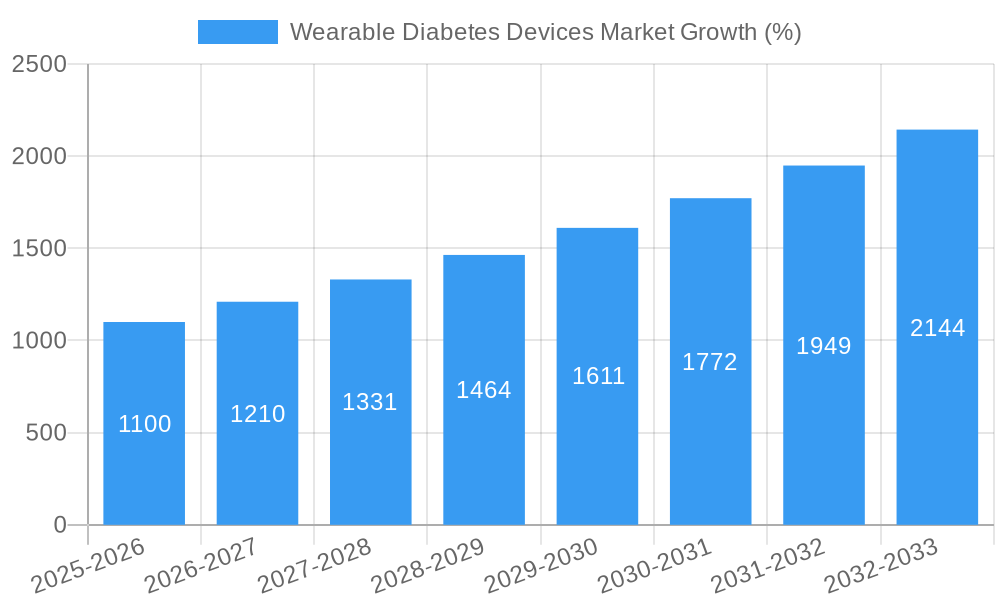
The Wearable Diabetes Devices market exhibits significant growth driven by rising diabetes prevalence, increasing demand for convenient and accurate glucose monitoring, and technological advancements in CGM and insulin pump technologies. The market experienced a CAGR of xx% during the historical period (2019-2024) and is projected to maintain a robust CAGR of xx% during the forecast period (2025-2033). This growth is fueled by several factors including: increased awareness about diabetes management, improved device accuracy and usability, expanding reimbursement coverage, and the growing adoption of connected health solutions. Consumer behavior shifts toward personalized and proactive diabetes management are also contributing factors. Technological disruptions, particularly the introduction of AI-powered systems and improved integration with other healthcare technologies, are accelerating market expansion.
Dominant Regions, Countries, or Segments in Wearable Diabetes Devices Market
North America currently dominates the Wearable Diabetes Devices market, driven by high diabetes prevalence, advanced healthcare infrastructure, and greater access to innovative technologies. However, regions like Asia-Pacific are experiencing rapid growth fueled by rising diabetes incidence and increasing healthcare expenditure. Within segments, Continuous Glucose Monitoring (CGM) devices show the highest growth potential due to their real-time monitoring capabilities and improved patient outcomes. The Home/Personal end-user segment is also experiencing substantial expansion as individuals prioritize self-management of their condition.
- North America: High adoption rates due to advanced healthcare infrastructure and high diabetes prevalence.
- Europe: Growing market driven by increasing awareness of diabetes management and technological advancements.
- Asia-Pacific: Rapid growth potential due to rising diabetes incidence and expanding healthcare spending.
- Dominant Segments: Continuous Glucose Monitoring Devices, Home/Personal use, and Insulin Pumps represent the largest market shares.
- Key Drivers: Increased diabetes prevalence, technological advancements, rising healthcare expenditure, and improved reimbursement policies.
Wearable Diabetes Devices Market Product Landscape
The Wearable Diabetes Devices market showcases a diverse range of products, including sophisticated insulin pumps with advanced features, highly accurate CGM systems with enhanced data analytics, and innovative non-invasive glucose monitoring technologies. These devices increasingly integrate with smartphone apps, providing users with real-time data, personalized insights, and remote monitoring capabilities. Key differentiators include accuracy, ease of use, data connectivity, and battery life. Technological advancements focus on miniaturization, improved sensor technology, and the integration of artificial intelligence for enhanced data analysis and predictive capabilities.
Key Drivers, Barriers & Challenges in Wearable Diabetes Devices Market
Key Drivers:
- Rising prevalence of diabetes globally.
- Technological advancements in CGM and insulin delivery systems.
- Growing demand for convenient and accurate self-management tools.
- Increasing healthcare expenditure and insurance coverage.
Challenges & Restraints:
- High cost of devices and consumables, limiting accessibility.
- Potential for sensor inaccuracies and calibration issues.
- Regulatory hurdles and varying reimbursement policies across regions.
- Cybersecurity concerns related to data privacy and device security. This limits market penetration by xx% in certain regions.
Emerging Opportunities in Wearable Diabetes Devices Market
- Expansion into underserved markets in developing countries.
- Development of non-invasive glucose monitoring technologies.
- Integration of AI and machine learning for predictive analytics and personalized care.
- Creation of comprehensive diabetes management platforms integrating multiple devices.
Growth Accelerators in the Wearable Diabetes Devices Market Industry
Technological breakthroughs, such as advancements in sensor technology and AI-driven algorithms, are significantly accelerating market growth. Strategic partnerships between device manufacturers and healthcare providers are expanding access and improving patient outcomes. Market expansion strategies targeting underserved populations and developing regions are unlocking significant growth potential.
Key Players Shaping the Wearable Diabetes Devices Market Market
Notable Milestones in Wearable Diabetes Devices Market Sector
- May 2023: Beta Bionics receives FDA clearance for the iLet Bionic Pancreas system, significantly advancing automated insulin delivery technology.
- March 2023: FDA approves Eversense E3 CGM system, enhancing real-time glucose monitoring capabilities.
In-Depth Wearable Diabetes Devices Market Market Outlook
The Wearable Diabetes Devices market presents a significant opportunity for growth driven by continued technological advancements, increasing diabetes prevalence, and expanding healthcare coverage. Strategic partnerships, focusing on data analytics and integration with wider healthcare ecosystems, will further accelerate market expansion. The potential for non-invasive glucose monitoring and personalized medicine presents compelling long-term growth prospects.
Wearable Diabetes Devices Market Segmentation
-
1. Device
-
1.1. Continuous Glucose Monitoring Devices
- 1.1.1. Sensors
- 1.1.2. Durables
-
1.2. Insulin Pumps
- 1.2.1. Insulin Pump Devices
- 1.2.2. Insulin Infusion Sets
- 1.2.3. Reservoirs
-
1.1. Continuous Glucose Monitoring Devices
-
2. Type
- 2.1. Non-Invasive Glucose Monitoring Devices
-
3. End User
- 3.1. Hospital/Clinics
- 3.2. Home/Personal
Wearable Diabetes Devices Market Segmentation By Geography
-
1. North America
- 1.1. United States
- 1.2. Canada
- 1.3. Rest of North America
-
2. Europe
- 2.1. France
- 2.2. Germany
- 2.3. Italy
- 2.4. Spain
- 2.5. United Kingdom
- 2.6. Russia
- 2.7. Rest of Europe
-
3. Latin America
- 3.1. Mexico
- 3.2. Brazil
- 3.3. Rest of Latin America
-
4. Asia Pacific
- 4.1. Japan
- 4.2. South Korea
- 4.3. China
- 4.4. India
- 4.5. Australia
- 4.6. Vietnam
- 4.7. Malaysia
- 4.8. Indonesia
- 4.9. Thailand
- 4.10. Rest of Asia Pacific
-
5. Middle East and Africa
- 5.1. Saudi Arabia
- 5.2. Iran
- 5.3. Egypt
- 5.4. Oman
- 5.5. South Africa
- 5.6. Rest of Middle East and Africa
Wearable Diabetes Devices Market REPORT HIGHLIGHTS
| Aspects | Details |
|---|---|
| Study Period | 2019-2033 |
| Base Year | 2024 |
| Estimated Year | 2025 |
| Forecast Period | 2025-2033 |
| Historical Period | 2019-2024 |
| Growth Rate | CAGR of > 10.00% from 2019-2033 |
| Segmentation |
|
Table of Contents
- 1. Introduction
- 1.1. Research Scope
- 1.2. Market Segmentation
- 1.3. Research Methodology
- 1.4. Definitions and Assumptions
- 2. Executive Summary
- 2.1. Introduction
- 3. Market Dynamics
- 3.1. Introduction
- 3.2. Market Drivers
- 3.2.1. Rapidly Increasing Incidence and Prevalence of Diabetes; Technological Advancements in the Market
- 3.3. Market Restrains
- 3.3.1. Monopolized Supply Chain and High Cost of Devices
- 3.4. Market Trends
- 3.4.1. Rising diabetes prevalence globally is driving the market in forecast years
- 4. Market Factor Analysis
- 4.1. Porters Five Forces
- 4.2. Supply/Value Chain
- 4.3. PESTEL analysis
- 4.4. Market Entropy
- 4.5. Patent/Trademark Analysis
- 5. Global Wearable Diabetes Devices Market Analysis, Insights and Forecast, 2019-2031
- 5.1. Market Analysis, Insights and Forecast - by Device
- 5.1.1. Continuous Glucose Monitoring Devices
- 5.1.1.1. Sensors
- 5.1.1.2. Durables
- 5.1.2. Insulin Pumps
- 5.1.2.1. Insulin Pump Devices
- 5.1.2.2. Insulin Infusion Sets
- 5.1.2.3. Reservoirs
- 5.1.1. Continuous Glucose Monitoring Devices
- 5.2. Market Analysis, Insights and Forecast - by Type
- 5.2.1. Non-Invasive Glucose Monitoring Devices
- 5.3. Market Analysis, Insights and Forecast - by End User
- 5.3.1. Hospital/Clinics
- 5.3.2. Home/Personal
- 5.4. Market Analysis, Insights and Forecast - by Region
- 5.4.1. North America
- 5.4.2. Europe
- 5.4.3. Latin America
- 5.4.4. Asia Pacific
- 5.4.5. Middle East and Africa
- 5.1. Market Analysis, Insights and Forecast - by Device
- 6. North America Wearable Diabetes Devices Market Analysis, Insights and Forecast, 2019-2031
- 6.1. Market Analysis, Insights and Forecast - by Device
- 6.1.1. Continuous Glucose Monitoring Devices
- 6.1.1.1. Sensors
- 6.1.1.2. Durables
- 6.1.2. Insulin Pumps
- 6.1.2.1. Insulin Pump Devices
- 6.1.2.2. Insulin Infusion Sets
- 6.1.2.3. Reservoirs
- 6.1.1. Continuous Glucose Monitoring Devices
- 6.2. Market Analysis, Insights and Forecast - by Type
- 6.2.1. Non-Invasive Glucose Monitoring Devices
- 6.3. Market Analysis, Insights and Forecast - by End User
- 6.3.1. Hospital/Clinics
- 6.3.2. Home/Personal
- 6.1. Market Analysis, Insights and Forecast - by Device
- 7. Europe Wearable Diabetes Devices Market Analysis, Insights and Forecast, 2019-2031
- 7.1. Market Analysis, Insights and Forecast - by Device
- 7.1.1. Continuous Glucose Monitoring Devices
- 7.1.1.1. Sensors
- 7.1.1.2. Durables
- 7.1.2. Insulin Pumps
- 7.1.2.1. Insulin Pump Devices
- 7.1.2.2. Insulin Infusion Sets
- 7.1.2.3. Reservoirs
- 7.1.1. Continuous Glucose Monitoring Devices
- 7.2. Market Analysis, Insights and Forecast - by Type
- 7.2.1. Non-Invasive Glucose Monitoring Devices
- 7.3. Market Analysis, Insights and Forecast - by End User
- 7.3.1. Hospital/Clinics
- 7.3.2. Home/Personal
- 7.1. Market Analysis, Insights and Forecast - by Device
- 8. Latin America Wearable Diabetes Devices Market Analysis, Insights and Forecast, 2019-2031
- 8.1. Market Analysis, Insights and Forecast - by Device
- 8.1.1. Continuous Glucose Monitoring Devices
- 8.1.1.1. Sensors
- 8.1.1.2. Durables
- 8.1.2. Insulin Pumps
- 8.1.2.1. Insulin Pump Devices
- 8.1.2.2. Insulin Infusion Sets
- 8.1.2.3. Reservoirs
- 8.1.1. Continuous Glucose Monitoring Devices
- 8.2. Market Analysis, Insights and Forecast - by Type
- 8.2.1. Non-Invasive Glucose Monitoring Devices
- 8.3. Market Analysis, Insights and Forecast - by End User
- 8.3.1. Hospital/Clinics
- 8.3.2. Home/Personal
- 8.1. Market Analysis, Insights and Forecast - by Device
- 9. Asia Pacific Wearable Diabetes Devices Market Analysis, Insights and Forecast, 2019-2031
- 9.1. Market Analysis, Insights and Forecast - by Device
- 9.1.1. Continuous Glucose Monitoring Devices
- 9.1.1.1. Sensors
- 9.1.1.2. Durables
- 9.1.2. Insulin Pumps
- 9.1.2.1. Insulin Pump Devices
- 9.1.2.2. Insulin Infusion Sets
- 9.1.2.3. Reservoirs
- 9.1.1. Continuous Glucose Monitoring Devices
- 9.2. Market Analysis, Insights and Forecast - by Type
- 9.2.1. Non-Invasive Glucose Monitoring Devices
- 9.3. Market Analysis, Insights and Forecast - by End User
- 9.3.1. Hospital/Clinics
- 9.3.2. Home/Personal
- 9.1. Market Analysis, Insights and Forecast - by Device
- 10. Middle East and Africa Wearable Diabetes Devices Market Analysis, Insights and Forecast, 2019-2031
- 10.1. Market Analysis, Insights and Forecast - by Device
- 10.1.1. Continuous Glucose Monitoring Devices
- 10.1.1.1. Sensors
- 10.1.1.2. Durables
- 10.1.2. Insulin Pumps
- 10.1.2.1. Insulin Pump Devices
- 10.1.2.2. Insulin Infusion Sets
- 10.1.2.3. Reservoirs
- 10.1.1. Continuous Glucose Monitoring Devices
- 10.2. Market Analysis, Insights and Forecast - by Type
- 10.2.1. Non-Invasive Glucose Monitoring Devices
- 10.3. Market Analysis, Insights and Forecast - by End User
- 10.3.1. Hospital/Clinics
- 10.3.2. Home/Personal
- 10.1. Market Analysis, Insights and Forecast - by Device
- 11. North America Wearable Diabetes Devices Market Analysis, Insights and Forecast, 2019-2031
- 11.1. Market Analysis, Insights and Forecast - By Country/Sub-region
- 11.1.1 United States
- 11.1.2 Canada
- 11.1.3 Mexico
- 12. Europe Wearable Diabetes Devices Market Analysis, Insights and Forecast, 2019-2031
- 12.1. Market Analysis, Insights and Forecast - By Country/Sub-region
- 12.1.1 Germany
- 12.1.2 United Kingdom
- 12.1.3 France
- 12.1.4 Spain
- 12.1.5 Italy
- 12.1.6 Spain
- 12.1.7 Belgium
- 12.1.8 Netherland
- 12.1.9 Nordics
- 12.1.10 Rest of Europe
- 13. Asia Pacific Wearable Diabetes Devices Market Analysis, Insights and Forecast, 2019-2031
- 13.1. Market Analysis, Insights and Forecast - By Country/Sub-region
- 13.1.1 China
- 13.1.2 Japan
- 13.1.3 India
- 13.1.4 South Korea
- 13.1.5 Southeast Asia
- 13.1.6 Australia
- 13.1.7 Indonesia
- 13.1.8 Phillipes
- 13.1.9 Singapore
- 13.1.10 Thailandc
- 13.1.11 Rest of Asia Pacific
- 14. South America Wearable Diabetes Devices Market Analysis, Insights and Forecast, 2019-2031
- 14.1. Market Analysis, Insights and Forecast - By Country/Sub-region
- 14.1.1 Brazil
- 14.1.2 Argentina
- 14.1.3 Peru
- 14.1.4 Chile
- 14.1.5 Colombia
- 14.1.6 Ecuador
- 14.1.7 Venezuela
- 14.1.8 Rest of South America
- 15. MEA Wearable Diabetes Devices Market Analysis, Insights and Forecast, 2019-2031
- 15.1. Market Analysis, Insights and Forecast - By Country/Sub-region
- 15.1.1 United Arab Emirates
- 15.1.2 Saudi Arabia
- 15.1.3 South Africa
- 15.1.4 Rest of Middle East and Africa
- 16. Competitive Analysis
- 16.1. Global Market Share Analysis 2024
- 16.2. Company Profiles
- 16.2.1 Eversence
- 16.2.1.1. Overview
- 16.2.1.2. Products
- 16.2.1.3. SWOT Analysis
- 16.2.1.4. Recent Developments
- 16.2.1.5. Financials (Based on Availability)
- 16.2.2 Medtronics
- 16.2.2.1. Overview
- 16.2.2.2. Products
- 16.2.2.3. SWOT Analysis
- 16.2.2.4. Recent Developments
- 16.2.2.5. Financials (Based on Availability)
- 16.2.3 Tandem Diabetes Care
- 16.2.3.1. Overview
- 16.2.3.2. Products
- 16.2.3.3. SWOT Analysis
- 16.2.3.4. Recent Developments
- 16.2.3.5. Financials (Based on Availability)
- 16.2.4 Ascensia
- 16.2.4.1. Overview
- 16.2.4.2. Products
- 16.2.4.3. SWOT Analysis
- 16.2.4.4. Recent Developments
- 16.2.4.5. Financials (Based on Availability)
- 16.2.5 Insulet Corporation
- 16.2.5.1. Overview
- 16.2.5.2. Products
- 16.2.5.3. SWOT Analysis
- 16.2.5.4. Recent Developments
- 16.2.5.5. Financials (Based on Availability)
- 16.2.6 Abbott
- 16.2.6.1. Overview
- 16.2.6.2. Products
- 16.2.6.3. SWOT Analysis
- 16.2.6.4. Recent Developments
- 16.2.6.5. Financials (Based on Availability)
- 16.2.7 Ypsomped
- 16.2.7.1. Overview
- 16.2.7.2. Products
- 16.2.7.3. SWOT Analysis
- 16.2.7.4. Recent Developments
- 16.2.7.5. Financials (Based on Availability)
- 16.2.8 Dexcom
- 16.2.8.1. Overview
- 16.2.8.2. Products
- 16.2.8.3. SWOT Analysis
- 16.2.8.4. Recent Developments
- 16.2.8.5. Financials (Based on Availability)
- 16.2.1 Eversence
List of Figures
- Figure 1: Global Wearable Diabetes Devices Market Revenue Breakdown (Million, %) by Region 2024 & 2032
- Figure 2: Global Wearable Diabetes Devices Market Volume Breakdown (K Unit, %) by Region 2024 & 2032
- Figure 3: North America Wearable Diabetes Devices Market Revenue (Million), by Country 2024 & 2032
- Figure 4: North America Wearable Diabetes Devices Market Volume (K Unit), by Country 2024 & 2032
- Figure 5: North America Wearable Diabetes Devices Market Revenue Share (%), by Country 2024 & 2032
- Figure 6: North America Wearable Diabetes Devices Market Volume Share (%), by Country 2024 & 2032
- Figure 7: Europe Wearable Diabetes Devices Market Revenue (Million), by Country 2024 & 2032
- Figure 8: Europe Wearable Diabetes Devices Market Volume (K Unit), by Country 2024 & 2032
- Figure 9: Europe Wearable Diabetes Devices Market Revenue Share (%), by Country 2024 & 2032
- Figure 10: Europe Wearable Diabetes Devices Market Volume Share (%), by Country 2024 & 2032
- Figure 11: Asia Pacific Wearable Diabetes Devices Market Revenue (Million), by Country 2024 & 2032
- Figure 12: Asia Pacific Wearable Diabetes Devices Market Volume (K Unit), by Country 2024 & 2032
- Figure 13: Asia Pacific Wearable Diabetes Devices Market Revenue Share (%), by Country 2024 & 2032
- Figure 14: Asia Pacific Wearable Diabetes Devices Market Volume Share (%), by Country 2024 & 2032
- Figure 15: South America Wearable Diabetes Devices Market Revenue (Million), by Country 2024 & 2032
- Figure 16: South America Wearable Diabetes Devices Market Volume (K Unit), by Country 2024 & 2032
- Figure 17: South America Wearable Diabetes Devices Market Revenue Share (%), by Country 2024 & 2032
- Figure 18: South America Wearable Diabetes Devices Market Volume Share (%), by Country 2024 & 2032
- Figure 19: MEA Wearable Diabetes Devices Market Revenue (Million), by Country 2024 & 2032
- Figure 20: MEA Wearable Diabetes Devices Market Volume (K Unit), by Country 2024 & 2032
- Figure 21: MEA Wearable Diabetes Devices Market Revenue Share (%), by Country 2024 & 2032
- Figure 22: MEA Wearable Diabetes Devices Market Volume Share (%), by Country 2024 & 2032
- Figure 23: North America Wearable Diabetes Devices Market Revenue (Million), by Device 2024 & 2032
- Figure 24: North America Wearable Diabetes Devices Market Volume (K Unit), by Device 2024 & 2032
- Figure 25: North America Wearable Diabetes Devices Market Revenue Share (%), by Device 2024 & 2032
- Figure 26: North America Wearable Diabetes Devices Market Volume Share (%), by Device 2024 & 2032
- Figure 27: North America Wearable Diabetes Devices Market Revenue (Million), by Type 2024 & 2032
- Figure 28: North America Wearable Diabetes Devices Market Volume (K Unit), by Type 2024 & 2032
- Figure 29: North America Wearable Diabetes Devices Market Revenue Share (%), by Type 2024 & 2032
- Figure 30: North America Wearable Diabetes Devices Market Volume Share (%), by Type 2024 & 2032
- Figure 31: North America Wearable Diabetes Devices Market Revenue (Million), by End User 2024 & 2032
- Figure 32: North America Wearable Diabetes Devices Market Volume (K Unit), by End User 2024 & 2032
- Figure 33: North America Wearable Diabetes Devices Market Revenue Share (%), by End User 2024 & 2032
- Figure 34: North America Wearable Diabetes Devices Market Volume Share (%), by End User 2024 & 2032
- Figure 35: North America Wearable Diabetes Devices Market Revenue (Million), by Country 2024 & 2032
- Figure 36: North America Wearable Diabetes Devices Market Volume (K Unit), by Country 2024 & 2032
- Figure 37: North America Wearable Diabetes Devices Market Revenue Share (%), by Country 2024 & 2032
- Figure 38: North America Wearable Diabetes Devices Market Volume Share (%), by Country 2024 & 2032
- Figure 39: Europe Wearable Diabetes Devices Market Revenue (Million), by Device 2024 & 2032
- Figure 40: Europe Wearable Diabetes Devices Market Volume (K Unit), by Device 2024 & 2032
- Figure 41: Europe Wearable Diabetes Devices Market Revenue Share (%), by Device 2024 & 2032
- Figure 42: Europe Wearable Diabetes Devices Market Volume Share (%), by Device 2024 & 2032
- Figure 43: Europe Wearable Diabetes Devices Market Revenue (Million), by Type 2024 & 2032
- Figure 44: Europe Wearable Diabetes Devices Market Volume (K Unit), by Type 2024 & 2032
- Figure 45: Europe Wearable Diabetes Devices Market Revenue Share (%), by Type 2024 & 2032
- Figure 46: Europe Wearable Diabetes Devices Market Volume Share (%), by Type 2024 & 2032
- Figure 47: Europe Wearable Diabetes Devices Market Revenue (Million), by End User 2024 & 2032
- Figure 48: Europe Wearable Diabetes Devices Market Volume (K Unit), by End User 2024 & 2032
- Figure 49: Europe Wearable Diabetes Devices Market Revenue Share (%), by End User 2024 & 2032
- Figure 50: Europe Wearable Diabetes Devices Market Volume Share (%), by End User 2024 & 2032
- Figure 51: Europe Wearable Diabetes Devices Market Revenue (Million), by Country 2024 & 2032
- Figure 52: Europe Wearable Diabetes Devices Market Volume (K Unit), by Country 2024 & 2032
- Figure 53: Europe Wearable Diabetes Devices Market Revenue Share (%), by Country 2024 & 2032
- Figure 54: Europe Wearable Diabetes Devices Market Volume Share (%), by Country 2024 & 2032
- Figure 55: Latin America Wearable Diabetes Devices Market Revenue (Million), by Device 2024 & 2032
- Figure 56: Latin America Wearable Diabetes Devices Market Volume (K Unit), by Device 2024 & 2032
- Figure 57: Latin America Wearable Diabetes Devices Market Revenue Share (%), by Device 2024 & 2032
- Figure 58: Latin America Wearable Diabetes Devices Market Volume Share (%), by Device 2024 & 2032
- Figure 59: Latin America Wearable Diabetes Devices Market Revenue (Million), by Type 2024 & 2032
- Figure 60: Latin America Wearable Diabetes Devices Market Volume (K Unit), by Type 2024 & 2032
- Figure 61: Latin America Wearable Diabetes Devices Market Revenue Share (%), by Type 2024 & 2032
- Figure 62: Latin America Wearable Diabetes Devices Market Volume Share (%), by Type 2024 & 2032
- Figure 63: Latin America Wearable Diabetes Devices Market Revenue (Million), by End User 2024 & 2032
- Figure 64: Latin America Wearable Diabetes Devices Market Volume (K Unit), by End User 2024 & 2032
- Figure 65: Latin America Wearable Diabetes Devices Market Revenue Share (%), by End User 2024 & 2032
- Figure 66: Latin America Wearable Diabetes Devices Market Volume Share (%), by End User 2024 & 2032
- Figure 67: Latin America Wearable Diabetes Devices Market Revenue (Million), by Country 2024 & 2032
- Figure 68: Latin America Wearable Diabetes Devices Market Volume (K Unit), by Country 2024 & 2032
- Figure 69: Latin America Wearable Diabetes Devices Market Revenue Share (%), by Country 2024 & 2032
- Figure 70: Latin America Wearable Diabetes Devices Market Volume Share (%), by Country 2024 & 2032
- Figure 71: Asia Pacific Wearable Diabetes Devices Market Revenue (Million), by Device 2024 & 2032
- Figure 72: Asia Pacific Wearable Diabetes Devices Market Volume (K Unit), by Device 2024 & 2032
- Figure 73: Asia Pacific Wearable Diabetes Devices Market Revenue Share (%), by Device 2024 & 2032
- Figure 74: Asia Pacific Wearable Diabetes Devices Market Volume Share (%), by Device 2024 & 2032
- Figure 75: Asia Pacific Wearable Diabetes Devices Market Revenue (Million), by Type 2024 & 2032
- Figure 76: Asia Pacific Wearable Diabetes Devices Market Volume (K Unit), by Type 2024 & 2032
- Figure 77: Asia Pacific Wearable Diabetes Devices Market Revenue Share (%), by Type 2024 & 2032
- Figure 78: Asia Pacific Wearable Diabetes Devices Market Volume Share (%), by Type 2024 & 2032
- Figure 79: Asia Pacific Wearable Diabetes Devices Market Revenue (Million), by End User 2024 & 2032
- Figure 80: Asia Pacific Wearable Diabetes Devices Market Volume (K Unit), by End User 2024 & 2032
- Figure 81: Asia Pacific Wearable Diabetes Devices Market Revenue Share (%), by End User 2024 & 2032
- Figure 82: Asia Pacific Wearable Diabetes Devices Market Volume Share (%), by End User 2024 & 2032
- Figure 83: Asia Pacific Wearable Diabetes Devices Market Revenue (Million), by Country 2024 & 2032
- Figure 84: Asia Pacific Wearable Diabetes Devices Market Volume (K Unit), by Country 2024 & 2032
- Figure 85: Asia Pacific Wearable Diabetes Devices Market Revenue Share (%), by Country 2024 & 2032
- Figure 86: Asia Pacific Wearable Diabetes Devices Market Volume Share (%), by Country 2024 & 2032
- Figure 87: Middle East and Africa Wearable Diabetes Devices Market Revenue (Million), by Device 2024 & 2032
- Figure 88: Middle East and Africa Wearable Diabetes Devices Market Volume (K Unit), by Device 2024 & 2032
- Figure 89: Middle East and Africa Wearable Diabetes Devices Market Revenue Share (%), by Device 2024 & 2032
- Figure 90: Middle East and Africa Wearable Diabetes Devices Market Volume Share (%), by Device 2024 & 2032
- Figure 91: Middle East and Africa Wearable Diabetes Devices Market Revenue (Million), by Type 2024 & 2032
- Figure 92: Middle East and Africa Wearable Diabetes Devices Market Volume (K Unit), by Type 2024 & 2032
- Figure 93: Middle East and Africa Wearable Diabetes Devices Market Revenue Share (%), by Type 2024 & 2032
- Figure 94: Middle East and Africa Wearable Diabetes Devices Market Volume Share (%), by Type 2024 & 2032
- Figure 95: Middle East and Africa Wearable Diabetes Devices Market Revenue (Million), by End User 2024 & 2032
- Figure 96: Middle East and Africa Wearable Diabetes Devices Market Volume (K Unit), by End User 2024 & 2032
- Figure 97: Middle East and Africa Wearable Diabetes Devices Market Revenue Share (%), by End User 2024 & 2032
- Figure 98: Middle East and Africa Wearable Diabetes Devices Market Volume Share (%), by End User 2024 & 2032
- Figure 99: Middle East and Africa Wearable Diabetes Devices Market Revenue (Million), by Country 2024 & 2032
- Figure 100: Middle East and Africa Wearable Diabetes Devices Market Volume (K Unit), by Country 2024 & 2032
- Figure 101: Middle East and Africa Wearable Diabetes Devices Market Revenue Share (%), by Country 2024 & 2032
- Figure 102: Middle East and Africa Wearable Diabetes Devices Market Volume Share (%), by Country 2024 & 2032
List of Tables
- Table 1: Global Wearable Diabetes Devices Market Revenue Million Forecast, by Region 2019 & 2032
- Table 2: Global Wearable Diabetes Devices Market Volume K Unit Forecast, by Region 2019 & 2032
- Table 3: Global Wearable Diabetes Devices Market Revenue Million Forecast, by Device 2019 & 2032
- Table 4: Global Wearable Diabetes Devices Market Volume K Unit Forecast, by Device 2019 & 2032
- Table 5: Global Wearable Diabetes Devices Market Revenue Million Forecast, by Type 2019 & 2032
- Table 6: Global Wearable Diabetes Devices Market Volume K Unit Forecast, by Type 2019 & 2032
- Table 7: Global Wearable Diabetes Devices Market Revenue Million Forecast, by End User 2019 & 2032
- Table 8: Global Wearable Diabetes Devices Market Volume K Unit Forecast, by End User 2019 & 2032
- Table 9: Global Wearable Diabetes Devices Market Revenue Million Forecast, by Region 2019 & 2032
- Table 10: Global Wearable Diabetes Devices Market Volume K Unit Forecast, by Region 2019 & 2032
- Table 11: Global Wearable Diabetes Devices Market Revenue Million Forecast, by Country 2019 & 2032
- Table 12: Global Wearable Diabetes Devices Market Volume K Unit Forecast, by Country 2019 & 2032
- Table 13: United States Wearable Diabetes Devices Market Revenue (Million) Forecast, by Application 2019 & 2032
- Table 14: United States Wearable Diabetes Devices Market Volume (K Unit) Forecast, by Application 2019 & 2032
- Table 15: Canada Wearable Diabetes Devices Market Revenue (Million) Forecast, by Application 2019 & 2032
- Table 16: Canada Wearable Diabetes Devices Market Volume (K Unit) Forecast, by Application 2019 & 2032
- Table 17: Mexico Wearable Diabetes Devices Market Revenue (Million) Forecast, by Application 2019 & 2032
- Table 18: Mexico Wearable Diabetes Devices Market Volume (K Unit) Forecast, by Application 2019 & 2032
- Table 19: Global Wearable Diabetes Devices Market Revenue Million Forecast, by Country 2019 & 2032
- Table 20: Global Wearable Diabetes Devices Market Volume K Unit Forecast, by Country 2019 & 2032
- Table 21: Germany Wearable Diabetes Devices Market Revenue (Million) Forecast, by Application 2019 & 2032
- Table 22: Germany Wearable Diabetes Devices Market Volume (K Unit) Forecast, by Application 2019 & 2032
- Table 23: United Kingdom Wearable Diabetes Devices Market Revenue (Million) Forecast, by Application 2019 & 2032
- Table 24: United Kingdom Wearable Diabetes Devices Market Volume (K Unit) Forecast, by Application 2019 & 2032
- Table 25: France Wearable Diabetes Devices Market Revenue (Million) Forecast, by Application 2019 & 2032
- Table 26: France Wearable Diabetes Devices Market Volume (K Unit) Forecast, by Application 2019 & 2032
- Table 27: Spain Wearable Diabetes Devices Market Revenue (Million) Forecast, by Application 2019 & 2032
- Table 28: Spain Wearable Diabetes Devices Market Volume (K Unit) Forecast, by Application 2019 & 2032
- Table 29: Italy Wearable Diabetes Devices Market Revenue (Million) Forecast, by Application 2019 & 2032
- Table 30: Italy Wearable Diabetes Devices Market Volume (K Unit) Forecast, by Application 2019 & 2032
- Table 31: Spain Wearable Diabetes Devices Market Revenue (Million) Forecast, by Application 2019 & 2032
- Table 32: Spain Wearable Diabetes Devices Market Volume (K Unit) Forecast, by Application 2019 & 2032
- Table 33: Belgium Wearable Diabetes Devices Market Revenue (Million) Forecast, by Application 2019 & 2032
- Table 34: Belgium Wearable Diabetes Devices Market Volume (K Unit) Forecast, by Application 2019 & 2032
- Table 35: Netherland Wearable Diabetes Devices Market Revenue (Million) Forecast, by Application 2019 & 2032
- Table 36: Netherland Wearable Diabetes Devices Market Volume (K Unit) Forecast, by Application 2019 & 2032
- Table 37: Nordics Wearable Diabetes Devices Market Revenue (Million) Forecast, by Application 2019 & 2032
- Table 38: Nordics Wearable Diabetes Devices Market Volume (K Unit) Forecast, by Application 2019 & 2032
- Table 39: Rest of Europe Wearable Diabetes Devices Market Revenue (Million) Forecast, by Application 2019 & 2032
- Table 40: Rest of Europe Wearable Diabetes Devices Market Volume (K Unit) Forecast, by Application 2019 & 2032
- Table 41: Global Wearable Diabetes Devices Market Revenue Million Forecast, by Country 2019 & 2032
- Table 42: Global Wearable Diabetes Devices Market Volume K Unit Forecast, by Country 2019 & 2032
- Table 43: China Wearable Diabetes Devices Market Revenue (Million) Forecast, by Application 2019 & 2032
- Table 44: China Wearable Diabetes Devices Market Volume (K Unit) Forecast, by Application 2019 & 2032
- Table 45: Japan Wearable Diabetes Devices Market Revenue (Million) Forecast, by Application 2019 & 2032
- Table 46: Japan Wearable Diabetes Devices Market Volume (K Unit) Forecast, by Application 2019 & 2032
- Table 47: India Wearable Diabetes Devices Market Revenue (Million) Forecast, by Application 2019 & 2032
- Table 48: India Wearable Diabetes Devices Market Volume (K Unit) Forecast, by Application 2019 & 2032
- Table 49: South Korea Wearable Diabetes Devices Market Revenue (Million) Forecast, by Application 2019 & 2032
- Table 50: South Korea Wearable Diabetes Devices Market Volume (K Unit) Forecast, by Application 2019 & 2032
- Table 51: Southeast Asia Wearable Diabetes Devices Market Revenue (Million) Forecast, by Application 2019 & 2032
- Table 52: Southeast Asia Wearable Diabetes Devices Market Volume (K Unit) Forecast, by Application 2019 & 2032
- Table 53: Australia Wearable Diabetes Devices Market Revenue (Million) Forecast, by Application 2019 & 2032
- Table 54: Australia Wearable Diabetes Devices Market Volume (K Unit) Forecast, by Application 2019 & 2032
- Table 55: Indonesia Wearable Diabetes Devices Market Revenue (Million) Forecast, by Application 2019 & 2032
- Table 56: Indonesia Wearable Diabetes Devices Market Volume (K Unit) Forecast, by Application 2019 & 2032
- Table 57: Phillipes Wearable Diabetes Devices Market Revenue (Million) Forecast, by Application 2019 & 2032
- Table 58: Phillipes Wearable Diabetes Devices Market Volume (K Unit) Forecast, by Application 2019 & 2032
- Table 59: Singapore Wearable Diabetes Devices Market Revenue (Million) Forecast, by Application 2019 & 2032
- Table 60: Singapore Wearable Diabetes Devices Market Volume (K Unit) Forecast, by Application 2019 & 2032
- Table 61: Thailandc Wearable Diabetes Devices Market Revenue (Million) Forecast, by Application 2019 & 2032
- Table 62: Thailandc Wearable Diabetes Devices Market Volume (K Unit) Forecast, by Application 2019 & 2032
- Table 63: Rest of Asia Pacific Wearable Diabetes Devices Market Revenue (Million) Forecast, by Application 2019 & 2032
- Table 64: Rest of Asia Pacific Wearable Diabetes Devices Market Volume (K Unit) Forecast, by Application 2019 & 2032
- Table 65: Global Wearable Diabetes Devices Market Revenue Million Forecast, by Country 2019 & 2032
- Table 66: Global Wearable Diabetes Devices Market Volume K Unit Forecast, by Country 2019 & 2032
- Table 67: Brazil Wearable Diabetes Devices Market Revenue (Million) Forecast, by Application 2019 & 2032
- Table 68: Brazil Wearable Diabetes Devices Market Volume (K Unit) Forecast, by Application 2019 & 2032
- Table 69: Argentina Wearable Diabetes Devices Market Revenue (Million) Forecast, by Application 2019 & 2032
- Table 70: Argentina Wearable Diabetes Devices Market Volume (K Unit) Forecast, by Application 2019 & 2032
- Table 71: Peru Wearable Diabetes Devices Market Revenue (Million) Forecast, by Application 2019 & 2032
- Table 72: Peru Wearable Diabetes Devices Market Volume (K Unit) Forecast, by Application 2019 & 2032
- Table 73: Chile Wearable Diabetes Devices Market Revenue (Million) Forecast, by Application 2019 & 2032
- Table 74: Chile Wearable Diabetes Devices Market Volume (K Unit) Forecast, by Application 2019 & 2032
- Table 75: Colombia Wearable Diabetes Devices Market Revenue (Million) Forecast, by Application 2019 & 2032
- Table 76: Colombia Wearable Diabetes Devices Market Volume (K Unit) Forecast, by Application 2019 & 2032
- Table 77: Ecuador Wearable Diabetes Devices Market Revenue (Million) Forecast, by Application 2019 & 2032
- Table 78: Ecuador Wearable Diabetes Devices Market Volume (K Unit) Forecast, by Application 2019 & 2032
- Table 79: Venezuela Wearable Diabetes Devices Market Revenue (Million) Forecast, by Application 2019 & 2032
- Table 80: Venezuela Wearable Diabetes Devices Market Volume (K Unit) Forecast, by Application 2019 & 2032
- Table 81: Rest of South America Wearable Diabetes Devices Market Revenue (Million) Forecast, by Application 2019 & 2032
- Table 82: Rest of South America Wearable Diabetes Devices Market Volume (K Unit) Forecast, by Application 2019 & 2032
- Table 83: Global Wearable Diabetes Devices Market Revenue Million Forecast, by Country 2019 & 2032
- Table 84: Global Wearable Diabetes Devices Market Volume K Unit Forecast, by Country 2019 & 2032
- Table 85: United Arab Emirates Wearable Diabetes Devices Market Revenue (Million) Forecast, by Application 2019 & 2032
- Table 86: United Arab Emirates Wearable Diabetes Devices Market Volume (K Unit) Forecast, by Application 2019 & 2032
- Table 87: Saudi Arabia Wearable Diabetes Devices Market Revenue (Million) Forecast, by Application 2019 & 2032
- Table 88: Saudi Arabia Wearable Diabetes Devices Market Volume (K Unit) Forecast, by Application 2019 & 2032
- Table 89: South Africa Wearable Diabetes Devices Market Revenue (Million) Forecast, by Application 2019 & 2032
- Table 90: South Africa Wearable Diabetes Devices Market Volume (K Unit) Forecast, by Application 2019 & 2032
- Table 91: Rest of Middle East and Africa Wearable Diabetes Devices Market Revenue (Million) Forecast, by Application 2019 & 2032
- Table 92: Rest of Middle East and Africa Wearable Diabetes Devices Market Volume (K Unit) Forecast, by Application 2019 & 2032
- Table 93: Global Wearable Diabetes Devices Market Revenue Million Forecast, by Device 2019 & 2032
- Table 94: Global Wearable Diabetes Devices Market Volume K Unit Forecast, by Device 2019 & 2032
- Table 95: Global Wearable Diabetes Devices Market Revenue Million Forecast, by Type 2019 & 2032
- Table 96: Global Wearable Diabetes Devices Market Volume K Unit Forecast, by Type 2019 & 2032
- Table 97: Global Wearable Diabetes Devices Market Revenue Million Forecast, by End User 2019 & 2032
- Table 98: Global Wearable Diabetes Devices Market Volume K Unit Forecast, by End User 2019 & 2032
- Table 99: Global Wearable Diabetes Devices Market Revenue Million Forecast, by Country 2019 & 2032
- Table 100: Global Wearable Diabetes Devices Market Volume K Unit Forecast, by Country 2019 & 2032
- Table 101: United States Wearable Diabetes Devices Market Revenue (Million) Forecast, by Application 2019 & 2032
- Table 102: United States Wearable Diabetes Devices Market Volume (K Unit) Forecast, by Application 2019 & 2032
- Table 103: Canada Wearable Diabetes Devices Market Revenue (Million) Forecast, by Application 2019 & 2032
- Table 104: Canada Wearable Diabetes Devices Market Volume (K Unit) Forecast, by Application 2019 & 2032
- Table 105: Rest of North America Wearable Diabetes Devices Market Revenue (Million) Forecast, by Application 2019 & 2032
- Table 106: Rest of North America Wearable Diabetes Devices Market Volume (K Unit) Forecast, by Application 2019 & 2032
- Table 107: Global Wearable Diabetes Devices Market Revenue Million Forecast, by Device 2019 & 2032
- Table 108: Global Wearable Diabetes Devices Market Volume K Unit Forecast, by Device 2019 & 2032
- Table 109: Global Wearable Diabetes Devices Market Revenue Million Forecast, by Type 2019 & 2032
- Table 110: Global Wearable Diabetes Devices Market Volume K Unit Forecast, by Type 2019 & 2032
- Table 111: Global Wearable Diabetes Devices Market Revenue Million Forecast, by End User 2019 & 2032
- Table 112: Global Wearable Diabetes Devices Market Volume K Unit Forecast, by End User 2019 & 2032
- Table 113: Global Wearable Diabetes Devices Market Revenue Million Forecast, by Country 2019 & 2032
- Table 114: Global Wearable Diabetes Devices Market Volume K Unit Forecast, by Country 2019 & 2032
- Table 115: France Wearable Diabetes Devices Market Revenue (Million) Forecast, by Application 2019 & 2032
- Table 116: France Wearable Diabetes Devices Market Volume (K Unit) Forecast, by Application 2019 & 2032
- Table 117: Germany Wearable Diabetes Devices Market Revenue (Million) Forecast, by Application 2019 & 2032
- Table 118: Germany Wearable Diabetes Devices Market Volume (K Unit) Forecast, by Application 2019 & 2032
- Table 119: Italy Wearable Diabetes Devices Market Revenue (Million) Forecast, by Application 2019 & 2032
- Table 120: Italy Wearable Diabetes Devices Market Volume (K Unit) Forecast, by Application 2019 & 2032
- Table 121: Spain Wearable Diabetes Devices Market Revenue (Million) Forecast, by Application 2019 & 2032
- Table 122: Spain Wearable Diabetes Devices Market Volume (K Unit) Forecast, by Application 2019 & 2032
- Table 123: United Kingdom Wearable Diabetes Devices Market Revenue (Million) Forecast, by Application 2019 & 2032
- Table 124: United Kingdom Wearable Diabetes Devices Market Volume (K Unit) Forecast, by Application 2019 & 2032
- Table 125: Russia Wearable Diabetes Devices Market Revenue (Million) Forecast, by Application 2019 & 2032
- Table 126: Russia Wearable Diabetes Devices Market Volume (K Unit) Forecast, by Application 2019 & 2032
- Table 127: Rest of Europe Wearable Diabetes Devices Market Revenue (Million) Forecast, by Application 2019 & 2032
- Table 128: Rest of Europe Wearable Diabetes Devices Market Volume (K Unit) Forecast, by Application 2019 & 2032
- Table 129: Global Wearable Diabetes Devices Market Revenue Million Forecast, by Device 2019 & 2032
- Table 130: Global Wearable Diabetes Devices Market Volume K Unit Forecast, by Device 2019 & 2032
- Table 131: Global Wearable Diabetes Devices Market Revenue Million Forecast, by Type 2019 & 2032
- Table 132: Global Wearable Diabetes Devices Market Volume K Unit Forecast, by Type 2019 & 2032
- Table 133: Global Wearable Diabetes Devices Market Revenue Million Forecast, by End User 2019 & 2032
- Table 134: Global Wearable Diabetes Devices Market Volume K Unit Forecast, by End User 2019 & 2032
- Table 135: Global Wearable Diabetes Devices Market Revenue Million Forecast, by Country 2019 & 2032
- Table 136: Global Wearable Diabetes Devices Market Volume K Unit Forecast, by Country 2019 & 2032
- Table 137: Mexico Wearable Diabetes Devices Market Revenue (Million) Forecast, by Application 2019 & 2032
- Table 138: Mexico Wearable Diabetes Devices Market Volume (K Unit) Forecast, by Application 2019 & 2032
- Table 139: Brazil Wearable Diabetes Devices Market Revenue (Million) Forecast, by Application 2019 & 2032
- Table 140: Brazil Wearable Diabetes Devices Market Volume (K Unit) Forecast, by Application 2019 & 2032
- Table 141: Rest of Latin America Wearable Diabetes Devices Market Revenue (Million) Forecast, by Application 2019 & 2032
- Table 142: Rest of Latin America Wearable Diabetes Devices Market Volume (K Unit) Forecast, by Application 2019 & 2032
- Table 143: Global Wearable Diabetes Devices Market Revenue Million Forecast, by Device 2019 & 2032
- Table 144: Global Wearable Diabetes Devices Market Volume K Unit Forecast, by Device 2019 & 2032
- Table 145: Global Wearable Diabetes Devices Market Revenue Million Forecast, by Type 2019 & 2032
- Table 146: Global Wearable Diabetes Devices Market Volume K Unit Forecast, by Type 2019 & 2032
- Table 147: Global Wearable Diabetes Devices Market Revenue Million Forecast, by End User 2019 & 2032
- Table 148: Global Wearable Diabetes Devices Market Volume K Unit Forecast, by End User 2019 & 2032
- Table 149: Global Wearable Diabetes Devices Market Revenue Million Forecast, by Country 2019 & 2032
- Table 150: Global Wearable Diabetes Devices Market Volume K Unit Forecast, by Country 2019 & 2032
- Table 151: Japan Wearable Diabetes Devices Market Revenue (Million) Forecast, by Application 2019 & 2032
- Table 152: Japan Wearable Diabetes Devices Market Volume (K Unit) Forecast, by Application 2019 & 2032
- Table 153: South Korea Wearable Diabetes Devices Market Revenue (Million) Forecast, by Application 2019 & 2032
- Table 154: South Korea Wearable Diabetes Devices Market Volume (K Unit) Forecast, by Application 2019 & 2032
- Table 155: China Wearable Diabetes Devices Market Revenue (Million) Forecast, by Application 2019 & 2032
- Table 156: China Wearable Diabetes Devices Market Volume (K Unit) Forecast, by Application 2019 & 2032
- Table 157: India Wearable Diabetes Devices Market Revenue (Million) Forecast, by Application 2019 & 2032
- Table 158: India Wearable Diabetes Devices Market Volume (K Unit) Forecast, by Application 2019 & 2032
- Table 159: Australia Wearable Diabetes Devices Market Revenue (Million) Forecast, by Application 2019 & 2032
- Table 160: Australia Wearable Diabetes Devices Market Volume (K Unit) Forecast, by Application 2019 & 2032
- Table 161: Vietnam Wearable Diabetes Devices Market Revenue (Million) Forecast, by Application 2019 & 2032
- Table 162: Vietnam Wearable Diabetes Devices Market Volume (K Unit) Forecast, by Application 2019 & 2032
- Table 163: Malaysia Wearable Diabetes Devices Market Revenue (Million) Forecast, by Application 2019 & 2032
- Table 164: Malaysia Wearable Diabetes Devices Market Volume (K Unit) Forecast, by Application 2019 & 2032
- Table 165: Indonesia Wearable Diabetes Devices Market Revenue (Million) Forecast, by Application 2019 & 2032
- Table 166: Indonesia Wearable Diabetes Devices Market Volume (K Unit) Forecast, by Application 2019 & 2032
- Table 167: Thailand Wearable Diabetes Devices Market Revenue (Million) Forecast, by Application 2019 & 2032
- Table 168: Thailand Wearable Diabetes Devices Market Volume (K Unit) Forecast, by Application 2019 & 2032
- Table 169: Rest of Asia Pacific Wearable Diabetes Devices Market Revenue (Million) Forecast, by Application 2019 & 2032
- Table 170: Rest of Asia Pacific Wearable Diabetes Devices Market Volume (K Unit) Forecast, by Application 2019 & 2032
- Table 171: Global Wearable Diabetes Devices Market Revenue Million Forecast, by Device 2019 & 2032
- Table 172: Global Wearable Diabetes Devices Market Volume K Unit Forecast, by Device 2019 & 2032
- Table 173: Global Wearable Diabetes Devices Market Revenue Million Forecast, by Type 2019 & 2032
- Table 174: Global Wearable Diabetes Devices Market Volume K Unit Forecast, by Type 2019 & 2032
- Table 175: Global Wearable Diabetes Devices Market Revenue Million Forecast, by End User 2019 & 2032
- Table 176: Global Wearable Diabetes Devices Market Volume K Unit Forecast, by End User 2019 & 2032
- Table 177: Global Wearable Diabetes Devices Market Revenue Million Forecast, by Country 2019 & 2032
- Table 178: Global Wearable Diabetes Devices Market Volume K Unit Forecast, by Country 2019 & 2032
- Table 179: Saudi Arabia Wearable Diabetes Devices Market Revenue (Million) Forecast, by Application 2019 & 2032
- Table 180: Saudi Arabia Wearable Diabetes Devices Market Volume (K Unit) Forecast, by Application 2019 & 2032
- Table 181: Iran Wearable Diabetes Devices Market Revenue (Million) Forecast, by Application 2019 & 2032
- Table 182: Iran Wearable Diabetes Devices Market Volume (K Unit) Forecast, by Application 2019 & 2032
- Table 183: Egypt Wearable Diabetes Devices Market Revenue (Million) Forecast, by Application 2019 & 2032
- Table 184: Egypt Wearable Diabetes Devices Market Volume (K Unit) Forecast, by Application 2019 & 2032
- Table 185: Oman Wearable Diabetes Devices Market Revenue (Million) Forecast, by Application 2019 & 2032
- Table 186: Oman Wearable Diabetes Devices Market Volume (K Unit) Forecast, by Application 2019 & 2032
- Table 187: South Africa Wearable Diabetes Devices Market Revenue (Million) Forecast, by Application 2019 & 2032
- Table 188: South Africa Wearable Diabetes Devices Market Volume (K Unit) Forecast, by Application 2019 & 2032
- Table 189: Rest of Middle East and Africa Wearable Diabetes Devices Market Revenue (Million) Forecast, by Application 2019 & 2032
- Table 190: Rest of Middle East and Africa Wearable Diabetes Devices Market Volume (K Unit) Forecast, by Application 2019 & 2032
Frequently Asked Questions
1. What is the projected Compound Annual Growth Rate (CAGR) of the Wearable Diabetes Devices Market?
The projected CAGR is approximately > 10.00%.
2. Which companies are prominent players in the Wearable Diabetes Devices Market?
Key companies in the market include Eversence, Medtronics, Tandem Diabetes Care, Ascensia, Insulet Corporation, Abbott, Ypsomped, Dexcom.
3. What are the main segments of the Wearable Diabetes Devices Market?
The market segments include Device, Type, End User.
4. Can you provide details about the market size?
The market size is estimated to be USD 11 Million as of 2022.
5. What are some drivers contributing to market growth?
Rapidly Increasing Incidence and Prevalence of Diabetes; Technological Advancements in the Market.
6. What are the notable trends driving market growth?
Rising diabetes prevalence globally is driving the market in forecast years.
7. Are there any restraints impacting market growth?
Monopolized Supply Chain and High Cost of Devices.
8. Can you provide examples of recent developments in the market?
May 2023: The Beta Bionics iLet ACE Pump and the iLet Dosing Decision Software have been granted clearance by the U.S. Food and Drug Administration for individuals aged six and above who have type 1 diabetes. When combined with a compatible FDA-cleared integrated continuous glucose monitor (iCGM), these two devices will create a novel system known as the iLet Bionic Pancreas. This innovative automated insulin dosing (AID) system employs an algorithm to ascertain and direct the administration of insulin.
9. What pricing options are available for accessing the report?
Pricing options include single-user, multi-user, and enterprise licenses priced at USD 4750, USD 5250, and USD 8750 respectively.
10. Is the market size provided in terms of value or volume?
The market size is provided in terms of value, measured in Million and volume, measured in K Unit.
11. Are there any specific market keywords associated with the report?
Yes, the market keyword associated with the report is "Wearable Diabetes Devices Market," which aids in identifying and referencing the specific market segment covered.
12. How do I determine which pricing option suits my needs best?
The pricing options vary based on user requirements and access needs. Individual users may opt for single-user licenses, while businesses requiring broader access may choose multi-user or enterprise licenses for cost-effective access to the report.
13. Are there any additional resources or data provided in the Wearable Diabetes Devices Market report?
While the report offers comprehensive insights, it's advisable to review the specific contents or supplementary materials provided to ascertain if additional resources or data are available.
14. How can I stay updated on further developments or reports in the Wearable Diabetes Devices Market?
To stay informed about further developments, trends, and reports in the Wearable Diabetes Devices Market, consider subscribing to industry newsletters, following relevant companies and organizations, or regularly checking reputable industry news sources and publications.
Methodology
Step 1 - Identification of Relevant Samples Size from Population Database


Step 2 - Approaches for Defining Global Market Size (Value, Volume* & Price*)

Note*: In applicable scenarios
Step 3 - Data Sources
Primary Research
- Web Analytics
- Survey Reports
- Research Institute
- Latest Research Reports
- Opinion Leaders
Secondary Research
- Annual Reports
- White Paper
- Latest Press Release
- Industry Association
- Paid Database
- Investor Presentations

Step 4 - Data Triangulation
Involves using different sources of information in order to increase the validity of a study
These sources are likely to be stakeholders in a program - participants, other researchers, program staff, other community members, and so on.
Then we put all data in single framework & apply various statistical tools to find out the dynamic on the market.
During the analysis stage, feedback from the stakeholder groups would be compared to determine areas of agreement as well as areas of divergence


