
Key Insights
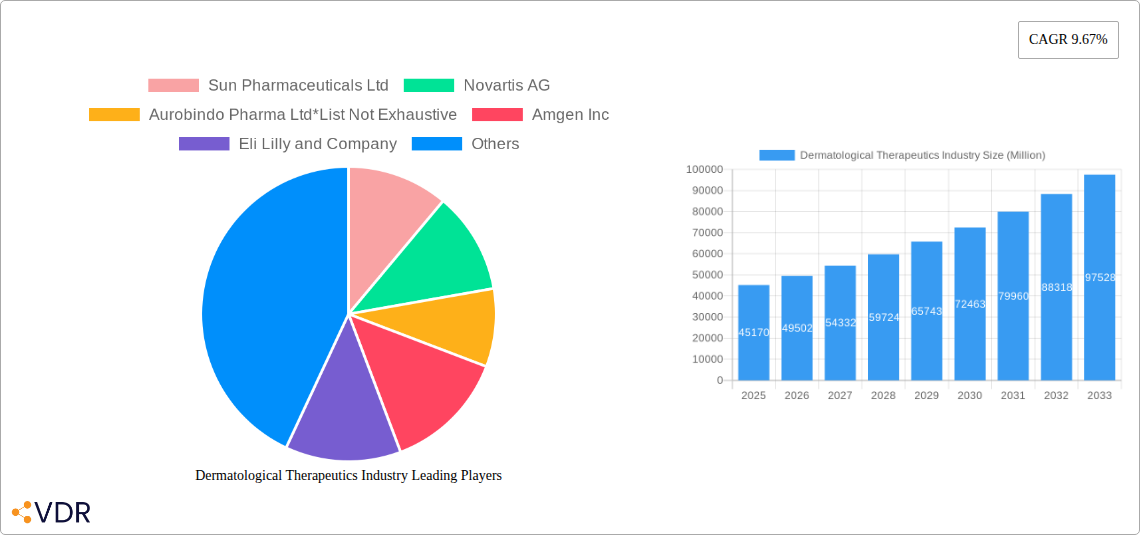
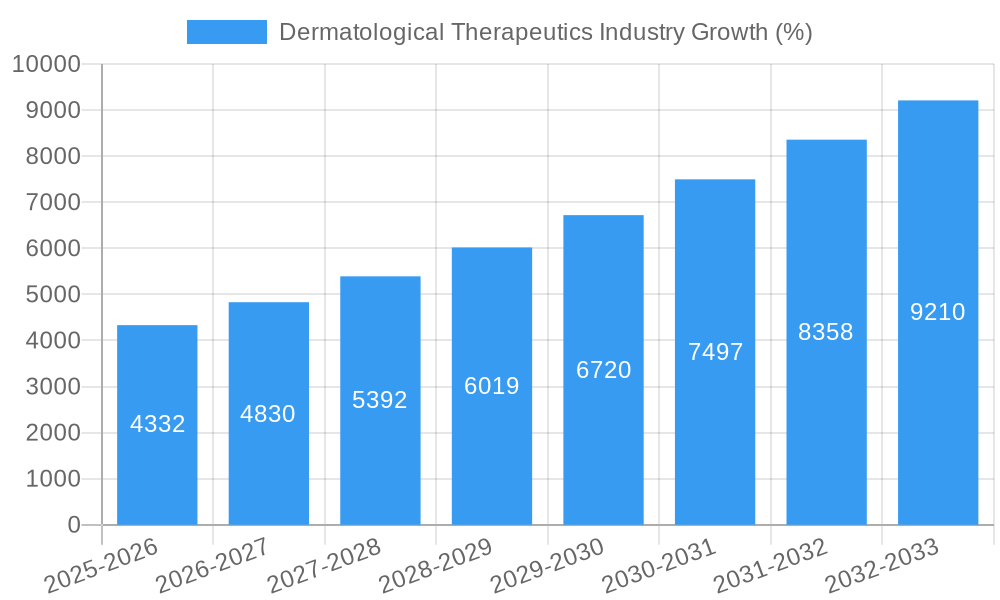
The dermatological therapeutics market, valued at $45.17 billion in 2025, exhibits robust growth potential, projected to expand at a Compound Annual Growth Rate (CAGR) of 9.67% from 2025 to 2033. This significant growth is driven by several key factors. Rising prevalence of chronic skin conditions like psoriasis, eczema (atopic dermatitis), and rosacea, coupled with an aging global population experiencing age-related skin issues, fuels demand for effective treatments. Increased awareness of skin health and improved access to healthcare, particularly in developing economies, further contributes to market expansion. Technological advancements leading to the development of novel therapies, such as biologics and targeted therapies, offering improved efficacy and reduced side effects, also significantly influence market growth. Furthermore, the increasing adoption of minimally invasive procedures and personalized medicine approaches are shaping market dynamics. The market segmentation reveals substantial opportunities across various applications (alopecia, herpes, psoriasis, rosacea, atopic dermatitis) and drug classes (anti-infectives, corticosteroids, anti-acne medications, calcineurin inhibitors, retinoids).
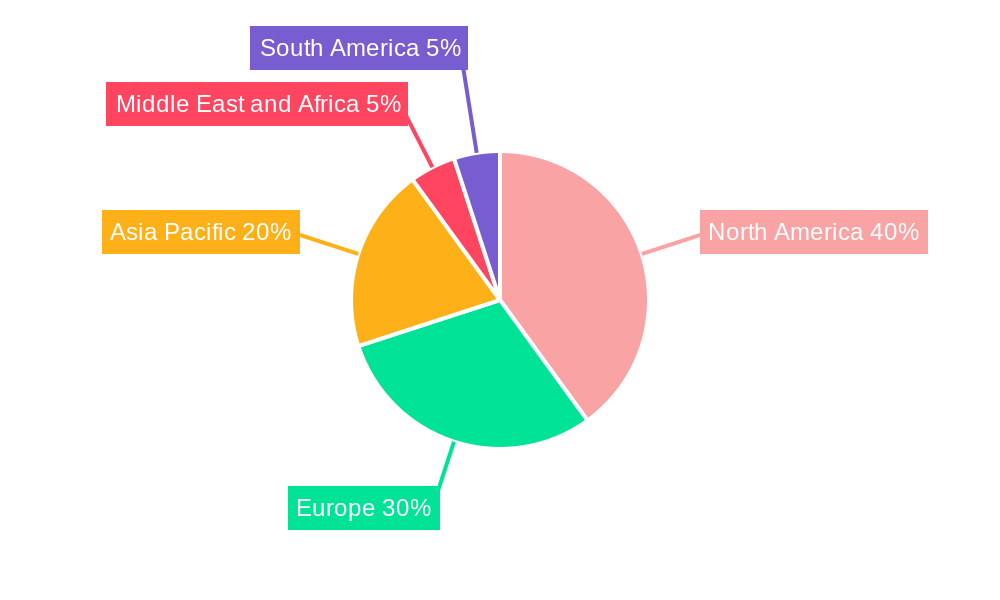
Competition within the dermatological therapeutics market is intense, with major pharmaceutical companies like Johnson & Johnson, AbbVie, Novartis, and Galderma holding significant market share. However, the market also presents opportunities for smaller, specialized companies focused on innovative therapies and niche applications. Geographic variations in market size and growth are expected, with North America and Europe likely to maintain a larger share due to higher healthcare expenditure and advanced healthcare infrastructure. Asia-Pacific is poised for substantial growth, driven by increasing disposable incomes, rising awareness of skin health, and expanding healthcare access. Regulatory approvals, pricing pressures, and the development of biosimilars represent key challenges to market growth, requiring companies to focus on innovation, strategic partnerships, and efficient manufacturing to maintain their competitiveness and profitability. The forecast period of 2025-2033 offers significant opportunities for growth and innovation in this dynamic market.
Dermatological Therapeutics Industry Market Report: 2019-2033
This comprehensive report provides a detailed analysis of the dermatological therapeutics market, encompassing market dynamics, growth trends, regional insights, product landscapes, and key player activities. With a focus on the parent market of pharmaceutical therapeutics and child markets like psoriasis and atopic dermatitis treatments, this report offers invaluable insights for industry professionals, investors, and stakeholders seeking to navigate this dynamic sector. The study period covers 2019-2033, with a base year of 2025 and a forecast period of 2025-2033. Market values are presented in million units.
Dermatological Therapeutics Industry Market Dynamics & Structure
The dermatological therapeutics market is characterized by a moderately concentrated landscape with several large multinational pharmaceutical companies holding significant market share. Technological innovation, driven by advancements in drug delivery systems and novel therapeutic modalities, is a key driver. Stringent regulatory frameworks, particularly in developed markets like the US and Europe, impact product development and market entry. The market witnesses continuous evolution with the emergence of biosimilars and innovative therapies, leading to competitive product substitution. End-user demographics, particularly the aging population and increasing prevalence of skin diseases, fuel market growth. Mergers and acquisitions (M&A) activity is moderate, with larger companies seeking to expand their portfolios through strategic acquisitions of smaller biotech firms.
- Market Concentration: Moderately concentrated, with top 10 players holding xx% market share in 2025.
- Technological Innovation: Focus on targeted therapies, biologics, and advanced drug delivery systems.
- Regulatory Landscape: Stringent FDA and EMA approvals impacting time to market.
- Competitive Substitutes: Biosimilars and generic drugs pose a challenge to branded products.
- M&A Activity: xx deals recorded between 2019-2024, with an average deal value of xx million.
- Innovation Barriers: High R&D costs and lengthy regulatory pathways.
Dermatological Therapeutics Industry Growth Trends & Insights
The dermatological therapeutics market exhibits robust growth, driven by rising prevalence of skin disorders, increasing healthcare expenditure, and growing awareness among consumers. The market size expanded from xx million in 2019 to xx million in 2024, registering a CAGR of xx%. This growth is expected to continue, with a projected market size of xx million by 2033, driven by factors like increasing adoption of novel therapies, technological advancements leading to improved efficacy and safety, and shifting consumer preferences towards personalized medicine. Market penetration of advanced therapies is increasing steadily, especially in developed regions. Technological disruptions, such as the development of personalized medicine approaches and AI-powered diagnostic tools, are reshaping the market dynamics.
Dominant Regions, Countries, or Segments in Dermatological Therapeutics Industry
North America currently dominates the dermatological therapeutics market, driven by high healthcare expenditure, advanced healthcare infrastructure, and high prevalence of skin diseases. Within North America, the United States holds the largest market share. Europe follows as a significant market, showcasing strong growth potential in various segments. The Asia-Pacific region is witnessing rapid expansion, driven by rising disposable incomes and increased healthcare awareness.
By Application: Psoriasis and atopic dermatitis segments represent the largest market share due to high prevalence and growing adoption of advanced therapies.
- Key Drivers (North America): High healthcare expenditure, advanced infrastructure, robust R&D investment.
- Key Drivers (Europe): Growing prevalence of chronic skin conditions, increasing awareness campaigns.
- Key Drivers (Asia-Pacific): Rising disposable incomes, increased healthcare awareness, expanding healthcare infrastructure.
- Dominant Drug Class: Corticosteroids and anti-infectives currently hold significant market share.
Dermatological Therapeutics Industry Product Landscape
The dermatological therapeutics market features a diverse range of products, including topical creams and ointments, oral medications, injectables, and phototherapy devices. Recent innovations focus on targeted therapies with enhanced efficacy and reduced side effects. Biologics, such as monoclonal antibodies, are gaining traction due to their targeted action and improved treatment outcomes. The market is witnessing the introduction of novel drug delivery systems, improving patient compliance and therapeutic outcomes. Unique selling propositions include improved efficacy, reduced side effects, and convenient administration routes.
Key Drivers, Barriers & Challenges in Dermatological Therapeutics Industry
Key Drivers: Rising prevalence of skin diseases, increasing healthcare expenditure, technological advancements, and growing consumer awareness. Government initiatives promoting skin health awareness and supportive reimbursement policies are further fueling market growth.
Key Barriers & Challenges: High R&D costs, stringent regulatory approvals, intense competition from generic drugs and biosimilars, and potential supply chain disruptions impact market growth. xx% of new drug candidates fail to secure regulatory approval, creating a significant barrier to market entry.
Emerging Opportunities in Dermatological Therapeutics Industry
Untapped markets in emerging economies, personalized medicine approaches, development of novel drug delivery systems (e.g., microneedle patches), and increased focus on cosmeceutical products represent key emerging opportunities. The growing interest in preventative dermatology and personalized skincare regimens creates further avenues for growth.
Growth Accelerators in the Dermatological Therapeutics Industry
Technological breakthroughs in drug discovery and development, strategic collaborations between pharmaceutical companies and biotech firms, and expansion into new geographical markets are key growth accelerators. The rising adoption of teledermatology and the development of AI-powered diagnostic tools are further driving market growth.
Key Players Shaping the Dermatological Therapeutics Industry Market
- Sun Pharmaceuticals Ltd
- Novartis AG
- Aurobindo Pharma Ltd
- Amgen Inc
- Eli Lilly and Company
- Galderma SA
- Abbvie Inc (Allergan PLC)
- Almirall SA
- Johnson & Johnson
- Bausch Health Companies Inc
- LEO Pharma AS
- Aclaris Therapeutics Inc
- Bristol-Myers Squibb Company
- GlaxoSmithKline PLC
- Pfizer Inc
Notable Milestones in Dermatological Therapeutics Industry Sector
- September 2022: US FDA approval of Sotyktu (deucravacitinib) for moderate-to-severe plaque psoriasis.
- July 2022: FDA approval of roflumilast cream (ZORYVE) for plaque psoriasis.
- January 2022: FDA approval of Rinvoq for refractory, moderate-to-severe atopic dermatitis. These approvals significantly impact market dynamics by introducing novel therapeutic options and expanding treatment possibilities.
In-Depth Dermatological Therapeutics Industry Market Outlook
The dermatological therapeutics market is poised for continued expansion, driven by persistent growth in prevalent skin diseases, technological innovation, and increasing healthcare expenditure. Strategic partnerships, market expansion into underserved regions, and development of personalized therapies present significant opportunities for future growth. The market's long-term outlook remains positive, with substantial potential for innovation and expansion.
Dermatological Therapeutics Industry Segmentation
-
1. Application
- 1.1. Alopecia
- 1.2. Herpes
- 1.3. Psoriasis
- 1.4. Rosacea
- 1.5. Atopic Dermatitis
- 1.6. Other Applications
-
2. Drug Class
- 2.1. Anti-infectives
- 2.2. Corticosteroids
- 2.3. Anti-acne
- 2.4. Calcineurin Inhibitors
- 2.5. Retinoids
- 2.6. Other Drug Classes
Dermatological Therapeutics Industry Segmentation By Geography
-
1. North America
- 1.1. United States
- 1.2. Canada
- 1.3. Mexico
-
2. Europe
- 2.1. Germany
- 2.2. United Kingdom
- 2.3. France
- 2.4. Italy
- 2.5. Spain
- 2.6. Rest of Europe
-
3. Asia Pacific
- 3.1. China
- 3.2. Japan
- 3.3. India
- 3.4. Australia
- 3.5. South Korea
- 3.6. Rest of Asia Pacific
-
4. Middle East and Africa
- 4.1. GCC
- 4.2. South Africa
- 4.3. Rest of Middle East and Africa
-
5. South America
- 5.1. Brazil
- 5.2. Argentina
- 5.3. Rest of South America
Dermatological Therapeutics Industry REPORT HIGHLIGHTS
| Aspects | Details |
|---|---|
| Study Period | 2019-2033 |
| Base Year | 2024 |
| Estimated Year | 2025 |
| Forecast Period | 2025-2033 |
| Historical Period | 2019-2024 |
| Growth Rate | CAGR of 9.67% from 2019-2033 |
| Segmentation |
|
Table of Contents
- 1. Introduction
- 1.1. Research Scope
- 1.2. Market Segmentation
- 1.3. Research Methodology
- 1.4. Definitions and Assumptions
- 2. Executive Summary
- 2.1. Introduction
- 3. Market Dynamics
- 3.1. Introduction
- 3.2. Market Drivers
- 3.2.1. Growing Burden of Dermatology Diseases; Increasing Awareness Levels of Disease Progression and Etiology; Increasing Elderly Population
- 3.3. Market Restrains
- 3.3.1. Serious Side Effects for Certain Classes of Therapeutic Drugs
- 3.4. Market Trends
- 3.4.1. Psoriasis Segment is Expected to Hold a Significant Market Share Over the Forecast Period
- 4. Market Factor Analysis
- 4.1. Porters Five Forces
- 4.2. Supply/Value Chain
- 4.3. PESTEL analysis
- 4.4. Market Entropy
- 4.5. Patent/Trademark Analysis
- 5. Global Dermatological Therapeutics Industry Analysis, Insights and Forecast, 2019-2031
- 5.1. Market Analysis, Insights and Forecast - by Application
- 5.1.1. Alopecia
- 5.1.2. Herpes
- 5.1.3. Psoriasis
- 5.1.4. Rosacea
- 5.1.5. Atopic Dermatitis
- 5.1.6. Other Applications
- 5.2. Market Analysis, Insights and Forecast - by Drug Class
- 5.2.1. Anti-infectives
- 5.2.2. Corticosteroids
- 5.2.3. Anti-acne
- 5.2.4. Calcineurin Inhibitors
- 5.2.5. Retinoids
- 5.2.6. Other Drug Classes
- 5.3. Market Analysis, Insights and Forecast - by Region
- 5.3.1. North America
- 5.3.2. Europe
- 5.3.3. Asia Pacific
- 5.3.4. Middle East and Africa
- 5.3.5. South America
- 5.1. Market Analysis, Insights and Forecast - by Application
- 6. North America Dermatological Therapeutics Industry Analysis, Insights and Forecast, 2019-2031
- 6.1. Market Analysis, Insights and Forecast - by Application
- 6.1.1. Alopecia
- 6.1.2. Herpes
- 6.1.3. Psoriasis
- 6.1.4. Rosacea
- 6.1.5. Atopic Dermatitis
- 6.1.6. Other Applications
- 6.2. Market Analysis, Insights and Forecast - by Drug Class
- 6.2.1. Anti-infectives
- 6.2.2. Corticosteroids
- 6.2.3. Anti-acne
- 6.2.4. Calcineurin Inhibitors
- 6.2.5. Retinoids
- 6.2.6. Other Drug Classes
- 6.1. Market Analysis, Insights and Forecast - by Application
- 7. Europe Dermatological Therapeutics Industry Analysis, Insights and Forecast, 2019-2031
- 7.1. Market Analysis, Insights and Forecast - by Application
- 7.1.1. Alopecia
- 7.1.2. Herpes
- 7.1.3. Psoriasis
- 7.1.4. Rosacea
- 7.1.5. Atopic Dermatitis
- 7.1.6. Other Applications
- 7.2. Market Analysis, Insights and Forecast - by Drug Class
- 7.2.1. Anti-infectives
- 7.2.2. Corticosteroids
- 7.2.3. Anti-acne
- 7.2.4. Calcineurin Inhibitors
- 7.2.5. Retinoids
- 7.2.6. Other Drug Classes
- 7.1. Market Analysis, Insights and Forecast - by Application
- 8. Asia Pacific Dermatological Therapeutics Industry Analysis, Insights and Forecast, 2019-2031
- 8.1. Market Analysis, Insights and Forecast - by Application
- 8.1.1. Alopecia
- 8.1.2. Herpes
- 8.1.3. Psoriasis
- 8.1.4. Rosacea
- 8.1.5. Atopic Dermatitis
- 8.1.6. Other Applications
- 8.2. Market Analysis, Insights and Forecast - by Drug Class
- 8.2.1. Anti-infectives
- 8.2.2. Corticosteroids
- 8.2.3. Anti-acne
- 8.2.4. Calcineurin Inhibitors
- 8.2.5. Retinoids
- 8.2.6. Other Drug Classes
- 8.1. Market Analysis, Insights and Forecast - by Application
- 9. Middle East and Africa Dermatological Therapeutics Industry Analysis, Insights and Forecast, 2019-2031
- 9.1. Market Analysis, Insights and Forecast - by Application
- 9.1.1. Alopecia
- 9.1.2. Herpes
- 9.1.3. Psoriasis
- 9.1.4. Rosacea
- 9.1.5. Atopic Dermatitis
- 9.1.6. Other Applications
- 9.2. Market Analysis, Insights and Forecast - by Drug Class
- 9.2.1. Anti-infectives
- 9.2.2. Corticosteroids
- 9.2.3. Anti-acne
- 9.2.4. Calcineurin Inhibitors
- 9.2.5. Retinoids
- 9.2.6. Other Drug Classes
- 9.1. Market Analysis, Insights and Forecast - by Application
- 10. South America Dermatological Therapeutics Industry Analysis, Insights and Forecast, 2019-2031
- 10.1. Market Analysis, Insights and Forecast - by Application
- 10.1.1. Alopecia
- 10.1.2. Herpes
- 10.1.3. Psoriasis
- 10.1.4. Rosacea
- 10.1.5. Atopic Dermatitis
- 10.1.6. Other Applications
- 10.2. Market Analysis, Insights and Forecast - by Drug Class
- 10.2.1. Anti-infectives
- 10.2.2. Corticosteroids
- 10.2.3. Anti-acne
- 10.2.4. Calcineurin Inhibitors
- 10.2.5. Retinoids
- 10.2.6. Other Drug Classes
- 10.1. Market Analysis, Insights and Forecast - by Application
- 11. North America Dermatological Therapeutics Industry Analysis, Insights and Forecast, 2019-2031
- 11.1. Market Analysis, Insights and Forecast - By Country/Sub-region
- 11.1.1 United States
- 11.1.2 Canada
- 11.1.3 Mexico
- 12. Europe Dermatological Therapeutics Industry Analysis, Insights and Forecast, 2019-2031
- 12.1. Market Analysis, Insights and Forecast - By Country/Sub-region
- 12.1.1 Germany
- 12.1.2 United Kingdom
- 12.1.3 France
- 12.1.4 Italy
- 12.1.5 Spain
- 12.1.6 Rest of Europe
- 13. Asia Pacific Dermatological Therapeutics Industry Analysis, Insights and Forecast, 2019-2031
- 13.1. Market Analysis, Insights and Forecast - By Country/Sub-region
- 13.1.1 China
- 13.1.2 Japan
- 13.1.3 India
- 13.1.4 Australia
- 13.1.5 South Korea
- 13.1.6 Rest of Asia Pacific
- 14. Middle East and Africa Dermatological Therapeutics Industry Analysis, Insights and Forecast, 2019-2031
- 14.1. Market Analysis, Insights and Forecast - By Country/Sub-region
- 14.1.1 GCC
- 14.1.2 South Africa
- 14.1.3 Rest of Middle East and Africa
- 15. South America Dermatological Therapeutics Industry Analysis, Insights and Forecast, 2019-2031
- 15.1. Market Analysis, Insights and Forecast - By Country/Sub-region
- 15.1.1 Brazil
- 15.1.2 Argentina
- 15.1.3 Rest of South America
- 16. Competitive Analysis
- 16.1. Global Market Share Analysis 2024
- 16.2. Company Profiles
- 16.2.1 Sun Pharmaceuticals Ltd
- 16.2.1.1. Overview
- 16.2.1.2. Products
- 16.2.1.3. SWOT Analysis
- 16.2.1.4. Recent Developments
- 16.2.1.5. Financials (Based on Availability)
- 16.2.2 Novartis AG
- 16.2.2.1. Overview
- 16.2.2.2. Products
- 16.2.2.3. SWOT Analysis
- 16.2.2.4. Recent Developments
- 16.2.2.5. Financials (Based on Availability)
- 16.2.3 Aurobindo Pharma Ltd*List Not Exhaustive
- 16.2.3.1. Overview
- 16.2.3.2. Products
- 16.2.3.3. SWOT Analysis
- 16.2.3.4. Recent Developments
- 16.2.3.5. Financials (Based on Availability)
- 16.2.4 Amgen Inc
- 16.2.4.1. Overview
- 16.2.4.2. Products
- 16.2.4.3. SWOT Analysis
- 16.2.4.4. Recent Developments
- 16.2.4.5. Financials (Based on Availability)
- 16.2.5 Eli Lilly and Company
- 16.2.5.1. Overview
- 16.2.5.2. Products
- 16.2.5.3. SWOT Analysis
- 16.2.5.4. Recent Developments
- 16.2.5.5. Financials (Based on Availability)
- 16.2.6 Galderma SA
- 16.2.6.1. Overview
- 16.2.6.2. Products
- 16.2.6.3. SWOT Analysis
- 16.2.6.4. Recent Developments
- 16.2.6.5. Financials (Based on Availability)
- 16.2.7 Abbvie Inc (Allergan PLC)
- 16.2.7.1. Overview
- 16.2.7.2. Products
- 16.2.7.3. SWOT Analysis
- 16.2.7.4. Recent Developments
- 16.2.7.5. Financials (Based on Availability)
- 16.2.8 Almirall SA
- 16.2.8.1. Overview
- 16.2.8.2. Products
- 16.2.8.3. SWOT Analysis
- 16.2.8.4. Recent Developments
- 16.2.8.5. Financials (Based on Availability)
- 16.2.9 Johnson & Johnson
- 16.2.9.1. Overview
- 16.2.9.2. Products
- 16.2.9.3. SWOT Analysis
- 16.2.9.4. Recent Developments
- 16.2.9.5. Financials (Based on Availability)
- 16.2.10 Bausch Health Companies Inc
- 16.2.10.1. Overview
- 16.2.10.2. Products
- 16.2.10.3. SWOT Analysis
- 16.2.10.4. Recent Developments
- 16.2.10.5. Financials (Based on Availability)
- 16.2.11 LEO Pharma AS
- 16.2.11.1. Overview
- 16.2.11.2. Products
- 16.2.11.3. SWOT Analysis
- 16.2.11.4. Recent Developments
- 16.2.11.5. Financials (Based on Availability)
- 16.2.12 Aclaris Therapeutics Inc
- 16.2.12.1. Overview
- 16.2.12.2. Products
- 16.2.12.3. SWOT Analysis
- 16.2.12.4. Recent Developments
- 16.2.12.5. Financials (Based on Availability)
- 16.2.13 Bristol-Myers Squibb Company
- 16.2.13.1. Overview
- 16.2.13.2. Products
- 16.2.13.3. SWOT Analysis
- 16.2.13.4. Recent Developments
- 16.2.13.5. Financials (Based on Availability)
- 16.2.14 GlaxoSmithKline PLC
- 16.2.14.1. Overview
- 16.2.14.2. Products
- 16.2.14.3. SWOT Analysis
- 16.2.14.4. Recent Developments
- 16.2.14.5. Financials (Based on Availability)
- 16.2.15 Pfizer Inc
- 16.2.15.1. Overview
- 16.2.15.2. Products
- 16.2.15.3. SWOT Analysis
- 16.2.15.4. Recent Developments
- 16.2.15.5. Financials (Based on Availability)
- 16.2.1 Sun Pharmaceuticals Ltd
List of Figures
- Figure 1: Global Dermatological Therapeutics Industry Revenue Breakdown (Million, %) by Region 2024 & 2032
- Figure 2: North America Dermatological Therapeutics Industry Revenue (Million), by Country 2024 & 2032
- Figure 3: North America Dermatological Therapeutics Industry Revenue Share (%), by Country 2024 & 2032
- Figure 4: Europe Dermatological Therapeutics Industry Revenue (Million), by Country 2024 & 2032
- Figure 5: Europe Dermatological Therapeutics Industry Revenue Share (%), by Country 2024 & 2032
- Figure 6: Asia Pacific Dermatological Therapeutics Industry Revenue (Million), by Country 2024 & 2032
- Figure 7: Asia Pacific Dermatological Therapeutics Industry Revenue Share (%), by Country 2024 & 2032
- Figure 8: Middle East and Africa Dermatological Therapeutics Industry Revenue (Million), by Country 2024 & 2032
- Figure 9: Middle East and Africa Dermatological Therapeutics Industry Revenue Share (%), by Country 2024 & 2032
- Figure 10: South America Dermatological Therapeutics Industry Revenue (Million), by Country 2024 & 2032
- Figure 11: South America Dermatological Therapeutics Industry Revenue Share (%), by Country 2024 & 2032
- Figure 12: North America Dermatological Therapeutics Industry Revenue (Million), by Application 2024 & 2032
- Figure 13: North America Dermatological Therapeutics Industry Revenue Share (%), by Application 2024 & 2032
- Figure 14: North America Dermatological Therapeutics Industry Revenue (Million), by Drug Class 2024 & 2032
- Figure 15: North America Dermatological Therapeutics Industry Revenue Share (%), by Drug Class 2024 & 2032
- Figure 16: North America Dermatological Therapeutics Industry Revenue (Million), by Country 2024 & 2032
- Figure 17: North America Dermatological Therapeutics Industry Revenue Share (%), by Country 2024 & 2032
- Figure 18: Europe Dermatological Therapeutics Industry Revenue (Million), by Application 2024 & 2032
- Figure 19: Europe Dermatological Therapeutics Industry Revenue Share (%), by Application 2024 & 2032
- Figure 20: Europe Dermatological Therapeutics Industry Revenue (Million), by Drug Class 2024 & 2032
- Figure 21: Europe Dermatological Therapeutics Industry Revenue Share (%), by Drug Class 2024 & 2032
- Figure 22: Europe Dermatological Therapeutics Industry Revenue (Million), by Country 2024 & 2032
- Figure 23: Europe Dermatological Therapeutics Industry Revenue Share (%), by Country 2024 & 2032
- Figure 24: Asia Pacific Dermatological Therapeutics Industry Revenue (Million), by Application 2024 & 2032
- Figure 25: Asia Pacific Dermatological Therapeutics Industry Revenue Share (%), by Application 2024 & 2032
- Figure 26: Asia Pacific Dermatological Therapeutics Industry Revenue (Million), by Drug Class 2024 & 2032
- Figure 27: Asia Pacific Dermatological Therapeutics Industry Revenue Share (%), by Drug Class 2024 & 2032
- Figure 28: Asia Pacific Dermatological Therapeutics Industry Revenue (Million), by Country 2024 & 2032
- Figure 29: Asia Pacific Dermatological Therapeutics Industry Revenue Share (%), by Country 2024 & 2032
- Figure 30: Middle East and Africa Dermatological Therapeutics Industry Revenue (Million), by Application 2024 & 2032
- Figure 31: Middle East and Africa Dermatological Therapeutics Industry Revenue Share (%), by Application 2024 & 2032
- Figure 32: Middle East and Africa Dermatological Therapeutics Industry Revenue (Million), by Drug Class 2024 & 2032
- Figure 33: Middle East and Africa Dermatological Therapeutics Industry Revenue Share (%), by Drug Class 2024 & 2032
- Figure 34: Middle East and Africa Dermatological Therapeutics Industry Revenue (Million), by Country 2024 & 2032
- Figure 35: Middle East and Africa Dermatological Therapeutics Industry Revenue Share (%), by Country 2024 & 2032
- Figure 36: South America Dermatological Therapeutics Industry Revenue (Million), by Application 2024 & 2032
- Figure 37: South America Dermatological Therapeutics Industry Revenue Share (%), by Application 2024 & 2032
- Figure 38: South America Dermatological Therapeutics Industry Revenue (Million), by Drug Class 2024 & 2032
- Figure 39: South America Dermatological Therapeutics Industry Revenue Share (%), by Drug Class 2024 & 2032
- Figure 40: South America Dermatological Therapeutics Industry Revenue (Million), by Country 2024 & 2032
- Figure 41: South America Dermatological Therapeutics Industry Revenue Share (%), by Country 2024 & 2032
List of Tables
- Table 1: Global Dermatological Therapeutics Industry Revenue Million Forecast, by Region 2019 & 2032
- Table 2: Global Dermatological Therapeutics Industry Revenue Million Forecast, by Application 2019 & 2032
- Table 3: Global Dermatological Therapeutics Industry Revenue Million Forecast, by Drug Class 2019 & 2032
- Table 4: Global Dermatological Therapeutics Industry Revenue Million Forecast, by Region 2019 & 2032
- Table 5: Global Dermatological Therapeutics Industry Revenue Million Forecast, by Country 2019 & 2032
- Table 6: United States Dermatological Therapeutics Industry Revenue (Million) Forecast, by Application 2019 & 2032
- Table 7: Canada Dermatological Therapeutics Industry Revenue (Million) Forecast, by Application 2019 & 2032
- Table 8: Mexico Dermatological Therapeutics Industry Revenue (Million) Forecast, by Application 2019 & 2032
- Table 9: Global Dermatological Therapeutics Industry Revenue Million Forecast, by Country 2019 & 2032
- Table 10: Germany Dermatological Therapeutics Industry Revenue (Million) Forecast, by Application 2019 & 2032
- Table 11: United Kingdom Dermatological Therapeutics Industry Revenue (Million) Forecast, by Application 2019 & 2032
- Table 12: France Dermatological Therapeutics Industry Revenue (Million) Forecast, by Application 2019 & 2032
- Table 13: Italy Dermatological Therapeutics Industry Revenue (Million) Forecast, by Application 2019 & 2032
- Table 14: Spain Dermatological Therapeutics Industry Revenue (Million) Forecast, by Application 2019 & 2032
- Table 15: Rest of Europe Dermatological Therapeutics Industry Revenue (Million) Forecast, by Application 2019 & 2032
- Table 16: Global Dermatological Therapeutics Industry Revenue Million Forecast, by Country 2019 & 2032
- Table 17: China Dermatological Therapeutics Industry Revenue (Million) Forecast, by Application 2019 & 2032
- Table 18: Japan Dermatological Therapeutics Industry Revenue (Million) Forecast, by Application 2019 & 2032
- Table 19: India Dermatological Therapeutics Industry Revenue (Million) Forecast, by Application 2019 & 2032
- Table 20: Australia Dermatological Therapeutics Industry Revenue (Million) Forecast, by Application 2019 & 2032
- Table 21: South Korea Dermatological Therapeutics Industry Revenue (Million) Forecast, by Application 2019 & 2032
- Table 22: Rest of Asia Pacific Dermatological Therapeutics Industry Revenue (Million) Forecast, by Application 2019 & 2032
- Table 23: Global Dermatological Therapeutics Industry Revenue Million Forecast, by Country 2019 & 2032
- Table 24: GCC Dermatological Therapeutics Industry Revenue (Million) Forecast, by Application 2019 & 2032
- Table 25: South Africa Dermatological Therapeutics Industry Revenue (Million) Forecast, by Application 2019 & 2032
- Table 26: Rest of Middle East and Africa Dermatological Therapeutics Industry Revenue (Million) Forecast, by Application 2019 & 2032
- Table 27: Global Dermatological Therapeutics Industry Revenue Million Forecast, by Country 2019 & 2032
- Table 28: Brazil Dermatological Therapeutics Industry Revenue (Million) Forecast, by Application 2019 & 2032
- Table 29: Argentina Dermatological Therapeutics Industry Revenue (Million) Forecast, by Application 2019 & 2032
- Table 30: Rest of South America Dermatological Therapeutics Industry Revenue (Million) Forecast, by Application 2019 & 2032
- Table 31: Global Dermatological Therapeutics Industry Revenue Million Forecast, by Application 2019 & 2032
- Table 32: Global Dermatological Therapeutics Industry Revenue Million Forecast, by Drug Class 2019 & 2032
- Table 33: Global Dermatological Therapeutics Industry Revenue Million Forecast, by Country 2019 & 2032
- Table 34: United States Dermatological Therapeutics Industry Revenue (Million) Forecast, by Application 2019 & 2032
- Table 35: Canada Dermatological Therapeutics Industry Revenue (Million) Forecast, by Application 2019 & 2032
- Table 36: Mexico Dermatological Therapeutics Industry Revenue (Million) Forecast, by Application 2019 & 2032
- Table 37: Global Dermatological Therapeutics Industry Revenue Million Forecast, by Application 2019 & 2032
- Table 38: Global Dermatological Therapeutics Industry Revenue Million Forecast, by Drug Class 2019 & 2032
- Table 39: Global Dermatological Therapeutics Industry Revenue Million Forecast, by Country 2019 & 2032
- Table 40: Germany Dermatological Therapeutics Industry Revenue (Million) Forecast, by Application 2019 & 2032
- Table 41: United Kingdom Dermatological Therapeutics Industry Revenue (Million) Forecast, by Application 2019 & 2032
- Table 42: France Dermatological Therapeutics Industry Revenue (Million) Forecast, by Application 2019 & 2032
- Table 43: Italy Dermatological Therapeutics Industry Revenue (Million) Forecast, by Application 2019 & 2032
- Table 44: Spain Dermatological Therapeutics Industry Revenue (Million) Forecast, by Application 2019 & 2032
- Table 45: Rest of Europe Dermatological Therapeutics Industry Revenue (Million) Forecast, by Application 2019 & 2032
- Table 46: Global Dermatological Therapeutics Industry Revenue Million Forecast, by Application 2019 & 2032
- Table 47: Global Dermatological Therapeutics Industry Revenue Million Forecast, by Drug Class 2019 & 2032
- Table 48: Global Dermatological Therapeutics Industry Revenue Million Forecast, by Country 2019 & 2032
- Table 49: China Dermatological Therapeutics Industry Revenue (Million) Forecast, by Application 2019 & 2032
- Table 50: Japan Dermatological Therapeutics Industry Revenue (Million) Forecast, by Application 2019 & 2032
- Table 51: India Dermatological Therapeutics Industry Revenue (Million) Forecast, by Application 2019 & 2032
- Table 52: Australia Dermatological Therapeutics Industry Revenue (Million) Forecast, by Application 2019 & 2032
- Table 53: South Korea Dermatological Therapeutics Industry Revenue (Million) Forecast, by Application 2019 & 2032
- Table 54: Rest of Asia Pacific Dermatological Therapeutics Industry Revenue (Million) Forecast, by Application 2019 & 2032
- Table 55: Global Dermatological Therapeutics Industry Revenue Million Forecast, by Application 2019 & 2032
- Table 56: Global Dermatological Therapeutics Industry Revenue Million Forecast, by Drug Class 2019 & 2032
- Table 57: Global Dermatological Therapeutics Industry Revenue Million Forecast, by Country 2019 & 2032
- Table 58: GCC Dermatological Therapeutics Industry Revenue (Million) Forecast, by Application 2019 & 2032
- Table 59: South Africa Dermatological Therapeutics Industry Revenue (Million) Forecast, by Application 2019 & 2032
- Table 60: Rest of Middle East and Africa Dermatological Therapeutics Industry Revenue (Million) Forecast, by Application 2019 & 2032
- Table 61: Global Dermatological Therapeutics Industry Revenue Million Forecast, by Application 2019 & 2032
- Table 62: Global Dermatological Therapeutics Industry Revenue Million Forecast, by Drug Class 2019 & 2032
- Table 63: Global Dermatological Therapeutics Industry Revenue Million Forecast, by Country 2019 & 2032
- Table 64: Brazil Dermatological Therapeutics Industry Revenue (Million) Forecast, by Application 2019 & 2032
- Table 65: Argentina Dermatological Therapeutics Industry Revenue (Million) Forecast, by Application 2019 & 2032
- Table 66: Rest of South America Dermatological Therapeutics Industry Revenue (Million) Forecast, by Application 2019 & 2032
Frequently Asked Questions
1. What is the projected Compound Annual Growth Rate (CAGR) of the Dermatological Therapeutics Industry?
The projected CAGR is approximately 9.67%.
2. Which companies are prominent players in the Dermatological Therapeutics Industry?
Key companies in the market include Sun Pharmaceuticals Ltd, Novartis AG, Aurobindo Pharma Ltd*List Not Exhaustive, Amgen Inc, Eli Lilly and Company, Galderma SA, Abbvie Inc (Allergan PLC), Almirall SA, Johnson & Johnson, Bausch Health Companies Inc, LEO Pharma AS, Aclaris Therapeutics Inc, Bristol-Myers Squibb Company, GlaxoSmithKline PLC, Pfizer Inc.
3. What are the main segments of the Dermatological Therapeutics Industry?
The market segments include Application, Drug Class.
4. Can you provide details about the market size?
The market size is estimated to be USD 45.17 Million as of 2022.
5. What are some drivers contributing to market growth?
Growing Burden of Dermatology Diseases; Increasing Awareness Levels of Disease Progression and Etiology; Increasing Elderly Population.
6. What are the notable trends driving market growth?
Psoriasis Segment is Expected to Hold a Significant Market Share Over the Forecast Period.
7. Are there any restraints impacting market growth?
Serious Side Effects for Certain Classes of Therapeutic Drugs.
8. Can you provide examples of recent developments in the market?
In September 2022, the US FDA approved Sotyktu (deucravacitinib), an oral treatment for adults with moderate-to-severe plaque psoriasis who are candidates for systemic therapy or phototherapy.
9. What pricing options are available for accessing the report?
Pricing options include single-user, multi-user, and enterprise licenses priced at USD 4750, USD 5250, and USD 8750 respectively.
10. Is the market size provided in terms of value or volume?
The market size is provided in terms of value, measured in Million.
11. Are there any specific market keywords associated with the report?
Yes, the market keyword associated with the report is "Dermatological Therapeutics Industry," which aids in identifying and referencing the specific market segment covered.
12. How do I determine which pricing option suits my needs best?
The pricing options vary based on user requirements and access needs. Individual users may opt for single-user licenses, while businesses requiring broader access may choose multi-user or enterprise licenses for cost-effective access to the report.
13. Are there any additional resources or data provided in the Dermatological Therapeutics Industry report?
While the report offers comprehensive insights, it's advisable to review the specific contents or supplementary materials provided to ascertain if additional resources or data are available.
14. How can I stay updated on further developments or reports in the Dermatological Therapeutics Industry?
To stay informed about further developments, trends, and reports in the Dermatological Therapeutics Industry, consider subscribing to industry newsletters, following relevant companies and organizations, or regularly checking reputable industry news sources and publications.
Methodology
Step 1 - Identification of Relevant Samples Size from Population Database


Step 2 - Approaches for Defining Global Market Size (Value, Volume* & Price*)

Note*: In applicable scenarios
Step 3 - Data Sources
Primary Research
- Web Analytics
- Survey Reports
- Research Institute
- Latest Research Reports
- Opinion Leaders
Secondary Research
- Annual Reports
- White Paper
- Latest Press Release
- Industry Association
- Paid Database
- Investor Presentations

Step 4 - Data Triangulation
Involves using different sources of information in order to increase the validity of a study
These sources are likely to be stakeholders in a program - participants, other researchers, program staff, other community members, and so on.
Then we put all data in single framework & apply various statistical tools to find out the dynamic on the market.
During the analysis stage, feedback from the stakeholder groups would be compared to determine areas of agreement as well as areas of divergence


