
Key Insights
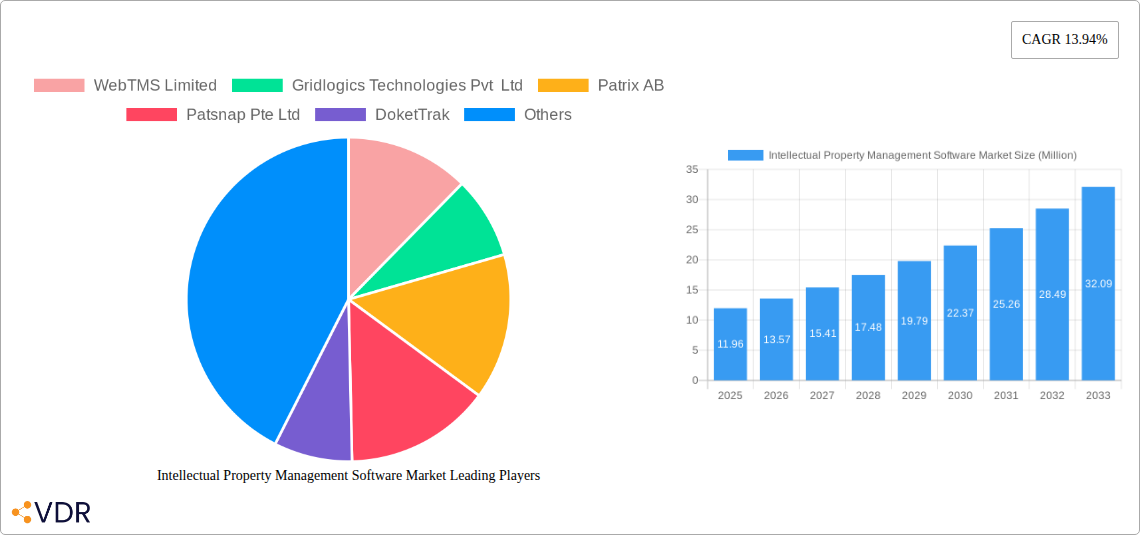
The Intellectual Property Management (IPM) Software market is experiencing robust growth, projected to reach \$11.96 million in 2025 and expand at a Compound Annual Growth Rate (CAGR) of 13.94% from 2025 to 2033. This expansion is driven by several factors. Increasing globalization necessitates robust IP protection strategies, leading businesses across diverse sectors—including BFSI, healthcare, automotive, IT & Telecom, and research institutions—to adopt IPM software for efficient management of patents, trademarks, copyrights, and designs. The shift towards cloud-based solutions enhances accessibility, scalability, and cost-effectiveness, further fueling market growth. Furthermore, the rising complexity of IP portfolios and the need for streamlined workflows are compelling organizations to invest in sophisticated IPM software to improve efficiency and reduce the risk of infringement. The market's segmentation reflects diverse user needs, with on-premise and cloud deployment options catering to varying IT infrastructures and preferences. Software and service solutions provide flexibility, while diverse IP types covered by the software ensure comprehensive portfolio management.
The competitive landscape is dynamic, with established players like Clarivate PLC and Anaqua Inc. alongside emerging companies like WebTMS Limited and Gridlogics Technologies Pvt Ltd vying for market share. Geographical expansion is evident across North America (particularly the United States), Europe (Germany and the UK being key markets), and the Asia-Pacific region (driven by growth in India and China). The continued rise in digitalization, coupled with increased awareness regarding IP protection and enforcement, is expected to sustain the market's upward trajectory. While challenges such as high initial investment costs and the need for skilled personnel exist, the overall market outlook remains positive, underpinned by the long-term strategic value of effective IP management.
Intellectual Property Management Software Market: A Comprehensive Report (2019-2033)
This comprehensive report provides an in-depth analysis of the Intellectual Property Management Software market, encompassing market dynamics, growth trends, regional dominance, product landscape, key players, and future outlook. The study period spans from 2019 to 2033, with 2025 as the base and estimated year. The report segments the market by deployment (On-premise, Cloud), solution (Software, Service), IP type (Patent, Trademark, Copyright, Design, Other), and end-user industry (BFSI, Healthcare, Automotive, IT & Telecom, Research Institutes, Others). The total market size is projected to reach xx Million by 2033.
Intellectual Property Management Software Market Market Dynamics & Structure
The Intellectual Property Management Software market is characterized by moderate concentration, with key players vying for market share. Technological innovation, particularly in AI and automation, is a primary growth driver. Stringent regulatory frameworks governing IP rights influence market dynamics, while cloud-based solutions present a strong competitive substitute to on-premise deployments. The end-user demographic skews towards larger enterprises in technology-intensive sectors, but adoption is growing among SMEs. M&A activity has been relatively consistent, with xx deals recorded between 2019 and 2024, indicating strategic consolidation within the industry.
- Market Concentration: Moderately concentrated, with top 5 players holding approximately xx% market share in 2024.
- Technological Innovation: AI-powered workflow automation and enhanced data analytics are key innovation drivers.
- Regulatory Landscape: Compliance with data privacy regulations (GDPR, CCPA) significantly impacts software development and deployment.
- Competitive Substitutes: Cloud-based solutions are increasingly replacing on-premise systems, driven by scalability and cost-effectiveness.
- End-User Demographics: Large enterprises in IT & Telecom and BFSI sectors dominate adoption, but SME penetration is growing.
- M&A Trends: Consistent M&A activity, with an average of xx deals per year between 2019 and 2024, driven by expansion and technological integration strategies.
Intellectual Property Management Software Market Growth Trends & Insights
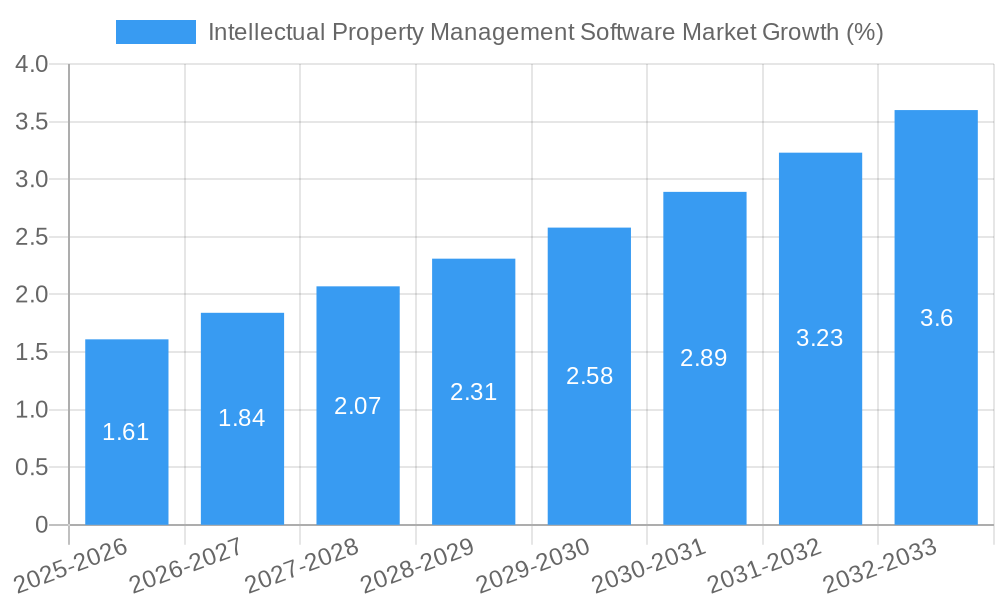
The Intellectual Property Management Software market has experienced robust growth over the historical period (2019-2024), with a CAGR of xx%. This growth is primarily attributed to increasing awareness of IP protection, rising R&D investments across various industries, and the increasing complexity of managing intellectual property portfolios. The market is expected to maintain a healthy growth trajectory throughout the forecast period (2025-2033), driven by the growing adoption of cloud-based solutions, technological advancements like AI-powered analytics, and a shift towards proactive IP management strategies. Market penetration among SMEs is also expected to increase significantly, further fueling market expansion. The global market size is projected to reach xx Million by 2033.
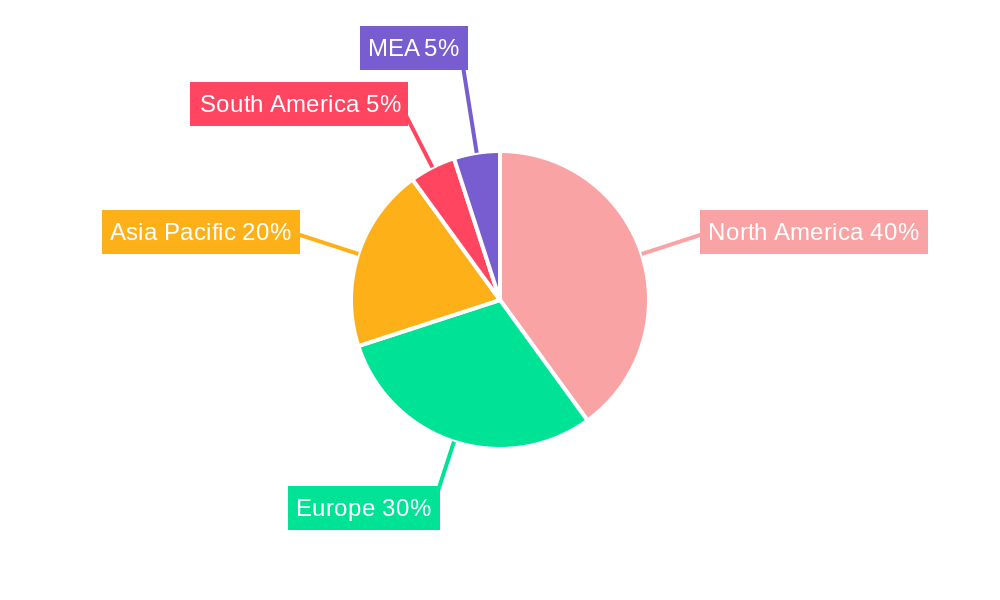
Dominant Regions, Countries, or Segments in Intellectual Property Management Software Market
North America currently holds the largest market share, driven by a high concentration of technology companies and strong IP protection laws. However, the Asia-Pacific region exhibits the highest growth potential, fueled by rapid economic development, increasing R&D spending, and rising awareness of IP rights.
- Leading Region: North America (xx% market share in 2024)
- Fastest-Growing Region: Asia-Pacific (projected CAGR of xx% during 2025-2033)
- Dominant Segment (Deployment): Cloud-based solutions are experiencing the fastest growth, driven by scalability, accessibility, and cost-efficiency.
- Dominant Segment (Solution): Software solutions dominate the market, but the demand for integrated services is increasing.
- Dominant Segment (IP Type): Patent Intellectual Property Management holds the largest market share due to its high complexity and value.
- Dominant Segment (End-user Industry): IT and Telecom, and BFSI sectors are major adopters.
Intellectual Property Management Software Market Product Landscape
The market offers a range of solutions, from basic IP management systems to sophisticated platforms integrating AI-powered analytics and workflow automation. Key features include portfolio management, IP lifecycle tracking, due diligence tools, and reporting functionalities. Recent innovations focus on enhancing user experience, integrating with other business systems, and leveraging AI for predictive analytics and risk assessment. Unique selling propositions include ease of use, scalability, integration capabilities, and data security.
Key Drivers, Barriers & Challenges in Intellectual Property Management Software Market
Key Drivers:
- Increasing IP litigation and the need for robust IP protection.
- Rising R&D investments across various industries.
- Growing awareness of the strategic value of IP assets.
- Technological advancements in AI and automation.
Challenges & Restraints:
- High initial investment costs for sophisticated solutions can deter small businesses.
- Data security concerns and compliance with privacy regulations.
- Complexity in integrating IP management systems with existing business processes.
- Intense competition among vendors. A market share of xx% is held by the top players, leaving limited space for new entrants.
Emerging Opportunities in Intellectual Property Management Software Market
- Expanding into emerging markets with growing IP awareness.
- Development of specialized solutions for specific industry sectors (e.g., Biotech, Pharmaceuticals).
- Integration of blockchain technology for enhanced IP security and transparency.
- Leveraging AI to automate routine tasks and improve decision-making.
Growth Accelerators in the Intellectual Property Management Software Market Industry
Strategic partnerships and collaborations between IP management software vendors and other technology providers are driving market growth. Continuous innovation in AI-powered analytics and automation capabilities is enhancing the efficiency and effectiveness of IP management. Expansion into new geographic markets and the development of customized solutions for specific industry needs are also significant growth accelerators.
Key Players Shaping the Intellectual Property Management Software Market Market
- WebTMS Limited
- Gridlogics Technologies Pvt Ltd
- Patrix AB
- Patsnap Pte Ltd
- DoketTrak
- Alt Legal Inc
- TM Cloud Inc
- AppColl Inc
- Clarivate PLC
- Anaqua Inc
Notable Milestones in Intellectual Property Management Software Market Sector
- January 2024: Anaqua expands its PATTSY WAVE platform to the European market, including localized versions in French and German.
- March 2024: ipQuants AG partners with Questel to integrate AI-powered workflow automation into patent procedures.
In-Depth Intellectual Property Management Software Market Market Outlook
The Intellectual Property Management Software market is poised for significant growth in the coming years, driven by ongoing technological advancements, increasing IP awareness, and the growing need for efficient IP management strategies. Strategic partnerships, expansion into untapped markets, and the development of innovative solutions will be key factors shaping the future landscape. The market offers substantial opportunities for both established players and new entrants to capitalize on the increasing demand for sophisticated and user-friendly IP management tools.
Intellectual Property Management Software Market Segmentation
-
1. Deployment
- 1.1. On-premise
- 1.2. Cloud
-
2. Solution
- 2.1. Software
- 2.2. Service
-
3. Type
- 3.1. Patent Intellectual Property Management
- 3.2. Trademark Intellectual Property Management
- 3.3. Copyright Intellectual Property Management
- 3.4. Design Intellectual Property Management
- 3.5. Other Types
-
4. End-user Industry
- 4.1. BFSI
- 4.2. Healthcare
- 4.3. Automotive
- 4.4. IT and Telecom
- 4.5. Research Institutes
- 4.6. Other End-user Industries
Intellectual Property Management Software Market Segmentation By Geography
- 1. North America
- 2. Europe
- 3. Asia Pacific
- 4. Latin America
- 5. Middle East and Africa
Intellectual Property Management Software Market REPORT HIGHLIGHTS
| Aspects | Details |
|---|---|
| Study Period | 2019-2033 |
| Base Year | 2024 |
| Estimated Year | 2025 |
| Forecast Period | 2025-2033 |
| Historical Period | 2019-2024 |
| Growth Rate | CAGR of 13.94% from 2019-2033 |
| Segmentation |
|
Table of Contents
- 1. Introduction
- 1.1. Research Scope
- 1.2. Market Segmentation
- 1.3. Research Methodology
- 1.4. Definitions and Assumptions
- 2. Executive Summary
- 2.1. Introduction
- 3. Market Dynamics
- 3.1. Introduction
- 3.2. Market Drivers
- 3.2.1 Growing Patent
- 3.2.2 Trademark
- 3.2.3 and Industrial Design Applications
- 3.3. Market Restrains
- 3.3.1. Lack of Awareness About Intellectual Property Outsourcing
- 3.4. Market Trends
- 3.4.1. Patent Intellectual Property Management Type Expected to Witness Significant Market Growth
- 4. Market Factor Analysis
- 4.1. Porters Five Forces
- 4.2. Supply/Value Chain
- 4.3. PESTEL analysis
- 4.4. Market Entropy
- 4.5. Patent/Trademark Analysis
- 5. Global Intellectual Property Management Software Market Analysis, Insights and Forecast, 2019-2031
- 5.1. Market Analysis, Insights and Forecast - by Deployment
- 5.1.1. On-premise
- 5.1.2. Cloud
- 5.2. Market Analysis, Insights and Forecast - by Solution
- 5.2.1. Software
- 5.2.2. Service
- 5.3. Market Analysis, Insights and Forecast - by Type
- 5.3.1. Patent Intellectual Property Management
- 5.3.2. Trademark Intellectual Property Management
- 5.3.3. Copyright Intellectual Property Management
- 5.3.4. Design Intellectual Property Management
- 5.3.5. Other Types
- 5.4. Market Analysis, Insights and Forecast - by End-user Industry
- 5.4.1. BFSI
- 5.4.2. Healthcare
- 5.4.3. Automotive
- 5.4.4. IT and Telecom
- 5.4.5. Research Institutes
- 5.4.6. Other End-user Industries
- 5.5. Market Analysis, Insights and Forecast - by Region
- 5.5.1. North America
- 5.5.2. Europe
- 5.5.3. Asia Pacific
- 5.5.4. Latin America
- 5.5.5. Middle East and Africa
- 5.1. Market Analysis, Insights and Forecast - by Deployment
- 6. North America Intellectual Property Management Software Market Analysis, Insights and Forecast, 2019-2031
- 6.1. Market Analysis, Insights and Forecast - by Deployment
- 6.1.1. On-premise
- 6.1.2. Cloud
- 6.2. Market Analysis, Insights and Forecast - by Solution
- 6.2.1. Software
- 6.2.2. Service
- 6.3. Market Analysis, Insights and Forecast - by Type
- 6.3.1. Patent Intellectual Property Management
- 6.3.2. Trademark Intellectual Property Management
- 6.3.3. Copyright Intellectual Property Management
- 6.3.4. Design Intellectual Property Management
- 6.3.5. Other Types
- 6.4. Market Analysis, Insights and Forecast - by End-user Industry
- 6.4.1. BFSI
- 6.4.2. Healthcare
- 6.4.3. Automotive
- 6.4.4. IT and Telecom
- 6.4.5. Research Institutes
- 6.4.6. Other End-user Industries
- 6.1. Market Analysis, Insights and Forecast - by Deployment
- 7. Europe Intellectual Property Management Software Market Analysis, Insights and Forecast, 2019-2031
- 7.1. Market Analysis, Insights and Forecast - by Deployment
- 7.1.1. On-premise
- 7.1.2. Cloud
- 7.2. Market Analysis, Insights and Forecast - by Solution
- 7.2.1. Software
- 7.2.2. Service
- 7.3. Market Analysis, Insights and Forecast - by Type
- 7.3.1. Patent Intellectual Property Management
- 7.3.2. Trademark Intellectual Property Management
- 7.3.3. Copyright Intellectual Property Management
- 7.3.4. Design Intellectual Property Management
- 7.3.5. Other Types
- 7.4. Market Analysis, Insights and Forecast - by End-user Industry
- 7.4.1. BFSI
- 7.4.2. Healthcare
- 7.4.3. Automotive
- 7.4.4. IT and Telecom
- 7.4.5. Research Institutes
- 7.4.6. Other End-user Industries
- 7.1. Market Analysis, Insights and Forecast - by Deployment
- 8. Asia Pacific Intellectual Property Management Software Market Analysis, Insights and Forecast, 2019-2031
- 8.1. Market Analysis, Insights and Forecast - by Deployment
- 8.1.1. On-premise
- 8.1.2. Cloud
- 8.2. Market Analysis, Insights and Forecast - by Solution
- 8.2.1. Software
- 8.2.2. Service
- 8.3. Market Analysis, Insights and Forecast - by Type
- 8.3.1. Patent Intellectual Property Management
- 8.3.2. Trademark Intellectual Property Management
- 8.3.3. Copyright Intellectual Property Management
- 8.3.4. Design Intellectual Property Management
- 8.3.5. Other Types
- 8.4. Market Analysis, Insights and Forecast - by End-user Industry
- 8.4.1. BFSI
- 8.4.2. Healthcare
- 8.4.3. Automotive
- 8.4.4. IT and Telecom
- 8.4.5. Research Institutes
- 8.4.6. Other End-user Industries
- 8.1. Market Analysis, Insights and Forecast - by Deployment
- 9. Latin America Intellectual Property Management Software Market Analysis, Insights and Forecast, 2019-2031
- 9.1. Market Analysis, Insights and Forecast - by Deployment
- 9.1.1. On-premise
- 9.1.2. Cloud
- 9.2. Market Analysis, Insights and Forecast - by Solution
- 9.2.1. Software
- 9.2.2. Service
- 9.3. Market Analysis, Insights and Forecast - by Type
- 9.3.1. Patent Intellectual Property Management
- 9.3.2. Trademark Intellectual Property Management
- 9.3.3. Copyright Intellectual Property Management
- 9.3.4. Design Intellectual Property Management
- 9.3.5. Other Types
- 9.4. Market Analysis, Insights and Forecast - by End-user Industry
- 9.4.1. BFSI
- 9.4.2. Healthcare
- 9.4.3. Automotive
- 9.4.4. IT and Telecom
- 9.4.5. Research Institutes
- 9.4.6. Other End-user Industries
- 9.1. Market Analysis, Insights and Forecast - by Deployment
- 10. Middle East and Africa Intellectual Property Management Software Market Analysis, Insights and Forecast, 2019-2031
- 10.1. Market Analysis, Insights and Forecast - by Deployment
- 10.1.1. On-premise
- 10.1.2. Cloud
- 10.2. Market Analysis, Insights and Forecast - by Solution
- 10.2.1. Software
- 10.2.2. Service
- 10.3. Market Analysis, Insights and Forecast - by Type
- 10.3.1. Patent Intellectual Property Management
- 10.3.2. Trademark Intellectual Property Management
- 10.3.3. Copyright Intellectual Property Management
- 10.3.4. Design Intellectual Property Management
- 10.3.5. Other Types
- 10.4. Market Analysis, Insights and Forecast - by End-user Industry
- 10.4.1. BFSI
- 10.4.2. Healthcare
- 10.4.3. Automotive
- 10.4.4. IT and Telecom
- 10.4.5. Research Institutes
- 10.4.6. Other End-user Industries
- 10.1. Market Analysis, Insights and Forecast - by Deployment
- 11. North America Intellectual Property Management Software Market Analysis, Insights and Forecast, 2019-2031
- 11.1. Market Analysis, Insights and Forecast - By Country/Sub-region
- 11.1.1 United States
- 11.1.2 Canada
- 11.1.3 Mexico
- 12. Europe Intellectual Property Management Software Market Analysis, Insights and Forecast, 2019-2031
- 12.1. Market Analysis, Insights and Forecast - By Country/Sub-region
- 12.1.1 Germany
- 12.1.2 United Kingdom
- 12.1.3 France
- 12.1.4 Spain
- 12.1.5 Italy
- 12.1.6 Spain
- 12.1.7 Belgium
- 12.1.8 Netherland
- 12.1.9 Nordics
- 12.1.10 Rest of Europe
- 13. Asia Pacific Intellectual Property Management Software Market Analysis, Insights and Forecast, 2019-2031
- 13.1. Market Analysis, Insights and Forecast - By Country/Sub-region
- 13.1.1 China
- 13.1.2 Japan
- 13.1.3 India
- 13.1.4 South Korea
- 13.1.5 Southeast Asia
- 13.1.6 Australia
- 13.1.7 Indonesia
- 13.1.8 Phillipes
- 13.1.9 Singapore
- 13.1.10 Thailandc
- 13.1.11 Rest of Asia Pacific
- 14. South America Intellectual Property Management Software Market Analysis, Insights and Forecast, 2019-2031
- 14.1. Market Analysis, Insights and Forecast - By Country/Sub-region
- 14.1.1 Brazil
- 14.1.2 Argentina
- 14.1.3 Peru
- 14.1.4 Chile
- 14.1.5 Colombia
- 14.1.6 Ecuador
- 14.1.7 Venezuela
- 14.1.8 Rest of South America
- 15. MEA Intellectual Property Management Software Market Analysis, Insights and Forecast, 2019-2031
- 15.1. Market Analysis, Insights and Forecast - By Country/Sub-region
- 15.1.1 United Arab Emirates
- 15.1.2 Saudi Arabia
- 15.1.3 South Africa
- 15.1.4 Rest of Middle East and Africa
- 16. Competitive Analysis
- 16.1. Global Market Share Analysis 2024
- 16.2. Company Profiles
- 16.2.1 WebTMS Limited
- 16.2.1.1. Overview
- 16.2.1.2. Products
- 16.2.1.3. SWOT Analysis
- 16.2.1.4. Recent Developments
- 16.2.1.5. Financials (Based on Availability)
- 16.2.2 Gridlogics Technologies Pvt Ltd
- 16.2.2.1. Overview
- 16.2.2.2. Products
- 16.2.2.3. SWOT Analysis
- 16.2.2.4. Recent Developments
- 16.2.2.5. Financials (Based on Availability)
- 16.2.3 Patrix AB
- 16.2.3.1. Overview
- 16.2.3.2. Products
- 16.2.3.3. SWOT Analysis
- 16.2.3.4. Recent Developments
- 16.2.3.5. Financials (Based on Availability)
- 16.2.4 Patsnap Pte Ltd
- 16.2.4.1. Overview
- 16.2.4.2. Products
- 16.2.4.3. SWOT Analysis
- 16.2.4.4. Recent Developments
- 16.2.4.5. Financials (Based on Availability)
- 16.2.5 DoketTrak
- 16.2.5.1. Overview
- 16.2.5.2. Products
- 16.2.5.3. SWOT Analysis
- 16.2.5.4. Recent Developments
- 16.2.5.5. Financials (Based on Availability)
- 16.2.6 Alt Legal Inc
- 16.2.6.1. Overview
- 16.2.6.2. Products
- 16.2.6.3. SWOT Analysis
- 16.2.6.4. Recent Developments
- 16.2.6.5. Financials (Based on Availability)
- 16.2.7 TM Cloud Inc
- 16.2.7.1. Overview
- 16.2.7.2. Products
- 16.2.7.3. SWOT Analysis
- 16.2.7.4. Recent Developments
- 16.2.7.5. Financials (Based on Availability)
- 16.2.8 AppColl Inc
- 16.2.8.1. Overview
- 16.2.8.2. Products
- 16.2.8.3. SWOT Analysis
- 16.2.8.4. Recent Developments
- 16.2.8.5. Financials (Based on Availability)
- 16.2.9 Clarivate PLC
- 16.2.9.1. Overview
- 16.2.9.2. Products
- 16.2.9.3. SWOT Analysis
- 16.2.9.4. Recent Developments
- 16.2.9.5. Financials (Based on Availability)
- 16.2.10 Anaqua Inc
- 16.2.10.1. Overview
- 16.2.10.2. Products
- 16.2.10.3. SWOT Analysis
- 16.2.10.4. Recent Developments
- 16.2.10.5. Financials (Based on Availability)
- 16.2.1 WebTMS Limited
List of Figures
- Figure 1: Global Intellectual Property Management Software Market Revenue Breakdown (Million, %) by Region 2024 & 2032
- Figure 2: North America Intellectual Property Management Software Market Revenue (Million), by Country 2024 & 2032
- Figure 3: North America Intellectual Property Management Software Market Revenue Share (%), by Country 2024 & 2032
- Figure 4: Europe Intellectual Property Management Software Market Revenue (Million), by Country 2024 & 2032
- Figure 5: Europe Intellectual Property Management Software Market Revenue Share (%), by Country 2024 & 2032
- Figure 6: Asia Pacific Intellectual Property Management Software Market Revenue (Million), by Country 2024 & 2032
- Figure 7: Asia Pacific Intellectual Property Management Software Market Revenue Share (%), by Country 2024 & 2032
- Figure 8: South America Intellectual Property Management Software Market Revenue (Million), by Country 2024 & 2032
- Figure 9: South America Intellectual Property Management Software Market Revenue Share (%), by Country 2024 & 2032
- Figure 10: MEA Intellectual Property Management Software Market Revenue (Million), by Country 2024 & 2032
- Figure 11: MEA Intellectual Property Management Software Market Revenue Share (%), by Country 2024 & 2032
- Figure 12: North America Intellectual Property Management Software Market Revenue (Million), by Deployment 2024 & 2032
- Figure 13: North America Intellectual Property Management Software Market Revenue Share (%), by Deployment 2024 & 2032
- Figure 14: North America Intellectual Property Management Software Market Revenue (Million), by Solution 2024 & 2032
- Figure 15: North America Intellectual Property Management Software Market Revenue Share (%), by Solution 2024 & 2032
- Figure 16: North America Intellectual Property Management Software Market Revenue (Million), by Type 2024 & 2032
- Figure 17: North America Intellectual Property Management Software Market Revenue Share (%), by Type 2024 & 2032
- Figure 18: North America Intellectual Property Management Software Market Revenue (Million), by End-user Industry 2024 & 2032
- Figure 19: North America Intellectual Property Management Software Market Revenue Share (%), by End-user Industry 2024 & 2032
- Figure 20: North America Intellectual Property Management Software Market Revenue (Million), by Country 2024 & 2032
- Figure 21: North America Intellectual Property Management Software Market Revenue Share (%), by Country 2024 & 2032
- Figure 22: Europe Intellectual Property Management Software Market Revenue (Million), by Deployment 2024 & 2032
- Figure 23: Europe Intellectual Property Management Software Market Revenue Share (%), by Deployment 2024 & 2032
- Figure 24: Europe Intellectual Property Management Software Market Revenue (Million), by Solution 2024 & 2032
- Figure 25: Europe Intellectual Property Management Software Market Revenue Share (%), by Solution 2024 & 2032
- Figure 26: Europe Intellectual Property Management Software Market Revenue (Million), by Type 2024 & 2032
- Figure 27: Europe Intellectual Property Management Software Market Revenue Share (%), by Type 2024 & 2032
- Figure 28: Europe Intellectual Property Management Software Market Revenue (Million), by End-user Industry 2024 & 2032
- Figure 29: Europe Intellectual Property Management Software Market Revenue Share (%), by End-user Industry 2024 & 2032
- Figure 30: Europe Intellectual Property Management Software Market Revenue (Million), by Country 2024 & 2032
- Figure 31: Europe Intellectual Property Management Software Market Revenue Share (%), by Country 2024 & 2032
- Figure 32: Asia Pacific Intellectual Property Management Software Market Revenue (Million), by Deployment 2024 & 2032
- Figure 33: Asia Pacific Intellectual Property Management Software Market Revenue Share (%), by Deployment 2024 & 2032
- Figure 34: Asia Pacific Intellectual Property Management Software Market Revenue (Million), by Solution 2024 & 2032
- Figure 35: Asia Pacific Intellectual Property Management Software Market Revenue Share (%), by Solution 2024 & 2032
- Figure 36: Asia Pacific Intellectual Property Management Software Market Revenue (Million), by Type 2024 & 2032
- Figure 37: Asia Pacific Intellectual Property Management Software Market Revenue Share (%), by Type 2024 & 2032
- Figure 38: Asia Pacific Intellectual Property Management Software Market Revenue (Million), by End-user Industry 2024 & 2032
- Figure 39: Asia Pacific Intellectual Property Management Software Market Revenue Share (%), by End-user Industry 2024 & 2032
- Figure 40: Asia Pacific Intellectual Property Management Software Market Revenue (Million), by Country 2024 & 2032
- Figure 41: Asia Pacific Intellectual Property Management Software Market Revenue Share (%), by Country 2024 & 2032
- Figure 42: Latin America Intellectual Property Management Software Market Revenue (Million), by Deployment 2024 & 2032
- Figure 43: Latin America Intellectual Property Management Software Market Revenue Share (%), by Deployment 2024 & 2032
- Figure 44: Latin America Intellectual Property Management Software Market Revenue (Million), by Solution 2024 & 2032
- Figure 45: Latin America Intellectual Property Management Software Market Revenue Share (%), by Solution 2024 & 2032
- Figure 46: Latin America Intellectual Property Management Software Market Revenue (Million), by Type 2024 & 2032
- Figure 47: Latin America Intellectual Property Management Software Market Revenue Share (%), by Type 2024 & 2032
- Figure 48: Latin America Intellectual Property Management Software Market Revenue (Million), by End-user Industry 2024 & 2032
- Figure 49: Latin America Intellectual Property Management Software Market Revenue Share (%), by End-user Industry 2024 & 2032
- Figure 50: Latin America Intellectual Property Management Software Market Revenue (Million), by Country 2024 & 2032
- Figure 51: Latin America Intellectual Property Management Software Market Revenue Share (%), by Country 2024 & 2032
- Figure 52: Middle East and Africa Intellectual Property Management Software Market Revenue (Million), by Deployment 2024 & 2032
- Figure 53: Middle East and Africa Intellectual Property Management Software Market Revenue Share (%), by Deployment 2024 & 2032
- Figure 54: Middle East and Africa Intellectual Property Management Software Market Revenue (Million), by Solution 2024 & 2032
- Figure 55: Middle East and Africa Intellectual Property Management Software Market Revenue Share (%), by Solution 2024 & 2032
- Figure 56: Middle East and Africa Intellectual Property Management Software Market Revenue (Million), by Type 2024 & 2032
- Figure 57: Middle East and Africa Intellectual Property Management Software Market Revenue Share (%), by Type 2024 & 2032
- Figure 58: Middle East and Africa Intellectual Property Management Software Market Revenue (Million), by End-user Industry 2024 & 2032
- Figure 59: Middle East and Africa Intellectual Property Management Software Market Revenue Share (%), by End-user Industry 2024 & 2032
- Figure 60: Middle East and Africa Intellectual Property Management Software Market Revenue (Million), by Country 2024 & 2032
- Figure 61: Middle East and Africa Intellectual Property Management Software Market Revenue Share (%), by Country 2024 & 2032
List of Tables
- Table 1: Global Intellectual Property Management Software Market Revenue Million Forecast, by Region 2019 & 2032
- Table 2: Global Intellectual Property Management Software Market Revenue Million Forecast, by Deployment 2019 & 2032
- Table 3: Global Intellectual Property Management Software Market Revenue Million Forecast, by Solution 2019 & 2032
- Table 4: Global Intellectual Property Management Software Market Revenue Million Forecast, by Type 2019 & 2032
- Table 5: Global Intellectual Property Management Software Market Revenue Million Forecast, by End-user Industry 2019 & 2032
- Table 6: Global Intellectual Property Management Software Market Revenue Million Forecast, by Region 2019 & 2032
- Table 7: Global Intellectual Property Management Software Market Revenue Million Forecast, by Country 2019 & 2032
- Table 8: United States Intellectual Property Management Software Market Revenue (Million) Forecast, by Application 2019 & 2032
- Table 9: Canada Intellectual Property Management Software Market Revenue (Million) Forecast, by Application 2019 & 2032
- Table 10: Mexico Intellectual Property Management Software Market Revenue (Million) Forecast, by Application 2019 & 2032
- Table 11: Global Intellectual Property Management Software Market Revenue Million Forecast, by Country 2019 & 2032
- Table 12: Germany Intellectual Property Management Software Market Revenue (Million) Forecast, by Application 2019 & 2032
- Table 13: United Kingdom Intellectual Property Management Software Market Revenue (Million) Forecast, by Application 2019 & 2032
- Table 14: France Intellectual Property Management Software Market Revenue (Million) Forecast, by Application 2019 & 2032
- Table 15: Spain Intellectual Property Management Software Market Revenue (Million) Forecast, by Application 2019 & 2032
- Table 16: Italy Intellectual Property Management Software Market Revenue (Million) Forecast, by Application 2019 & 2032
- Table 17: Spain Intellectual Property Management Software Market Revenue (Million) Forecast, by Application 2019 & 2032
- Table 18: Belgium Intellectual Property Management Software Market Revenue (Million) Forecast, by Application 2019 & 2032
- Table 19: Netherland Intellectual Property Management Software Market Revenue (Million) Forecast, by Application 2019 & 2032
- Table 20: Nordics Intellectual Property Management Software Market Revenue (Million) Forecast, by Application 2019 & 2032
- Table 21: Rest of Europe Intellectual Property Management Software Market Revenue (Million) Forecast, by Application 2019 & 2032
- Table 22: Global Intellectual Property Management Software Market Revenue Million Forecast, by Country 2019 & 2032
- Table 23: China Intellectual Property Management Software Market Revenue (Million) Forecast, by Application 2019 & 2032
- Table 24: Japan Intellectual Property Management Software Market Revenue (Million) Forecast, by Application 2019 & 2032
- Table 25: India Intellectual Property Management Software Market Revenue (Million) Forecast, by Application 2019 & 2032
- Table 26: South Korea Intellectual Property Management Software Market Revenue (Million) Forecast, by Application 2019 & 2032
- Table 27: Southeast Asia Intellectual Property Management Software Market Revenue (Million) Forecast, by Application 2019 & 2032
- Table 28: Australia Intellectual Property Management Software Market Revenue (Million) Forecast, by Application 2019 & 2032
- Table 29: Indonesia Intellectual Property Management Software Market Revenue (Million) Forecast, by Application 2019 & 2032
- Table 30: Phillipes Intellectual Property Management Software Market Revenue (Million) Forecast, by Application 2019 & 2032
- Table 31: Singapore Intellectual Property Management Software Market Revenue (Million) Forecast, by Application 2019 & 2032
- Table 32: Thailandc Intellectual Property Management Software Market Revenue (Million) Forecast, by Application 2019 & 2032
- Table 33: Rest of Asia Pacific Intellectual Property Management Software Market Revenue (Million) Forecast, by Application 2019 & 2032
- Table 34: Global Intellectual Property Management Software Market Revenue Million Forecast, by Country 2019 & 2032
- Table 35: Brazil Intellectual Property Management Software Market Revenue (Million) Forecast, by Application 2019 & 2032
- Table 36: Argentina Intellectual Property Management Software Market Revenue (Million) Forecast, by Application 2019 & 2032
- Table 37: Peru Intellectual Property Management Software Market Revenue (Million) Forecast, by Application 2019 & 2032
- Table 38: Chile Intellectual Property Management Software Market Revenue (Million) Forecast, by Application 2019 & 2032
- Table 39: Colombia Intellectual Property Management Software Market Revenue (Million) Forecast, by Application 2019 & 2032
- Table 40: Ecuador Intellectual Property Management Software Market Revenue (Million) Forecast, by Application 2019 & 2032
- Table 41: Venezuela Intellectual Property Management Software Market Revenue (Million) Forecast, by Application 2019 & 2032
- Table 42: Rest of South America Intellectual Property Management Software Market Revenue (Million) Forecast, by Application 2019 & 2032
- Table 43: Global Intellectual Property Management Software Market Revenue Million Forecast, by Country 2019 & 2032
- Table 44: United Arab Emirates Intellectual Property Management Software Market Revenue (Million) Forecast, by Application 2019 & 2032
- Table 45: Saudi Arabia Intellectual Property Management Software Market Revenue (Million) Forecast, by Application 2019 & 2032
- Table 46: South Africa Intellectual Property Management Software Market Revenue (Million) Forecast, by Application 2019 & 2032
- Table 47: Rest of Middle East and Africa Intellectual Property Management Software Market Revenue (Million) Forecast, by Application 2019 & 2032
- Table 48: Global Intellectual Property Management Software Market Revenue Million Forecast, by Deployment 2019 & 2032
- Table 49: Global Intellectual Property Management Software Market Revenue Million Forecast, by Solution 2019 & 2032
- Table 50: Global Intellectual Property Management Software Market Revenue Million Forecast, by Type 2019 & 2032
- Table 51: Global Intellectual Property Management Software Market Revenue Million Forecast, by End-user Industry 2019 & 2032
- Table 52: Global Intellectual Property Management Software Market Revenue Million Forecast, by Country 2019 & 2032
- Table 53: Global Intellectual Property Management Software Market Revenue Million Forecast, by Deployment 2019 & 2032
- Table 54: Global Intellectual Property Management Software Market Revenue Million Forecast, by Solution 2019 & 2032
- Table 55: Global Intellectual Property Management Software Market Revenue Million Forecast, by Type 2019 & 2032
- Table 56: Global Intellectual Property Management Software Market Revenue Million Forecast, by End-user Industry 2019 & 2032
- Table 57: Global Intellectual Property Management Software Market Revenue Million Forecast, by Country 2019 & 2032
- Table 58: Global Intellectual Property Management Software Market Revenue Million Forecast, by Deployment 2019 & 2032
- Table 59: Global Intellectual Property Management Software Market Revenue Million Forecast, by Solution 2019 & 2032
- Table 60: Global Intellectual Property Management Software Market Revenue Million Forecast, by Type 2019 & 2032
- Table 61: Global Intellectual Property Management Software Market Revenue Million Forecast, by End-user Industry 2019 & 2032
- Table 62: Global Intellectual Property Management Software Market Revenue Million Forecast, by Country 2019 & 2032
- Table 63: Global Intellectual Property Management Software Market Revenue Million Forecast, by Deployment 2019 & 2032
- Table 64: Global Intellectual Property Management Software Market Revenue Million Forecast, by Solution 2019 & 2032
- Table 65: Global Intellectual Property Management Software Market Revenue Million Forecast, by Type 2019 & 2032
- Table 66: Global Intellectual Property Management Software Market Revenue Million Forecast, by End-user Industry 2019 & 2032
- Table 67: Global Intellectual Property Management Software Market Revenue Million Forecast, by Country 2019 & 2032
- Table 68: Global Intellectual Property Management Software Market Revenue Million Forecast, by Deployment 2019 & 2032
- Table 69: Global Intellectual Property Management Software Market Revenue Million Forecast, by Solution 2019 & 2032
- Table 70: Global Intellectual Property Management Software Market Revenue Million Forecast, by Type 2019 & 2032
- Table 71: Global Intellectual Property Management Software Market Revenue Million Forecast, by End-user Industry 2019 & 2032
- Table 72: Global Intellectual Property Management Software Market Revenue Million Forecast, by Country 2019 & 2032
Frequently Asked Questions
1. What is the projected Compound Annual Growth Rate (CAGR) of the Intellectual Property Management Software Market?
The projected CAGR is approximately 13.94%.
2. Which companies are prominent players in the Intellectual Property Management Software Market?
Key companies in the market include WebTMS Limited, Gridlogics Technologies Pvt Ltd, Patrix AB, Patsnap Pte Ltd, DoketTrak, Alt Legal Inc, TM Cloud Inc, AppColl Inc, Clarivate PLC, Anaqua Inc.
3. What are the main segments of the Intellectual Property Management Software Market?
The market segments include Deployment, Solution, Type, End-user Industry.
4. Can you provide details about the market size?
The market size is estimated to be USD 11.96 Million as of 2022.
5. What are some drivers contributing to market growth?
Growing Patent. Trademark. and Industrial Design Applications.
6. What are the notable trends driving market growth?
Patent Intellectual Property Management Type Expected to Witness Significant Market Growth.
7. Are there any restraints impacting market growth?
Lack of Awareness About Intellectual Property Outsourcing.
8. Can you provide examples of recent developments in the market?
March 2024: ipQuants AG, a significant intellectual property (IP) management innovator, announced a non-exclusive strategic partnership with Questel, a global player in IP management solutions and IP services. This partnership marked a significant milestone in ipQuants AG’s mission to redefine efficiency, accuracy, and strategic insight into the patent procedure through advanced workflow automation and artificial intelligence (AI).
9. What pricing options are available for accessing the report?
Pricing options include single-user, multi-user, and enterprise licenses priced at USD 4750, USD 5250, and USD 8750 respectively.
10. Is the market size provided in terms of value or volume?
The market size is provided in terms of value, measured in Million.
11. Are there any specific market keywords associated with the report?
Yes, the market keyword associated with the report is "Intellectual Property Management Software Market," which aids in identifying and referencing the specific market segment covered.
12. How do I determine which pricing option suits my needs best?
The pricing options vary based on user requirements and access needs. Individual users may opt for single-user licenses, while businesses requiring broader access may choose multi-user or enterprise licenses for cost-effective access to the report.
13. Are there any additional resources or data provided in the Intellectual Property Management Software Market report?
While the report offers comprehensive insights, it's advisable to review the specific contents or supplementary materials provided to ascertain if additional resources or data are available.
14. How can I stay updated on further developments or reports in the Intellectual Property Management Software Market?
To stay informed about further developments, trends, and reports in the Intellectual Property Management Software Market, consider subscribing to industry newsletters, following relevant companies and organizations, or regularly checking reputable industry news sources and publications.
Methodology
Step 1 - Identification of Relevant Samples Size from Population Database


Step 2 - Approaches for Defining Global Market Size (Value, Volume* & Price*)

Note*: In applicable scenarios
Step 3 - Data Sources
Primary Research
- Web Analytics
- Survey Reports
- Research Institute
- Latest Research Reports
- Opinion Leaders
Secondary Research
- Annual Reports
- White Paper
- Latest Press Release
- Industry Association
- Paid Database
- Investor Presentations

Step 4 - Data Triangulation
Involves using different sources of information in order to increase the validity of a study
These sources are likely to be stakeholders in a program - participants, other researchers, program staff, other community members, and so on.
Then we put all data in single framework & apply various statistical tools to find out the dynamic on the market.
During the analysis stage, feedback from the stakeholder groups would be compared to determine areas of agreement as well as areas of divergence


