
Key Insights
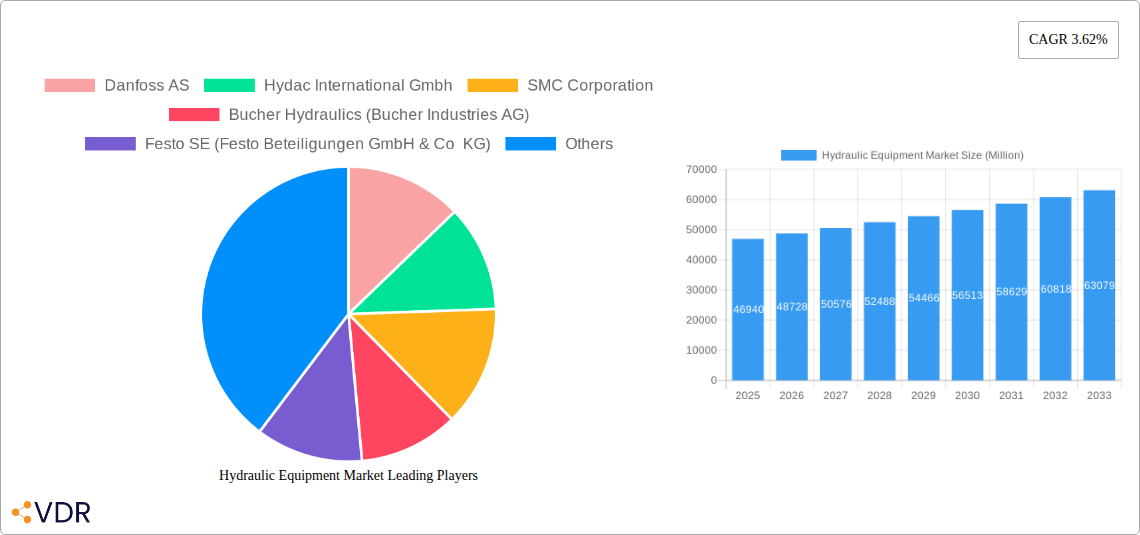
The global hydraulic equipment market, valued at $46.94 billion in 2025, is projected to experience steady growth, driven by a compound annual growth rate (CAGR) of 3.62% from 2025 to 2033. This expansion is fueled by several key factors. The increasing demand for automation and advanced technologies across diverse end-user industries, including construction, agriculture, and automotive, is a significant driver. Furthermore, the rising adoption of hydraulic systems in energy-efficient machinery and equipment contributes to market growth. Specific growth sectors include the construction industry, boosted by infrastructure development globally, and the automotive sector, driven by the rising production of heavy-duty vehicles. Technological advancements like the integration of smart sensors and digital controls, resulting in improved efficiency and reduced maintenance costs, also contribute significantly to market expansion. While competitive pricing pressures from emerging economies could present some challenges, the overall market outlook remains positive.
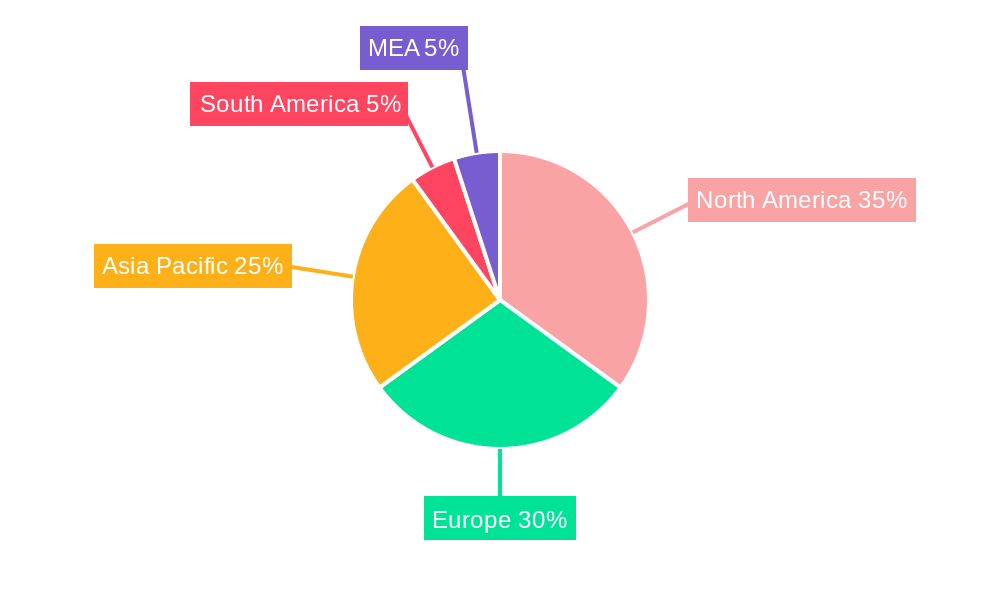
The market segmentation reveals significant opportunities across various components. Pumps, valves, and cylinders are currently the largest segments, while substantial growth potential exists in advanced components like filters and accumulators and sophisticated transmission systems. Geographically, North America and Europe currently hold significant market shares, driven by high levels of industrial automation and established manufacturing bases. However, rapidly developing economies in Asia-Pacific, particularly China and India, are expected to show significant growth in the coming years, owing to increasing industrialization and infrastructure development. The market will see continuous innovation in materials and designs to improve efficiency and durability, leading to further market penetration across diverse sectors. Competition amongst established players like Danfoss, Bosch Rexroth, and Parker-Hannifin, alongside the emergence of innovative companies, will shape the market's competitive landscape during the forecast period.
Hydraulic Equipment Market: A Comprehensive Market Report (2019-2033)
This in-depth report provides a comprehensive analysis of the Hydraulic Equipment Market, encompassing market dynamics, growth trends, regional performance, product landscape, key players, and future outlook. The report covers the period from 2019 to 2033, with a focus on the forecast period of 2025-2033 and a base year of 2025. The market is segmented by component (pumps, valves, cylinders, motors, filters & accumulators, transmission, other product types) and end-user industry (construction, agriculture, material handling, aerospace & defense, machine tools, oil & gas, hydraulic press, plastics, automotive, other). The total market size is projected to reach xx Million units by 2033.
Hydraulic Equipment Market Dynamics & Structure
The Hydraulic Equipment Market is characterized by a moderately consolidated structure, with several major players holding significant market share. Technological innovation, driven by the increasing demand for higher efficiency and precision, is a key driver. Stringent regulatory frameworks regarding safety and environmental impact influence product design and manufacturing. The market experiences competition from alternative technologies, such as electric and pneumatic systems, though hydraulics maintain a strong position due to its high power density and reliability. End-user demographics, particularly in developing economies experiencing rapid infrastructure development, fuel significant growth. The market also witnesses considerable M&A activity, driven by the pursuit of expansion, technological capabilities, and diversification.
- Market Concentration: Moderately Consolidated (Top 5 players hold approximately xx% market share in 2025)
- Technological Innovation: Focus on energy efficiency, precision control, and smart hydraulics.
- Regulatory Framework: Compliance with safety and environmental standards (e.g., REACH, RoHS).
- Competitive Substitutes: Electric and pneumatic systems, posing a moderate threat.
- M&A Activity: Significant increase in mergers and acquisitions over the past 5 years, with approximately xx deals recorded in 2024.
Hydraulic Equipment Market Growth Trends & Insights
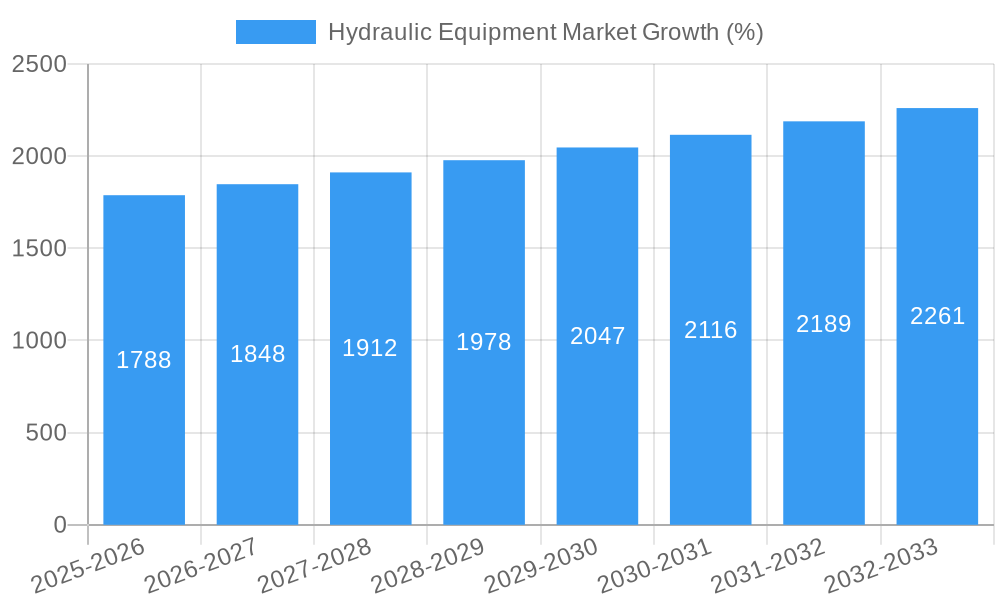
The Hydraulic Equipment Market is experiencing steady growth, driven by the expanding application across various sectors. The market size witnessed a Compound Annual Growth Rate (CAGR) of xx% during the historical period (2019-2024). This growth is projected to continue, albeit at a slightly moderated pace, with a CAGR of xx% expected during the forecast period (2025-2033), reaching a projected xx Million units by 2033. Technological advancements, such as the adoption of advanced control systems and the integration of IoT capabilities are driving adoption rates. Consumer behavior shifts towards sustainable and efficient solutions also influences market demand. Increased automation in manufacturing and construction are key factors contributing to the overall growth of the hydraulic equipment market. Market penetration in developing regions is expected to increase significantly during the forecast period.
Dominant Regions, Countries, or Segments in Hydraulic Equipment Market
The North American region currently holds a dominant position in the Hydraulic Equipment Market, accounting for approximately xx% of the global market share in 2025. This dominance is primarily attributed to the robust construction and automotive sectors. However, the Asia-Pacific region is projected to witness the fastest growth rate during the forecast period, fueled by industrialization and infrastructure development in countries like China and India. Within the segments, Pumps and Valves dominate the component market in terms of value and volume, owing to their critical role in most hydraulic systems. The Construction end-user industry holds the largest share in the market due to its extensive use of hydraulic equipment.
- Key Drivers in North America: Strong construction sector, automotive manufacturing, and established industrial base.
- Key Drivers in Asia-Pacific: Rapid industrialization, infrastructure development, and increasing government spending.
- Dominant Component Segment: Pumps and Valves (xx% market share in 2025)
- Dominant End-User Industry: Construction (xx% market share in 2025)
Hydraulic Equipment Market Product Landscape
The hydraulic equipment market features a wide range of products, encompassing pumps, valves, cylinders, motors, and related components. Recent innovations focus on improved efficiency, enhanced precision, and the integration of advanced control systems. Manufacturers are incorporating IoT capabilities to enable remote monitoring and predictive maintenance, thereby improving operational efficiency and reducing downtime. The emphasis is also on developing compact and lightweight designs to meet evolving application requirements, particularly in mobile equipment. Unique selling propositions center around improved energy efficiency, enhanced reliability, and advanced control features.
Key Drivers, Barriers & Challenges in Hydraulic Equipment Market
Key Drivers:
- Growing industrial automation and construction activities.
- Increasing demand for energy-efficient and precise hydraulic systems.
- Adoption of advanced control systems and IoT technologies.
Key Challenges:
- Fluctuations in raw material prices impacting manufacturing costs.
- Stringent environmental regulations affecting product design and manufacturing processes.
- Intense competition among established players and new entrants. This leads to price pressures and requires continuous innovation to maintain market share.
Emerging Opportunities in Hydraulic Equipment Market
- Expanding applications in renewable energy sectors (e.g., wind turbines, hydroelectric power).
- Growing demand for compact and lightweight hydraulic systems in mobile applications.
- Development of sophisticated control systems for enhanced precision and efficiency.
Growth Accelerators in the Hydraulic Equipment Market Industry
Strategic partnerships and collaborations between manufacturers and end-users are creating synergistic growth opportunities. The development of advanced materials and manufacturing processes are contributing to enhanced product performance and reduced costs. Expansion into new and emerging markets, particularly in developing economies, is driving significant growth potential. Technological breakthroughs, such as the integration of artificial intelligence and machine learning, are enhancing the capabilities of hydraulic systems.
Key Players Shaping the Hydraulic Equipment Market Market
- Danfoss AS
- Hydac International GmbH
- SMC Corporation
- Bucher Hydraulics (Bucher Industries AG)
- Festo SE (Festo Beteiligungen GmbH & Co KG)
- Parker-Hannifin Corporation
- Norgren Limited (IMI PLC)
- HAWE
- Bosch Rexroth AG (ROBERT BOSCH GMBH)
- Linde Hydraulics GmbH & Co
Notable Milestones in Hydraulic Equipment Market Sector
- December 2023: Stellar Industries launched the 14530 hydraulic service crane, featuring a lighter design and increased lifting capacity.
- April 2023: Uzer Makina acquired Uzun Hidrolik, expanding its product portfolio and R&D capabilities.
- October 2022: Enerpac introduced the SBL600 gantry, offering improved lifting capacity and ease of transportation.
- August 2022: HAWE unveiled the HICON mini hydraulic power pack, designed for recreational boats.
In-Depth Hydraulic Equipment Market Market Outlook
The Hydraulic Equipment Market is poised for continued growth, driven by technological advancements, increasing automation across various industries, and infrastructure development globally. Strategic opportunities exist for companies focusing on developing energy-efficient, smart, and sustainable hydraulic solutions. Expansion into emerging markets and strategic partnerships will be key to capturing significant market share in the coming years. The market's future will be shaped by innovation, sustainability, and the ability to meet the evolving needs of a diverse range of industries.
Hydraulic Equipment Market Segmentation
-
1. Type
- 1.1. Pumps
- 1.2. Valves
- 1.3. Cylinders
- 1.4. Motors
- 1.5. Filters and Accumulators
- 1.6. Transmission
- 1.7. Other Product Types
-
2. End-user Industry
- 2.1. Construction
- 2.2. Agriculture
- 2.3. Material Handling
- 2.4. Aerospace and Defense
- 2.5. Machine Tools
- 2.6. Oil and Gas
- 2.7. Hydraulic Press
- 2.8. Plastics
- 2.9. Automotive
- 2.10. Other End-user Industries
Hydraulic Equipment Market Segmentation By Geography
- 1. North America
- 2. Europe
- 3. Asia
- 4. Australia and New Zealand
- 5. Latin America
- 6. Middle East and Africa
Hydraulic Equipment Market REPORT HIGHLIGHTS
| Aspects | Details |
|---|---|
| Study Period | 2019-2033 |
| Base Year | 2024 |
| Estimated Year | 2025 |
| Forecast Period | 2025-2033 |
| Historical Period | 2019-2024 |
| Growth Rate | CAGR of 3.62% from 2019-2033 |
| Segmentation |
|
Table of Contents
- 1. Introduction
- 1.1. Research Scope
- 1.2. Market Segmentation
- 1.3. Research Methodology
- 1.4. Definitions and Assumptions
- 2. Executive Summary
- 2.1. Introduction
- 3. Market Dynamics
- 3.1. Introduction
- 3.2. Market Drivers
- 3.2.1. Increasing Demand for Material Handling Equipment; Increasing Demand From the Construction Industry via Government Initiatives and Investments
- 3.3. Market Restrains
- 3.3.1. High Maintenance Cost Over the Equipment's Lifespan
- 3.4. Market Trends
- 3.4.1. Consutruction Segment to Witness Significant Growth
- 4. Market Factor Analysis
- 4.1. Porters Five Forces
- 4.2. Supply/Value Chain
- 4.3. PESTEL analysis
- 4.4. Market Entropy
- 4.5. Patent/Trademark Analysis
- 5. Global Hydraulic Equipment Market Analysis, Insights and Forecast, 2019-2031
- 5.1. Market Analysis, Insights and Forecast - by Type
- 5.1.1. Pumps
- 5.1.2. Valves
- 5.1.3. Cylinders
- 5.1.4. Motors
- 5.1.5. Filters and Accumulators
- 5.1.6. Transmission
- 5.1.7. Other Product Types
- 5.2. Market Analysis, Insights and Forecast - by End-user Industry
- 5.2.1. Construction
- 5.2.2. Agriculture
- 5.2.3. Material Handling
- 5.2.4. Aerospace and Defense
- 5.2.5. Machine Tools
- 5.2.6. Oil and Gas
- 5.2.7. Hydraulic Press
- 5.2.8. Plastics
- 5.2.9. Automotive
- 5.2.10. Other End-user Industries
- 5.3. Market Analysis, Insights and Forecast - by Region
- 5.3.1. North America
- 5.3.2. Europe
- 5.3.3. Asia
- 5.3.4. Australia and New Zealand
- 5.3.5. Latin America
- 5.3.6. Middle East and Africa
- 5.1. Market Analysis, Insights and Forecast - by Type
- 6. North America Hydraulic Equipment Market Analysis, Insights and Forecast, 2019-2031
- 6.1. Market Analysis, Insights and Forecast - by Type
- 6.1.1. Pumps
- 6.1.2. Valves
- 6.1.3. Cylinders
- 6.1.4. Motors
- 6.1.5. Filters and Accumulators
- 6.1.6. Transmission
- 6.1.7. Other Product Types
- 6.2. Market Analysis, Insights and Forecast - by End-user Industry
- 6.2.1. Construction
- 6.2.2. Agriculture
- 6.2.3. Material Handling
- 6.2.4. Aerospace and Defense
- 6.2.5. Machine Tools
- 6.2.6. Oil and Gas
- 6.2.7. Hydraulic Press
- 6.2.8. Plastics
- 6.2.9. Automotive
- 6.2.10. Other End-user Industries
- 6.1. Market Analysis, Insights and Forecast - by Type
- 7. Europe Hydraulic Equipment Market Analysis, Insights and Forecast, 2019-2031
- 7.1. Market Analysis, Insights and Forecast - by Type
- 7.1.1. Pumps
- 7.1.2. Valves
- 7.1.3. Cylinders
- 7.1.4. Motors
- 7.1.5. Filters and Accumulators
- 7.1.6. Transmission
- 7.1.7. Other Product Types
- 7.2. Market Analysis, Insights and Forecast - by End-user Industry
- 7.2.1. Construction
- 7.2.2. Agriculture
- 7.2.3. Material Handling
- 7.2.4. Aerospace and Defense
- 7.2.5. Machine Tools
- 7.2.6. Oil and Gas
- 7.2.7. Hydraulic Press
- 7.2.8. Plastics
- 7.2.9. Automotive
- 7.2.10. Other End-user Industries
- 7.1. Market Analysis, Insights and Forecast - by Type
- 8. Asia Hydraulic Equipment Market Analysis, Insights and Forecast, 2019-2031
- 8.1. Market Analysis, Insights and Forecast - by Type
- 8.1.1. Pumps
- 8.1.2. Valves
- 8.1.3. Cylinders
- 8.1.4. Motors
- 8.1.5. Filters and Accumulators
- 8.1.6. Transmission
- 8.1.7. Other Product Types
- 8.2. Market Analysis, Insights and Forecast - by End-user Industry
- 8.2.1. Construction
- 8.2.2. Agriculture
- 8.2.3. Material Handling
- 8.2.4. Aerospace and Defense
- 8.2.5. Machine Tools
- 8.2.6. Oil and Gas
- 8.2.7. Hydraulic Press
- 8.2.8. Plastics
- 8.2.9. Automotive
- 8.2.10. Other End-user Industries
- 8.1. Market Analysis, Insights and Forecast - by Type
- 9. Australia and New Zealand Hydraulic Equipment Market Analysis, Insights and Forecast, 2019-2031
- 9.1. Market Analysis, Insights and Forecast - by Type
- 9.1.1. Pumps
- 9.1.2. Valves
- 9.1.3. Cylinders
- 9.1.4. Motors
- 9.1.5. Filters and Accumulators
- 9.1.6. Transmission
- 9.1.7. Other Product Types
- 9.2. Market Analysis, Insights and Forecast - by End-user Industry
- 9.2.1. Construction
- 9.2.2. Agriculture
- 9.2.3. Material Handling
- 9.2.4. Aerospace and Defense
- 9.2.5. Machine Tools
- 9.2.6. Oil and Gas
- 9.2.7. Hydraulic Press
- 9.2.8. Plastics
- 9.2.9. Automotive
- 9.2.10. Other End-user Industries
- 9.1. Market Analysis, Insights and Forecast - by Type
- 10. Latin America Hydraulic Equipment Market Analysis, Insights and Forecast, 2019-2031
- 10.1. Market Analysis, Insights and Forecast - by Type
- 10.1.1. Pumps
- 10.1.2. Valves
- 10.1.3. Cylinders
- 10.1.4. Motors
- 10.1.5. Filters and Accumulators
- 10.1.6. Transmission
- 10.1.7. Other Product Types
- 10.2. Market Analysis, Insights and Forecast - by End-user Industry
- 10.2.1. Construction
- 10.2.2. Agriculture
- 10.2.3. Material Handling
- 10.2.4. Aerospace and Defense
- 10.2.5. Machine Tools
- 10.2.6. Oil and Gas
- 10.2.7. Hydraulic Press
- 10.2.8. Plastics
- 10.2.9. Automotive
- 10.2.10. Other End-user Industries
- 10.1. Market Analysis, Insights and Forecast - by Type
- 11. Middle East and Africa Hydraulic Equipment Market Analysis, Insights and Forecast, 2019-2031
- 11.1. Market Analysis, Insights and Forecast - by Type
- 11.1.1. Pumps
- 11.1.2. Valves
- 11.1.3. Cylinders
- 11.1.4. Motors
- 11.1.5. Filters and Accumulators
- 11.1.6. Transmission
- 11.1.7. Other Product Types
- 11.2. Market Analysis, Insights and Forecast - by End-user Industry
- 11.2.1. Construction
- 11.2.2. Agriculture
- 11.2.3. Material Handling
- 11.2.4. Aerospace and Defense
- 11.2.5. Machine Tools
- 11.2.6. Oil and Gas
- 11.2.7. Hydraulic Press
- 11.2.8. Plastics
- 11.2.9. Automotive
- 11.2.10. Other End-user Industries
- 11.1. Market Analysis, Insights and Forecast - by Type
- 12. North America Hydraulic Equipment Market Analysis, Insights and Forecast, 2019-2031
- 12.1. Market Analysis, Insights and Forecast - By Country/Sub-region
- 12.1.1 United States
- 12.1.2 Canada
- 12.1.3 Mexico
- 13. Europe Hydraulic Equipment Market Analysis, Insights and Forecast, 2019-2031
- 13.1. Market Analysis, Insights and Forecast - By Country/Sub-region
- 13.1.1 Germany
- 13.1.2 United Kingdom
- 13.1.3 France
- 13.1.4 Spain
- 13.1.5 Italy
- 13.1.6 Spain
- 13.1.7 Belgium
- 13.1.8 Netherland
- 13.1.9 Nordics
- 13.1.10 Rest of Europe
- 14. Asia Pacific Hydraulic Equipment Market Analysis, Insights and Forecast, 2019-2031
- 14.1. Market Analysis, Insights and Forecast - By Country/Sub-region
- 14.1.1 China
- 14.1.2 Japan
- 14.1.3 India
- 14.1.4 South Korea
- 14.1.5 Southeast Asia
- 14.1.6 Australia
- 14.1.7 Indonesia
- 14.1.8 Phillipes
- 14.1.9 Singapore
- 14.1.10 Thailandc
- 14.1.11 Rest of Asia Pacific
- 15. South America Hydraulic Equipment Market Analysis, Insights and Forecast, 2019-2031
- 15.1. Market Analysis, Insights and Forecast - By Country/Sub-region
- 15.1.1 Brazil
- 15.1.2 Argentina
- 15.1.3 Peru
- 15.1.4 Chile
- 15.1.5 Colombia
- 15.1.6 Ecuador
- 15.1.7 Venezuela
- 15.1.8 Rest of South America
- 16. North America Hydraulic Equipment Market Analysis, Insights and Forecast, 2019-2031
- 16.1. Market Analysis, Insights and Forecast - By Country/Sub-region
- 16.1.1 United States
- 16.1.2 Canada
- 16.1.3 Mexico
- 17. MEA Hydraulic Equipment Market Analysis, Insights and Forecast, 2019-2031
- 17.1. Market Analysis, Insights and Forecast - By Country/Sub-region
- 17.1.1 United Arab Emirates
- 17.1.2 Saudi Arabia
- 17.1.3 South Africa
- 17.1.4 Rest of Middle East and Africa
- 18. Competitive Analysis
- 18.1. Global Market Share Analysis 2024
- 18.2. Company Profiles
- 18.2.1 Danfoss AS
- 18.2.1.1. Overview
- 18.2.1.2. Products
- 18.2.1.3. SWOT Analysis
- 18.2.1.4. Recent Developments
- 18.2.1.5. Financials (Based on Availability)
- 18.2.2 Hydac International Gmbh
- 18.2.2.1. Overview
- 18.2.2.2. Products
- 18.2.2.3. SWOT Analysis
- 18.2.2.4. Recent Developments
- 18.2.2.5. Financials (Based on Availability)
- 18.2.3 SMC Corporation
- 18.2.3.1. Overview
- 18.2.3.2. Products
- 18.2.3.3. SWOT Analysis
- 18.2.3.4. Recent Developments
- 18.2.3.5. Financials (Based on Availability)
- 18.2.4 Bucher Hydraulics (Bucher Industries AG)
- 18.2.4.1. Overview
- 18.2.4.2. Products
- 18.2.4.3. SWOT Analysis
- 18.2.4.4. Recent Developments
- 18.2.4.5. Financials (Based on Availability)
- 18.2.5 Festo SE (Festo Beteiligungen GmbH & Co KG)
- 18.2.5.1. Overview
- 18.2.5.2. Products
- 18.2.5.3. SWOT Analysis
- 18.2.5.4. Recent Developments
- 18.2.5.5. Financials (Based on Availability)
- 18.2.6 Parker-Hannifin Corporation
- 18.2.6.1. Overview
- 18.2.6.2. Products
- 18.2.6.3. SWOT Analysis
- 18.2.6.4. Recent Developments
- 18.2.6.5. Financials (Based on Availability)
- 18.2.7 Norgren Limited (IMI PLC)
- 18.2.7.1. Overview
- 18.2.7.2. Products
- 18.2.7.3. SWOT Analysis
- 18.2.7.4. Recent Developments
- 18.2.7.5. Financials (Based on Availability)
- 18.2.8 HAWE
- 18.2.8.1. Overview
- 18.2.8.2. Products
- 18.2.8.3. SWOT Analysis
- 18.2.8.4. Recent Developments
- 18.2.8.5. Financials (Based on Availability)
- 18.2.9 Bosch Rexroth AG (ROBERT BOSCH GMBH)
- 18.2.9.1. Overview
- 18.2.9.2. Products
- 18.2.9.3. SWOT Analysis
- 18.2.9.4. Recent Developments
- 18.2.9.5. Financials (Based on Availability)
- 18.2.10 Linde Hydraulics GmbH & Co
- 18.2.10.1. Overview
- 18.2.10.2. Products
- 18.2.10.3. SWOT Analysis
- 18.2.10.4. Recent Developments
- 18.2.10.5. Financials (Based on Availability)
- 18.2.1 Danfoss AS
List of Figures
- Figure 1: Global Hydraulic Equipment Market Revenue Breakdown (Million, %) by Region 2024 & 2032
- Figure 2: Global Hydraulic Equipment Market Volume Breakdown (K Unit, %) by Region 2024 & 2032
- Figure 3: North America Hydraulic Equipment Market Revenue (Million), by Country 2024 & 2032
- Figure 4: North America Hydraulic Equipment Market Volume (K Unit), by Country 2024 & 2032
- Figure 5: North America Hydraulic Equipment Market Revenue Share (%), by Country 2024 & 2032
- Figure 6: North America Hydraulic Equipment Market Volume Share (%), by Country 2024 & 2032
- Figure 7: Europe Hydraulic Equipment Market Revenue (Million), by Country 2024 & 2032
- Figure 8: Europe Hydraulic Equipment Market Volume (K Unit), by Country 2024 & 2032
- Figure 9: Europe Hydraulic Equipment Market Revenue Share (%), by Country 2024 & 2032
- Figure 10: Europe Hydraulic Equipment Market Volume Share (%), by Country 2024 & 2032
- Figure 11: Asia Pacific Hydraulic Equipment Market Revenue (Million), by Country 2024 & 2032
- Figure 12: Asia Pacific Hydraulic Equipment Market Volume (K Unit), by Country 2024 & 2032
- Figure 13: Asia Pacific Hydraulic Equipment Market Revenue Share (%), by Country 2024 & 2032
- Figure 14: Asia Pacific Hydraulic Equipment Market Volume Share (%), by Country 2024 & 2032
- Figure 15: South America Hydraulic Equipment Market Revenue (Million), by Country 2024 & 2032
- Figure 16: South America Hydraulic Equipment Market Volume (K Unit), by Country 2024 & 2032
- Figure 17: South America Hydraulic Equipment Market Revenue Share (%), by Country 2024 & 2032
- Figure 18: South America Hydraulic Equipment Market Volume Share (%), by Country 2024 & 2032
- Figure 19: North America Hydraulic Equipment Market Revenue (Million), by Country 2024 & 2032
- Figure 20: North America Hydraulic Equipment Market Volume (K Unit), by Country 2024 & 2032
- Figure 21: North America Hydraulic Equipment Market Revenue Share (%), by Country 2024 & 2032
- Figure 22: North America Hydraulic Equipment Market Volume Share (%), by Country 2024 & 2032
- Figure 23: MEA Hydraulic Equipment Market Revenue (Million), by Country 2024 & 2032
- Figure 24: MEA Hydraulic Equipment Market Volume (K Unit), by Country 2024 & 2032
- Figure 25: MEA Hydraulic Equipment Market Revenue Share (%), by Country 2024 & 2032
- Figure 26: MEA Hydraulic Equipment Market Volume Share (%), by Country 2024 & 2032
- Figure 27: North America Hydraulic Equipment Market Revenue (Million), by Type 2024 & 2032
- Figure 28: North America Hydraulic Equipment Market Volume (K Unit), by Type 2024 & 2032
- Figure 29: North America Hydraulic Equipment Market Revenue Share (%), by Type 2024 & 2032
- Figure 30: North America Hydraulic Equipment Market Volume Share (%), by Type 2024 & 2032
- Figure 31: North America Hydraulic Equipment Market Revenue (Million), by End-user Industry 2024 & 2032
- Figure 32: North America Hydraulic Equipment Market Volume (K Unit), by End-user Industry 2024 & 2032
- Figure 33: North America Hydraulic Equipment Market Revenue Share (%), by End-user Industry 2024 & 2032
- Figure 34: North America Hydraulic Equipment Market Volume Share (%), by End-user Industry 2024 & 2032
- Figure 35: North America Hydraulic Equipment Market Revenue (Million), by Country 2024 & 2032
- Figure 36: North America Hydraulic Equipment Market Volume (K Unit), by Country 2024 & 2032
- Figure 37: North America Hydraulic Equipment Market Revenue Share (%), by Country 2024 & 2032
- Figure 38: North America Hydraulic Equipment Market Volume Share (%), by Country 2024 & 2032
- Figure 39: Europe Hydraulic Equipment Market Revenue (Million), by Type 2024 & 2032
- Figure 40: Europe Hydraulic Equipment Market Volume (K Unit), by Type 2024 & 2032
- Figure 41: Europe Hydraulic Equipment Market Revenue Share (%), by Type 2024 & 2032
- Figure 42: Europe Hydraulic Equipment Market Volume Share (%), by Type 2024 & 2032
- Figure 43: Europe Hydraulic Equipment Market Revenue (Million), by End-user Industry 2024 & 2032
- Figure 44: Europe Hydraulic Equipment Market Volume (K Unit), by End-user Industry 2024 & 2032
- Figure 45: Europe Hydraulic Equipment Market Revenue Share (%), by End-user Industry 2024 & 2032
- Figure 46: Europe Hydraulic Equipment Market Volume Share (%), by End-user Industry 2024 & 2032
- Figure 47: Europe Hydraulic Equipment Market Revenue (Million), by Country 2024 & 2032
- Figure 48: Europe Hydraulic Equipment Market Volume (K Unit), by Country 2024 & 2032
- Figure 49: Europe Hydraulic Equipment Market Revenue Share (%), by Country 2024 & 2032
- Figure 50: Europe Hydraulic Equipment Market Volume Share (%), by Country 2024 & 2032
- Figure 51: Asia Hydraulic Equipment Market Revenue (Million), by Type 2024 & 2032
- Figure 52: Asia Hydraulic Equipment Market Volume (K Unit), by Type 2024 & 2032
- Figure 53: Asia Hydraulic Equipment Market Revenue Share (%), by Type 2024 & 2032
- Figure 54: Asia Hydraulic Equipment Market Volume Share (%), by Type 2024 & 2032
- Figure 55: Asia Hydraulic Equipment Market Revenue (Million), by End-user Industry 2024 & 2032
- Figure 56: Asia Hydraulic Equipment Market Volume (K Unit), by End-user Industry 2024 & 2032
- Figure 57: Asia Hydraulic Equipment Market Revenue Share (%), by End-user Industry 2024 & 2032
- Figure 58: Asia Hydraulic Equipment Market Volume Share (%), by End-user Industry 2024 & 2032
- Figure 59: Asia Hydraulic Equipment Market Revenue (Million), by Country 2024 & 2032
- Figure 60: Asia Hydraulic Equipment Market Volume (K Unit), by Country 2024 & 2032
- Figure 61: Asia Hydraulic Equipment Market Revenue Share (%), by Country 2024 & 2032
- Figure 62: Asia Hydraulic Equipment Market Volume Share (%), by Country 2024 & 2032
- Figure 63: Australia and New Zealand Hydraulic Equipment Market Revenue (Million), by Type 2024 & 2032
- Figure 64: Australia and New Zealand Hydraulic Equipment Market Volume (K Unit), by Type 2024 & 2032
- Figure 65: Australia and New Zealand Hydraulic Equipment Market Revenue Share (%), by Type 2024 & 2032
- Figure 66: Australia and New Zealand Hydraulic Equipment Market Volume Share (%), by Type 2024 & 2032
- Figure 67: Australia and New Zealand Hydraulic Equipment Market Revenue (Million), by End-user Industry 2024 & 2032
- Figure 68: Australia and New Zealand Hydraulic Equipment Market Volume (K Unit), by End-user Industry 2024 & 2032
- Figure 69: Australia and New Zealand Hydraulic Equipment Market Revenue Share (%), by End-user Industry 2024 & 2032
- Figure 70: Australia and New Zealand Hydraulic Equipment Market Volume Share (%), by End-user Industry 2024 & 2032
- Figure 71: Australia and New Zealand Hydraulic Equipment Market Revenue (Million), by Country 2024 & 2032
- Figure 72: Australia and New Zealand Hydraulic Equipment Market Volume (K Unit), by Country 2024 & 2032
- Figure 73: Australia and New Zealand Hydraulic Equipment Market Revenue Share (%), by Country 2024 & 2032
- Figure 74: Australia and New Zealand Hydraulic Equipment Market Volume Share (%), by Country 2024 & 2032
- Figure 75: Latin America Hydraulic Equipment Market Revenue (Million), by Type 2024 & 2032
- Figure 76: Latin America Hydraulic Equipment Market Volume (K Unit), by Type 2024 & 2032
- Figure 77: Latin America Hydraulic Equipment Market Revenue Share (%), by Type 2024 & 2032
- Figure 78: Latin America Hydraulic Equipment Market Volume Share (%), by Type 2024 & 2032
- Figure 79: Latin America Hydraulic Equipment Market Revenue (Million), by End-user Industry 2024 & 2032
- Figure 80: Latin America Hydraulic Equipment Market Volume (K Unit), by End-user Industry 2024 & 2032
- Figure 81: Latin America Hydraulic Equipment Market Revenue Share (%), by End-user Industry 2024 & 2032
- Figure 82: Latin America Hydraulic Equipment Market Volume Share (%), by End-user Industry 2024 & 2032
- Figure 83: Latin America Hydraulic Equipment Market Revenue (Million), by Country 2024 & 2032
- Figure 84: Latin America Hydraulic Equipment Market Volume (K Unit), by Country 2024 & 2032
- Figure 85: Latin America Hydraulic Equipment Market Revenue Share (%), by Country 2024 & 2032
- Figure 86: Latin America Hydraulic Equipment Market Volume Share (%), by Country 2024 & 2032
- Figure 87: Middle East and Africa Hydraulic Equipment Market Revenue (Million), by Type 2024 & 2032
- Figure 88: Middle East and Africa Hydraulic Equipment Market Volume (K Unit), by Type 2024 & 2032
- Figure 89: Middle East and Africa Hydraulic Equipment Market Revenue Share (%), by Type 2024 & 2032
- Figure 90: Middle East and Africa Hydraulic Equipment Market Volume Share (%), by Type 2024 & 2032
- Figure 91: Middle East and Africa Hydraulic Equipment Market Revenue (Million), by End-user Industry 2024 & 2032
- Figure 92: Middle East and Africa Hydraulic Equipment Market Volume (K Unit), by End-user Industry 2024 & 2032
- Figure 93: Middle East and Africa Hydraulic Equipment Market Revenue Share (%), by End-user Industry 2024 & 2032
- Figure 94: Middle East and Africa Hydraulic Equipment Market Volume Share (%), by End-user Industry 2024 & 2032
- Figure 95: Middle East and Africa Hydraulic Equipment Market Revenue (Million), by Country 2024 & 2032
- Figure 96: Middle East and Africa Hydraulic Equipment Market Volume (K Unit), by Country 2024 & 2032
- Figure 97: Middle East and Africa Hydraulic Equipment Market Revenue Share (%), by Country 2024 & 2032
- Figure 98: Middle East and Africa Hydraulic Equipment Market Volume Share (%), by Country 2024 & 2032
List of Tables
- Table 1: Global Hydraulic Equipment Market Revenue Million Forecast, by Region 2019 & 2032
- Table 2: Global Hydraulic Equipment Market Volume K Unit Forecast, by Region 2019 & 2032
- Table 3: Global Hydraulic Equipment Market Revenue Million Forecast, by Type 2019 & 2032
- Table 4: Global Hydraulic Equipment Market Volume K Unit Forecast, by Type 2019 & 2032
- Table 5: Global Hydraulic Equipment Market Revenue Million Forecast, by End-user Industry 2019 & 2032
- Table 6: Global Hydraulic Equipment Market Volume K Unit Forecast, by End-user Industry 2019 & 2032
- Table 7: Global Hydraulic Equipment Market Revenue Million Forecast, by Region 2019 & 2032
- Table 8: Global Hydraulic Equipment Market Volume K Unit Forecast, by Region 2019 & 2032
- Table 9: Global Hydraulic Equipment Market Revenue Million Forecast, by Country 2019 & 2032
- Table 10: Global Hydraulic Equipment Market Volume K Unit Forecast, by Country 2019 & 2032
- Table 11: United States Hydraulic Equipment Market Revenue (Million) Forecast, by Application 2019 & 2032
- Table 12: United States Hydraulic Equipment Market Volume (K Unit) Forecast, by Application 2019 & 2032
- Table 13: Canada Hydraulic Equipment Market Revenue (Million) Forecast, by Application 2019 & 2032
- Table 14: Canada Hydraulic Equipment Market Volume (K Unit) Forecast, by Application 2019 & 2032
- Table 15: Mexico Hydraulic Equipment Market Revenue (Million) Forecast, by Application 2019 & 2032
- Table 16: Mexico Hydraulic Equipment Market Volume (K Unit) Forecast, by Application 2019 & 2032
- Table 17: Global Hydraulic Equipment Market Revenue Million Forecast, by Country 2019 & 2032
- Table 18: Global Hydraulic Equipment Market Volume K Unit Forecast, by Country 2019 & 2032
- Table 19: Germany Hydraulic Equipment Market Revenue (Million) Forecast, by Application 2019 & 2032
- Table 20: Germany Hydraulic Equipment Market Volume (K Unit) Forecast, by Application 2019 & 2032
- Table 21: United Kingdom Hydraulic Equipment Market Revenue (Million) Forecast, by Application 2019 & 2032
- Table 22: United Kingdom Hydraulic Equipment Market Volume (K Unit) Forecast, by Application 2019 & 2032
- Table 23: France Hydraulic Equipment Market Revenue (Million) Forecast, by Application 2019 & 2032
- Table 24: France Hydraulic Equipment Market Volume (K Unit) Forecast, by Application 2019 & 2032
- Table 25: Spain Hydraulic Equipment Market Revenue (Million) Forecast, by Application 2019 & 2032
- Table 26: Spain Hydraulic Equipment Market Volume (K Unit) Forecast, by Application 2019 & 2032
- Table 27: Italy Hydraulic Equipment Market Revenue (Million) Forecast, by Application 2019 & 2032
- Table 28: Italy Hydraulic Equipment Market Volume (K Unit) Forecast, by Application 2019 & 2032
- Table 29: Spain Hydraulic Equipment Market Revenue (Million) Forecast, by Application 2019 & 2032
- Table 30: Spain Hydraulic Equipment Market Volume (K Unit) Forecast, by Application 2019 & 2032
- Table 31: Belgium Hydraulic Equipment Market Revenue (Million) Forecast, by Application 2019 & 2032
- Table 32: Belgium Hydraulic Equipment Market Volume (K Unit) Forecast, by Application 2019 & 2032
- Table 33: Netherland Hydraulic Equipment Market Revenue (Million) Forecast, by Application 2019 & 2032
- Table 34: Netherland Hydraulic Equipment Market Volume (K Unit) Forecast, by Application 2019 & 2032
- Table 35: Nordics Hydraulic Equipment Market Revenue (Million) Forecast, by Application 2019 & 2032
- Table 36: Nordics Hydraulic Equipment Market Volume (K Unit) Forecast, by Application 2019 & 2032
- Table 37: Rest of Europe Hydraulic Equipment Market Revenue (Million) Forecast, by Application 2019 & 2032
- Table 38: Rest of Europe Hydraulic Equipment Market Volume (K Unit) Forecast, by Application 2019 & 2032
- Table 39: Global Hydraulic Equipment Market Revenue Million Forecast, by Country 2019 & 2032
- Table 40: Global Hydraulic Equipment Market Volume K Unit Forecast, by Country 2019 & 2032
- Table 41: China Hydraulic Equipment Market Revenue (Million) Forecast, by Application 2019 & 2032
- Table 42: China Hydraulic Equipment Market Volume (K Unit) Forecast, by Application 2019 & 2032
- Table 43: Japan Hydraulic Equipment Market Revenue (Million) Forecast, by Application 2019 & 2032
- Table 44: Japan Hydraulic Equipment Market Volume (K Unit) Forecast, by Application 2019 & 2032
- Table 45: India Hydraulic Equipment Market Revenue (Million) Forecast, by Application 2019 & 2032
- Table 46: India Hydraulic Equipment Market Volume (K Unit) Forecast, by Application 2019 & 2032
- Table 47: South Korea Hydraulic Equipment Market Revenue (Million) Forecast, by Application 2019 & 2032
- Table 48: South Korea Hydraulic Equipment Market Volume (K Unit) Forecast, by Application 2019 & 2032
- Table 49: Southeast Asia Hydraulic Equipment Market Revenue (Million) Forecast, by Application 2019 & 2032
- Table 50: Southeast Asia Hydraulic Equipment Market Volume (K Unit) Forecast, by Application 2019 & 2032
- Table 51: Australia Hydraulic Equipment Market Revenue (Million) Forecast, by Application 2019 & 2032
- Table 52: Australia Hydraulic Equipment Market Volume (K Unit) Forecast, by Application 2019 & 2032
- Table 53: Indonesia Hydraulic Equipment Market Revenue (Million) Forecast, by Application 2019 & 2032
- Table 54: Indonesia Hydraulic Equipment Market Volume (K Unit) Forecast, by Application 2019 & 2032
- Table 55: Phillipes Hydraulic Equipment Market Revenue (Million) Forecast, by Application 2019 & 2032
- Table 56: Phillipes Hydraulic Equipment Market Volume (K Unit) Forecast, by Application 2019 & 2032
- Table 57: Singapore Hydraulic Equipment Market Revenue (Million) Forecast, by Application 2019 & 2032
- Table 58: Singapore Hydraulic Equipment Market Volume (K Unit) Forecast, by Application 2019 & 2032
- Table 59: Thailandc Hydraulic Equipment Market Revenue (Million) Forecast, by Application 2019 & 2032
- Table 60: Thailandc Hydraulic Equipment Market Volume (K Unit) Forecast, by Application 2019 & 2032
- Table 61: Rest of Asia Pacific Hydraulic Equipment Market Revenue (Million) Forecast, by Application 2019 & 2032
- Table 62: Rest of Asia Pacific Hydraulic Equipment Market Volume (K Unit) Forecast, by Application 2019 & 2032
- Table 63: Global Hydraulic Equipment Market Revenue Million Forecast, by Country 2019 & 2032
- Table 64: Global Hydraulic Equipment Market Volume K Unit Forecast, by Country 2019 & 2032
- Table 65: Brazil Hydraulic Equipment Market Revenue (Million) Forecast, by Application 2019 & 2032
- Table 66: Brazil Hydraulic Equipment Market Volume (K Unit) Forecast, by Application 2019 & 2032
- Table 67: Argentina Hydraulic Equipment Market Revenue (Million) Forecast, by Application 2019 & 2032
- Table 68: Argentina Hydraulic Equipment Market Volume (K Unit) Forecast, by Application 2019 & 2032
- Table 69: Peru Hydraulic Equipment Market Revenue (Million) Forecast, by Application 2019 & 2032
- Table 70: Peru Hydraulic Equipment Market Volume (K Unit) Forecast, by Application 2019 & 2032
- Table 71: Chile Hydraulic Equipment Market Revenue (Million) Forecast, by Application 2019 & 2032
- Table 72: Chile Hydraulic Equipment Market Volume (K Unit) Forecast, by Application 2019 & 2032
- Table 73: Colombia Hydraulic Equipment Market Revenue (Million) Forecast, by Application 2019 & 2032
- Table 74: Colombia Hydraulic Equipment Market Volume (K Unit) Forecast, by Application 2019 & 2032
- Table 75: Ecuador Hydraulic Equipment Market Revenue (Million) Forecast, by Application 2019 & 2032
- Table 76: Ecuador Hydraulic Equipment Market Volume (K Unit) Forecast, by Application 2019 & 2032
- Table 77: Venezuela Hydraulic Equipment Market Revenue (Million) Forecast, by Application 2019 & 2032
- Table 78: Venezuela Hydraulic Equipment Market Volume (K Unit) Forecast, by Application 2019 & 2032
- Table 79: Rest of South America Hydraulic Equipment Market Revenue (Million) Forecast, by Application 2019 & 2032
- Table 80: Rest of South America Hydraulic Equipment Market Volume (K Unit) Forecast, by Application 2019 & 2032
- Table 81: Global Hydraulic Equipment Market Revenue Million Forecast, by Country 2019 & 2032
- Table 82: Global Hydraulic Equipment Market Volume K Unit Forecast, by Country 2019 & 2032
- Table 83: United States Hydraulic Equipment Market Revenue (Million) Forecast, by Application 2019 & 2032
- Table 84: United States Hydraulic Equipment Market Volume (K Unit) Forecast, by Application 2019 & 2032
- Table 85: Canada Hydraulic Equipment Market Revenue (Million) Forecast, by Application 2019 & 2032
- Table 86: Canada Hydraulic Equipment Market Volume (K Unit) Forecast, by Application 2019 & 2032
- Table 87: Mexico Hydraulic Equipment Market Revenue (Million) Forecast, by Application 2019 & 2032
- Table 88: Mexico Hydraulic Equipment Market Volume (K Unit) Forecast, by Application 2019 & 2032
- Table 89: Global Hydraulic Equipment Market Revenue Million Forecast, by Country 2019 & 2032
- Table 90: Global Hydraulic Equipment Market Volume K Unit Forecast, by Country 2019 & 2032
- Table 91: United Arab Emirates Hydraulic Equipment Market Revenue (Million) Forecast, by Application 2019 & 2032
- Table 92: United Arab Emirates Hydraulic Equipment Market Volume (K Unit) Forecast, by Application 2019 & 2032
- Table 93: Saudi Arabia Hydraulic Equipment Market Revenue (Million) Forecast, by Application 2019 & 2032
- Table 94: Saudi Arabia Hydraulic Equipment Market Volume (K Unit) Forecast, by Application 2019 & 2032
- Table 95: South Africa Hydraulic Equipment Market Revenue (Million) Forecast, by Application 2019 & 2032
- Table 96: South Africa Hydraulic Equipment Market Volume (K Unit) Forecast, by Application 2019 & 2032
- Table 97: Rest of Middle East and Africa Hydraulic Equipment Market Revenue (Million) Forecast, by Application 2019 & 2032
- Table 98: Rest of Middle East and Africa Hydraulic Equipment Market Volume (K Unit) Forecast, by Application 2019 & 2032
- Table 99: Global Hydraulic Equipment Market Revenue Million Forecast, by Type 2019 & 2032
- Table 100: Global Hydraulic Equipment Market Volume K Unit Forecast, by Type 2019 & 2032
- Table 101: Global Hydraulic Equipment Market Revenue Million Forecast, by End-user Industry 2019 & 2032
- Table 102: Global Hydraulic Equipment Market Volume K Unit Forecast, by End-user Industry 2019 & 2032
- Table 103: Global Hydraulic Equipment Market Revenue Million Forecast, by Country 2019 & 2032
- Table 104: Global Hydraulic Equipment Market Volume K Unit Forecast, by Country 2019 & 2032
- Table 105: Global Hydraulic Equipment Market Revenue Million Forecast, by Type 2019 & 2032
- Table 106: Global Hydraulic Equipment Market Volume K Unit Forecast, by Type 2019 & 2032
- Table 107: Global Hydraulic Equipment Market Revenue Million Forecast, by End-user Industry 2019 & 2032
- Table 108: Global Hydraulic Equipment Market Volume K Unit Forecast, by End-user Industry 2019 & 2032
- Table 109: Global Hydraulic Equipment Market Revenue Million Forecast, by Country 2019 & 2032
- Table 110: Global Hydraulic Equipment Market Volume K Unit Forecast, by Country 2019 & 2032
- Table 111: Global Hydraulic Equipment Market Revenue Million Forecast, by Type 2019 & 2032
- Table 112: Global Hydraulic Equipment Market Volume K Unit Forecast, by Type 2019 & 2032
- Table 113: Global Hydraulic Equipment Market Revenue Million Forecast, by End-user Industry 2019 & 2032
- Table 114: Global Hydraulic Equipment Market Volume K Unit Forecast, by End-user Industry 2019 & 2032
- Table 115: Global Hydraulic Equipment Market Revenue Million Forecast, by Country 2019 & 2032
- Table 116: Global Hydraulic Equipment Market Volume K Unit Forecast, by Country 2019 & 2032
- Table 117: Global Hydraulic Equipment Market Revenue Million Forecast, by Type 2019 & 2032
- Table 118: Global Hydraulic Equipment Market Volume K Unit Forecast, by Type 2019 & 2032
- Table 119: Global Hydraulic Equipment Market Revenue Million Forecast, by End-user Industry 2019 & 2032
- Table 120: Global Hydraulic Equipment Market Volume K Unit Forecast, by End-user Industry 2019 & 2032
- Table 121: Global Hydraulic Equipment Market Revenue Million Forecast, by Country 2019 & 2032
- Table 122: Global Hydraulic Equipment Market Volume K Unit Forecast, by Country 2019 & 2032
- Table 123: Global Hydraulic Equipment Market Revenue Million Forecast, by Type 2019 & 2032
- Table 124: Global Hydraulic Equipment Market Volume K Unit Forecast, by Type 2019 & 2032
- Table 125: Global Hydraulic Equipment Market Revenue Million Forecast, by End-user Industry 2019 & 2032
- Table 126: Global Hydraulic Equipment Market Volume K Unit Forecast, by End-user Industry 2019 & 2032
- Table 127: Global Hydraulic Equipment Market Revenue Million Forecast, by Country 2019 & 2032
- Table 128: Global Hydraulic Equipment Market Volume K Unit Forecast, by Country 2019 & 2032
- Table 129: Global Hydraulic Equipment Market Revenue Million Forecast, by Type 2019 & 2032
- Table 130: Global Hydraulic Equipment Market Volume K Unit Forecast, by Type 2019 & 2032
- Table 131: Global Hydraulic Equipment Market Revenue Million Forecast, by End-user Industry 2019 & 2032
- Table 132: Global Hydraulic Equipment Market Volume K Unit Forecast, by End-user Industry 2019 & 2032
- Table 133: Global Hydraulic Equipment Market Revenue Million Forecast, by Country 2019 & 2032
- Table 134: Global Hydraulic Equipment Market Volume K Unit Forecast, by Country 2019 & 2032
Frequently Asked Questions
1. What is the projected Compound Annual Growth Rate (CAGR) of the Hydraulic Equipment Market?
The projected CAGR is approximately 3.62%.
2. Which companies are prominent players in the Hydraulic Equipment Market?
Key companies in the market include Danfoss AS, Hydac International Gmbh, SMC Corporation, Bucher Hydraulics (Bucher Industries AG), Festo SE (Festo Beteiligungen GmbH & Co KG), Parker-Hannifin Corporation, Norgren Limited (IMI PLC), HAWE, Bosch Rexroth AG (ROBERT BOSCH GMBH), Linde Hydraulics GmbH & Co .
3. What are the main segments of the Hydraulic Equipment Market?
The market segments include Type, End-user Industry.
4. Can you provide details about the market size?
The market size is estimated to be USD 46.94 Million as of 2022.
5. What are some drivers contributing to market growth?
Increasing Demand for Material Handling Equipment; Increasing Demand From the Construction Industry via Government Initiatives and Investments.
6. What are the notable trends driving market growth?
Consutruction Segment to Witness Significant Growth.
7. Are there any restraints impacting market growth?
High Maintenance Cost Over the Equipment's Lifespan.
8. Can you provide examples of recent developments in the market?
Dec 2023, Stellar Industries launched a new hydraulic service crane utilizing the exclusive CDTpro Control System with Range Finder Technology. The new 14530 crane is a redesigned 14,000-lb class crane. The Stellar 14530 Hydraulic Service Crane has a reduced weight of about 11 percent (350 pounds) compared to the previous model. The new design features increased strength, with a lifting capacity of 92,000 ft-lbs vs. 82,600 ft-lbs, which creates more payload for the operator while increasing utility.
9. What pricing options are available for accessing the report?
Pricing options include single-user, multi-user, and enterprise licenses priced at USD 4750, USD 5250, and USD 8750 respectively.
10. Is the market size provided in terms of value or volume?
The market size is provided in terms of value, measured in Million and volume, measured in K Unit.
11. Are there any specific market keywords associated with the report?
Yes, the market keyword associated with the report is "Hydraulic Equipment Market," which aids in identifying and referencing the specific market segment covered.
12. How do I determine which pricing option suits my needs best?
The pricing options vary based on user requirements and access needs. Individual users may opt for single-user licenses, while businesses requiring broader access may choose multi-user or enterprise licenses for cost-effective access to the report.
13. Are there any additional resources or data provided in the Hydraulic Equipment Market report?
While the report offers comprehensive insights, it's advisable to review the specific contents or supplementary materials provided to ascertain if additional resources or data are available.
14. How can I stay updated on further developments or reports in the Hydraulic Equipment Market?
To stay informed about further developments, trends, and reports in the Hydraulic Equipment Market, consider subscribing to industry newsletters, following relevant companies and organizations, or regularly checking reputable industry news sources and publications.
Methodology
Step 1 - Identification of Relevant Samples Size from Population Database


Step 2 - Approaches for Defining Global Market Size (Value, Volume* & Price*)

Note*: In applicable scenarios
Step 3 - Data Sources
Primary Research
- Web Analytics
- Survey Reports
- Research Institute
- Latest Research Reports
- Opinion Leaders
Secondary Research
- Annual Reports
- White Paper
- Latest Press Release
- Industry Association
- Paid Database
- Investor Presentations

Step 4 - Data Triangulation
Involves using different sources of information in order to increase the validity of a study
These sources are likely to be stakeholders in a program - participants, other researchers, program staff, other community members, and so on.
Then we put all data in single framework & apply various statistical tools to find out the dynamic on the market.
During the analysis stage, feedback from the stakeholder groups would be compared to determine areas of agreement as well as areas of divergence


