
Key Insights
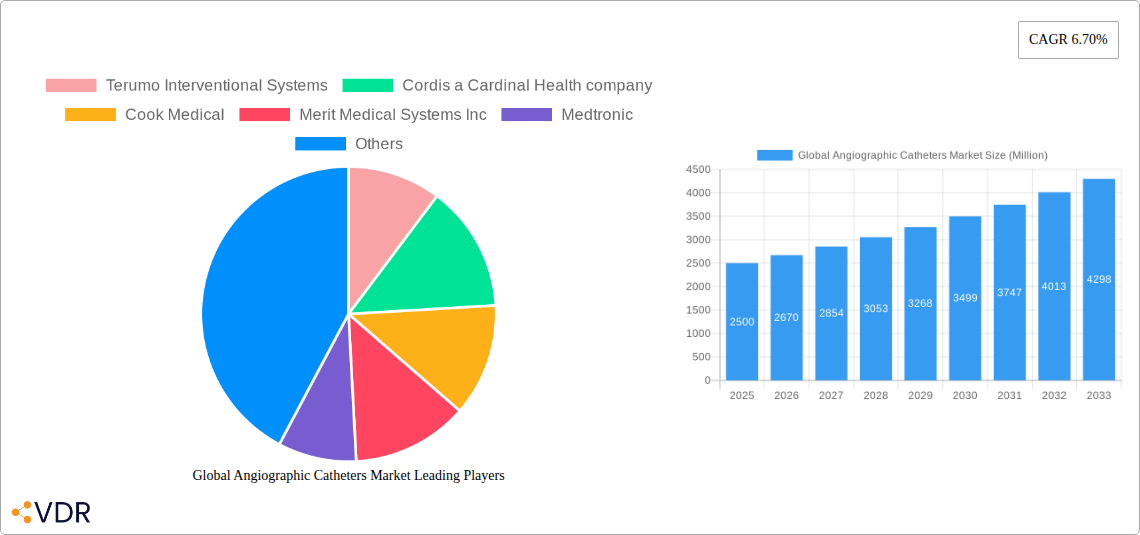
The global angiographic catheter market, valued at approximately $2.5 billion in 2025, is projected to experience robust growth, exhibiting a Compound Annual Growth Rate (CAGR) of 6.70% from 2025 to 2033. This expansion is driven by several key factors. The increasing prevalence of cardiovascular diseases globally necessitates more frequent diagnostic and interventional procedures, fueling demand for angiographic catheters. Technological advancements, including the development of more precise and minimally invasive catheters with improved imaging capabilities, contribute significantly to market growth. Furthermore, the rising geriatric population, a demographic more susceptible to cardiovascular conditions, further strengthens market demand. The market is segmented by application (coronary, endovascular, others) and end-user (hospitals, ambulatory surgical centers, specialty clinics, others). While hospitals currently dominate the end-user segment, the growth of ambulatory surgical centers and specialty clinics is expected to expand market reach and accessibility. North America and Europe are currently the largest regional markets, benefiting from advanced healthcare infrastructure and high adoption rates of minimally invasive procedures. However, Asia Pacific is poised for substantial growth due to rising healthcare expenditure and increasing awareness of cardiovascular health. Competitive pressures from established players like Terumo, Cordis, Cook Medical, Merit Medical, Medtronic, AngioDynamics, Oscor, and Boston Scientific, along with the emergence of innovative companies, are shaping the market landscape. While regulatory hurdles and pricing pressures present some challenges, the overall market outlook remains optimistic, driven by consistent technological advancements and the increasing global burden of cardiovascular disease.
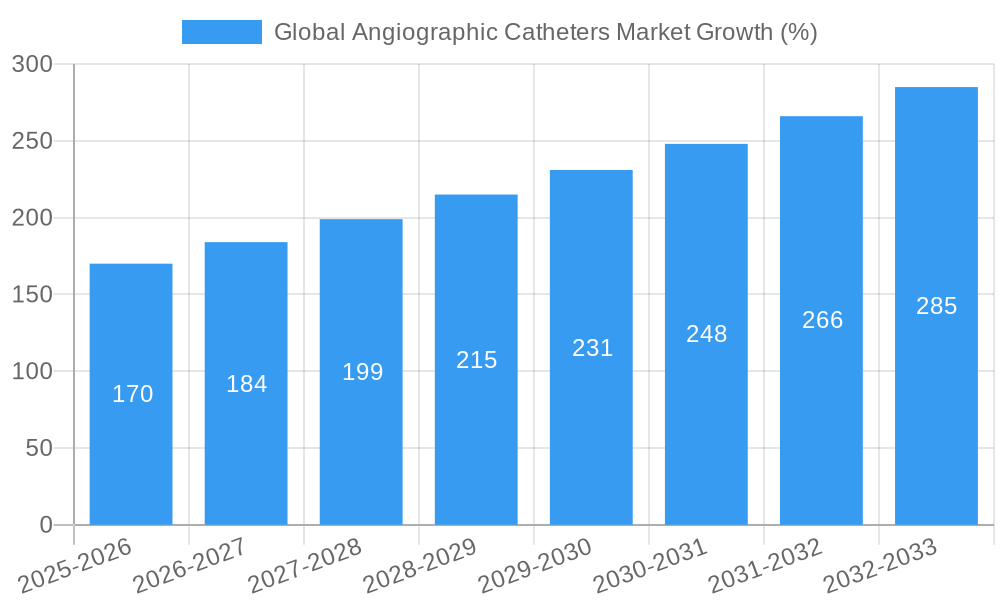
The sustained growth trajectory of the angiographic catheter market is projected to continue through 2033, fueled by ongoing advancements in catheter technology, such as improved biocompatibility, reduced thrombogenicity, and enhanced imaging capabilities. The increasing adoption of image-guided interventions, combined with the expanding use of minimally invasive procedures, significantly contributes to this growth. Furthermore, strategic partnerships and mergers and acquisitions within the industry are expected to further consolidate the market and drive innovation. The market will continue to be segmented by application and end-user, but we expect to see a gradual shift towards greater adoption in emerging markets, driven by rising disposable incomes and improved healthcare infrastructure. The competitive landscape is expected to remain dynamic, with ongoing innovation and strategic maneuvering by established players and emerging competitors.
Global Angiographic Catheters Market Report: 2019-2033
This comprehensive report provides a detailed analysis of the global angiographic catheters market, encompassing market dynamics, growth trends, regional segmentation, product landscape, and key players. The report covers the period from 2019 to 2033, with a base year of 2025 and a forecast period of 2025-2033. The market is segmented by application (Coronary, Endovascular, Others) and end-user (Hospital, Ambulatory Surgical Centers, Specialty Clinics, Others). This report is essential for industry professionals, investors, and strategists seeking to understand and capitalize on opportunities within this dynamic market, projected to reach xx Million units by 2033.
Global Angiographic Catheters Market Dynamics & Structure
The global angiographic catheters market is characterized by moderate concentration, with key players like Terumo Interventional Systems, Cordis (a Cardinal Health company), Cook Medical, Merit Medical Systems Inc, Medtronic, AngioDynamics, Oscor Inc, and Boston Scientific Corporation holding significant market share. Technological innovation, particularly in minimally invasive procedures and improved catheter design, is a major driver. Stringent regulatory frameworks, such as those set by the FDA, impact product development and market entry. Competition from substitute products and the evolving demographics of end-users also influence market dynamics. The historical period (2019-2024) witnessed a CAGR of xx%, while the forecast period (2025-2033) is projected to experience a CAGR of xx%. M&A activity in the sector has been moderate, with xx major deals recorded between 2019 and 2024.
- Market Concentration: Moderately concentrated, with top 8 players holding approximately xx% market share in 2024.
- Technological Innovation: Focus on improved material science, miniaturization, and enhanced imaging capabilities.
- Regulatory Landscape: Stringent FDA approvals and CE markings crucial for market entry.
- Competitive Substitutes: Limited direct substitutes, but alternative interventional techniques pose indirect competition.
- End-User Demographics: Growing prevalence of cardiovascular diseases drives demand, particularly in aging populations.
- M&A Trends: Moderate level of consolidation, with a focus on expanding product portfolios and geographical reach.
Global Angiographic Catheters Market Growth Trends & Insights
The global angiographic catheters market has witnessed consistent growth over the past few years, driven by the increasing prevalence of cardiovascular diseases globally and the rising adoption of minimally invasive procedures. Technological advancements, such as the development of more sophisticated catheters with improved imaging capabilities and enhanced biocompatibility, have further fueled market growth. Changes in consumer behavior, with a preference for less invasive treatments, also contribute to the market's expansion. Market penetration within emerging economies remains relatively low, presenting significant growth opportunities. The market size, valued at xx Million units in 2024, is expected to reach xx Million units by 2033, exhibiting substantial growth potential.
Dominant Regions, Countries, or Segments in Global Angiographic Catheters Market
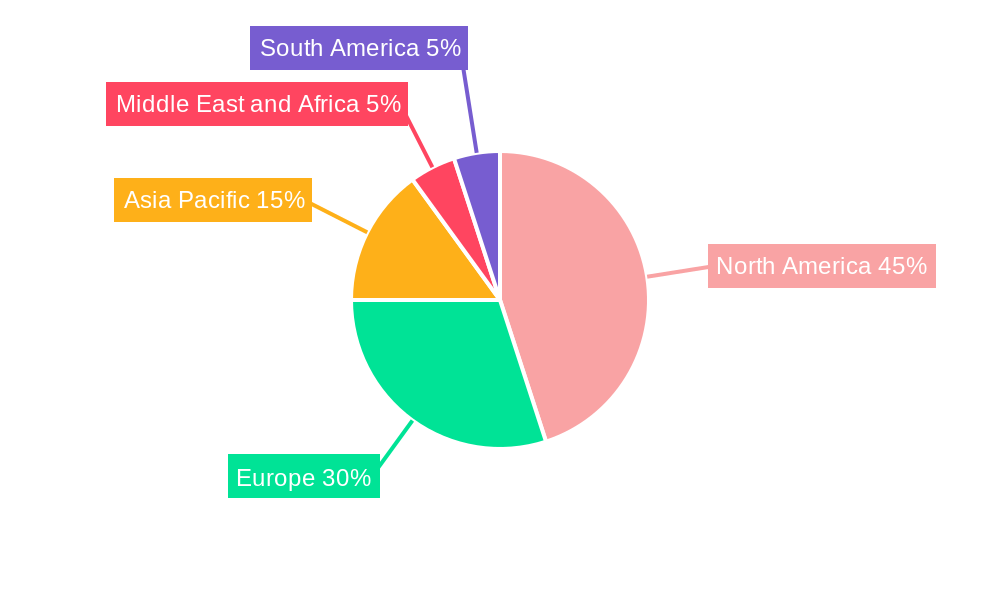
North America currently holds the largest market share in the global angiographic catheters market, driven by factors such as high healthcare expenditure, advanced medical infrastructure, and a high prevalence of cardiovascular diseases. Europe follows as a significant market, while Asia-Pacific is anticipated to experience the fastest growth during the forecast period due to increasing healthcare awareness, rising disposable incomes, and improving healthcare infrastructure. Within the application segment, coronary angiographic catheters dominate, followed by endovascular catheters. Hospitals constitute the largest end-user segment due to their extensive procedural capabilities and established infrastructure.
- North America: High healthcare expenditure, advanced infrastructure, and high prevalence of CVDs.
- Europe: Well-established healthcare systems and substantial government funding.
- Asia-Pacific: Rapidly growing healthcare sector, rising disposable incomes, and increasing healthcare awareness.
- Coronary Applications: Largest segment due to high prevalence of coronary artery disease.
- Hospital End-Users: Major segment due to established infrastructure and procedural capabilities.
Global Angiographic Catheters Market Product Landscape
The angiographic catheter market offers a range of products designed for various applications, including coronary, peripheral, and neurovascular interventions. Innovations focus on improved tracking, steerability, and biocompatibility, enhancing procedural efficiency and patient outcomes. Unique selling propositions often center around advanced materials, specialized coatings, and integrated technologies that reduce procedural complications. Technological advancements include the incorporation of sensors and imaging capabilities within the catheters themselves, enabling real-time monitoring and improved visualization during procedures.
Key Drivers, Barriers & Challenges in Global Angiographic Catheters Market
Key Drivers:
- Increasing prevalence of cardiovascular diseases.
- Growing adoption of minimally invasive procedures.
- Technological advancements in catheter design and materials.
- Rising healthcare expenditure and improved healthcare infrastructure in developing countries.
Key Challenges & Restraints:
- Stringent regulatory approvals and high development costs.
- Intense competition among established players.
- Potential supply chain disruptions due to geopolitical factors.
- Reimbursement challenges and variations in healthcare policies across different regions.
Emerging Opportunities in Global Angiographic Catheters Market
- Expansion into untapped markets, especially in developing countries.
- Development of novel catheter designs for specific applications (e.g., bioabsorbable catheters).
- Integration of advanced imaging technologies and data analytics to improve procedural efficacy.
- Growth of personalized medicine approaches tailored to individual patient needs.
Growth Accelerators in the Global Angiographic Catheters Market Industry
Technological breakthroughs, particularly in the development of biocompatible materials and improved imaging technologies, are major drivers of long-term growth. Strategic partnerships and collaborations between device manufacturers and healthcare providers foster innovation and market expansion. Increased investment in research and development, coupled with the adoption of advanced manufacturing techniques, will further accelerate market growth.
Key Players Shaping the Global Angiographic Catheters Market Market
- Terumo Interventional Systems
- Cordis a Cardinal Health company
- Cook Medical
- Merit Medical Systems Inc
- Medtronic
- AngioDynamics
- Oscor Inc
- Boston Scientific Corporation
Notable Milestones in Global Angiographic Catheters Market Sector
- February 2022: Teleflex received FDA clearance for expanded indication for specialty catheter and coronary guidewire use in crossing chronic total occlusion percutaneous coronary interventions.
- July 2021: Philips announced the first minimally invasive heart procedure using its real-time 3D intracardiac echocardiography catheter.
In-Depth Global Angiographic Catheters Market Market Outlook
The future of the global angiographic catheters market is promising, driven by continuous innovation in catheter technology and the rising prevalence of cardiovascular diseases. Strategic partnerships, market expansions into emerging economies, and the development of personalized medicine approaches present significant opportunities for growth. The market is poised for substantial expansion, with continued adoption of minimally invasive procedures and a focus on enhancing patient outcomes.
Global Angiographic Catheters Market Segmentation
-
1. Application
- 1.1. Coronary
- 1.2. Endovascular
- 1.3. Others
-
2. End User
- 2.1. Hospital
- 2.2. Ambulatory Surgical Centers
- 2.3. Specialty Clinics
- 2.4. Others
Global Angiographic Catheters Market Segmentation By Geography
-
1. North America
- 1.1. United States
- 1.2. Canada
- 1.3. Mexico
-
2. Europe
- 2.1. Germany
- 2.2. United Kingdom
- 2.3. France
- 2.4. Italy
- 2.5. Spain
- 2.6. Rest of Europe
-
3. Asia Pacific
- 3.1. China
- 3.2. Japan
- 3.3. India
- 3.4. Australia
- 3.5. South Korea
- 3.6. Rest of Asia Pacific
-
4. Middle East and Africa
- 4.1. GCC
- 4.2. South Africa
- 4.3. Rest of Middle East and Africa
-
5. South America
- 5.1. Brazil
- 5.2. Argentina
- 5.3. Rest of South America
Global Angiographic Catheters Market REPORT HIGHLIGHTS
| Aspects | Details |
|---|---|
| Study Period | 2019-2033 |
| Base Year | 2024 |
| Estimated Year | 2025 |
| Forecast Period | 2025-2033 |
| Historical Period | 2019-2024 |
| Growth Rate | CAGR of 6.70% from 2019-2033 |
| Segmentation |
|
Table of Contents
- 1. Introduction
- 1.1. Research Scope
- 1.2. Market Segmentation
- 1.3. Research Methodology
- 1.4. Definitions and Assumptions
- 2. Executive Summary
- 2.1. Introduction
- 3. Market Dynamics
- 3.1. Introduction
- 3.2. Market Drivers
- 3.2.1. Increasing Incidence of Cardiovascular Diseases; Rise in Demand for Minimally Invasive Procedures
- 3.3. Market Restrains
- 3.3.1. High Cost of Angiographic Procedures; Complications Associated with Angiographic Catheters
- 3.4. Market Trends
- 3.4.1. Hospital is Expected to Hold Significant Market Share in the End User Segment
- 4. Market Factor Analysis
- 4.1. Porters Five Forces
- 4.2. Supply/Value Chain
- 4.3. PESTEL analysis
- 4.4. Market Entropy
- 4.5. Patent/Trademark Analysis
- 5. Global Angiographic Catheters Market Analysis, Insights and Forecast, 2019-2031
- 5.1. Market Analysis, Insights and Forecast - by Application
- 5.1.1. Coronary
- 5.1.2. Endovascular
- 5.1.3. Others
- 5.2. Market Analysis, Insights and Forecast - by End User
- 5.2.1. Hospital
- 5.2.2. Ambulatory Surgical Centers
- 5.2.3. Specialty Clinics
- 5.2.4. Others
- 5.3. Market Analysis, Insights and Forecast - by Region
- 5.3.1. North America
- 5.3.2. Europe
- 5.3.3. Asia Pacific
- 5.3.4. Middle East and Africa
- 5.3.5. South America
- 5.1. Market Analysis, Insights and Forecast - by Application
- 6. North America Global Angiographic Catheters Market Analysis, Insights and Forecast, 2019-2031
- 6.1. Market Analysis, Insights and Forecast - by Application
- 6.1.1. Coronary
- 6.1.2. Endovascular
- 6.1.3. Others
- 6.2. Market Analysis, Insights and Forecast - by End User
- 6.2.1. Hospital
- 6.2.2. Ambulatory Surgical Centers
- 6.2.3. Specialty Clinics
- 6.2.4. Others
- 6.1. Market Analysis, Insights and Forecast - by Application
- 7. Europe Global Angiographic Catheters Market Analysis, Insights and Forecast, 2019-2031
- 7.1. Market Analysis, Insights and Forecast - by Application
- 7.1.1. Coronary
- 7.1.2. Endovascular
- 7.1.3. Others
- 7.2. Market Analysis, Insights and Forecast - by End User
- 7.2.1. Hospital
- 7.2.2. Ambulatory Surgical Centers
- 7.2.3. Specialty Clinics
- 7.2.4. Others
- 7.1. Market Analysis, Insights and Forecast - by Application
- 8. Asia Pacific Global Angiographic Catheters Market Analysis, Insights and Forecast, 2019-2031
- 8.1. Market Analysis, Insights and Forecast - by Application
- 8.1.1. Coronary
- 8.1.2. Endovascular
- 8.1.3. Others
- 8.2. Market Analysis, Insights and Forecast - by End User
- 8.2.1. Hospital
- 8.2.2. Ambulatory Surgical Centers
- 8.2.3. Specialty Clinics
- 8.2.4. Others
- 8.1. Market Analysis, Insights and Forecast - by Application
- 9. Middle East and Africa Global Angiographic Catheters Market Analysis, Insights and Forecast, 2019-2031
- 9.1. Market Analysis, Insights and Forecast - by Application
- 9.1.1. Coronary
- 9.1.2. Endovascular
- 9.1.3. Others
- 9.2. Market Analysis, Insights and Forecast - by End User
- 9.2.1. Hospital
- 9.2.2. Ambulatory Surgical Centers
- 9.2.3. Specialty Clinics
- 9.2.4. Others
- 9.1. Market Analysis, Insights and Forecast - by Application
- 10. South America Global Angiographic Catheters Market Analysis, Insights and Forecast, 2019-2031
- 10.1. Market Analysis, Insights and Forecast - by Application
- 10.1.1. Coronary
- 10.1.2. Endovascular
- 10.1.3. Others
- 10.2. Market Analysis, Insights and Forecast - by End User
- 10.2.1. Hospital
- 10.2.2. Ambulatory Surgical Centers
- 10.2.3. Specialty Clinics
- 10.2.4. Others
- 10.1. Market Analysis, Insights and Forecast - by Application
- 11. North America Global Angiographic Catheters Market Analysis, Insights and Forecast, 2019-2031
- 11.1. Market Analysis, Insights and Forecast - By Country/Sub-region
- 11.1.1. undefined
- 12. Europe Global Angiographic Catheters Market Analysis, Insights and Forecast, 2019-2031
- 12.1. Market Analysis, Insights and Forecast - By Country/Sub-region
- 12.1.1. undefined
- 13. Asia Pacific Global Angiographic Catheters Market Analysis, Insights and Forecast, 2019-2031
- 13.1. Market Analysis, Insights and Forecast - By Country/Sub-region
- 13.1.1. undefined
- 14. Middle East and Africa Global Angiographic Catheters Market Analysis, Insights and Forecast, 2019-2031
- 14.1. Market Analysis, Insights and Forecast - By Country/Sub-region
- 14.1.1. undefined
- 15. South America Global Angiographic Catheters Market Analysis, Insights and Forecast, 2019-2031
- 15.1. Market Analysis, Insights and Forecast - By Country/Sub-region
- 15.1.1. undefined
- 16. Competitive Analysis
- 16.1. Market Share Analysis 2024
- 16.2. Company Profiles
- 16.2.1 Terumo Interventional Systems
- 16.2.1.1. Overview
- 16.2.1.2. Products
- 16.2.1.3. SWOT Analysis
- 16.2.1.4. Recent Developments
- 16.2.1.5. Financials (Based on Availability)
- 16.2.2 Cordis a Cardinal Health company
- 16.2.2.1. Overview
- 16.2.2.2. Products
- 16.2.2.3. SWOT Analysis
- 16.2.2.4. Recent Developments
- 16.2.2.5. Financials (Based on Availability)
- 16.2.3 Cook Medical
- 16.2.3.1. Overview
- 16.2.3.2. Products
- 16.2.3.3. SWOT Analysis
- 16.2.3.4. Recent Developments
- 16.2.3.5. Financials (Based on Availability)
- 16.2.4 Merit Medical Systems Inc
- 16.2.4.1. Overview
- 16.2.4.2. Products
- 16.2.4.3. SWOT Analysis
- 16.2.4.4. Recent Developments
- 16.2.4.5. Financials (Based on Availability)
- 16.2.5 Medtronic
- 16.2.5.1. Overview
- 16.2.5.2. Products
- 16.2.5.3. SWOT Analysis
- 16.2.5.4. Recent Developments
- 16.2.5.5. Financials (Based on Availability)
- 16.2.6 AngioDynamics
- 16.2.6.1. Overview
- 16.2.6.2. Products
- 16.2.6.3. SWOT Analysis
- 16.2.6.4. Recent Developments
- 16.2.6.5. Financials (Based on Availability)
- 16.2.7 Oscor Inc
- 16.2.7.1. Overview
- 16.2.7.2. Products
- 16.2.7.3. SWOT Analysis
- 16.2.7.4. Recent Developments
- 16.2.7.5. Financials (Based on Availability)
- 16.2.8 Boston Scientific Corporation
- 16.2.8.1. Overview
- 16.2.8.2. Products
- 16.2.8.3. SWOT Analysis
- 16.2.8.4. Recent Developments
- 16.2.8.5. Financials (Based on Availability)
- 16.2.1 Terumo Interventional Systems
List of Figures
- Figure 1: Global Global Angiographic Catheters Market Revenue Breakdown (Million, %) by Region 2024 & 2032
- Figure 2: Global Global Angiographic Catheters Market Volume Breakdown (K Unit, %) by Region 2024 & 2032
- Figure 3: North America Global Angiographic Catheters Market Revenue (Million), by Country 2024 & 2032
- Figure 4: North America Global Angiographic Catheters Market Volume (K Unit), by Country 2024 & 2032
- Figure 5: North America Global Angiographic Catheters Market Revenue Share (%), by Country 2024 & 2032
- Figure 6: North America Global Angiographic Catheters Market Volume Share (%), by Country 2024 & 2032
- Figure 7: Europe Global Angiographic Catheters Market Revenue (Million), by Country 2024 & 2032
- Figure 8: Europe Global Angiographic Catheters Market Volume (K Unit), by Country 2024 & 2032
- Figure 9: Europe Global Angiographic Catheters Market Revenue Share (%), by Country 2024 & 2032
- Figure 10: Europe Global Angiographic Catheters Market Volume Share (%), by Country 2024 & 2032
- Figure 11: Asia Pacific Global Angiographic Catheters Market Revenue (Million), by Country 2024 & 2032
- Figure 12: Asia Pacific Global Angiographic Catheters Market Volume (K Unit), by Country 2024 & 2032
- Figure 13: Asia Pacific Global Angiographic Catheters Market Revenue Share (%), by Country 2024 & 2032
- Figure 14: Asia Pacific Global Angiographic Catheters Market Volume Share (%), by Country 2024 & 2032
- Figure 15: Middle East and Africa Global Angiographic Catheters Market Revenue (Million), by Country 2024 & 2032
- Figure 16: Middle East and Africa Global Angiographic Catheters Market Volume (K Unit), by Country 2024 & 2032
- Figure 17: Middle East and Africa Global Angiographic Catheters Market Revenue Share (%), by Country 2024 & 2032
- Figure 18: Middle East and Africa Global Angiographic Catheters Market Volume Share (%), by Country 2024 & 2032
- Figure 19: South America Global Angiographic Catheters Market Revenue (Million), by Country 2024 & 2032
- Figure 20: South America Global Angiographic Catheters Market Volume (K Unit), by Country 2024 & 2032
- Figure 21: South America Global Angiographic Catheters Market Revenue Share (%), by Country 2024 & 2032
- Figure 22: South America Global Angiographic Catheters Market Volume Share (%), by Country 2024 & 2032
- Figure 23: North America Global Angiographic Catheters Market Revenue (Million), by Application 2024 & 2032
- Figure 24: North America Global Angiographic Catheters Market Volume (K Unit), by Application 2024 & 2032
- Figure 25: North America Global Angiographic Catheters Market Revenue Share (%), by Application 2024 & 2032
- Figure 26: North America Global Angiographic Catheters Market Volume Share (%), by Application 2024 & 2032
- Figure 27: North America Global Angiographic Catheters Market Revenue (Million), by End User 2024 & 2032
- Figure 28: North America Global Angiographic Catheters Market Volume (K Unit), by End User 2024 & 2032
- Figure 29: North America Global Angiographic Catheters Market Revenue Share (%), by End User 2024 & 2032
- Figure 30: North America Global Angiographic Catheters Market Volume Share (%), by End User 2024 & 2032
- Figure 31: North America Global Angiographic Catheters Market Revenue (Million), by Country 2024 & 2032
- Figure 32: North America Global Angiographic Catheters Market Volume (K Unit), by Country 2024 & 2032
- Figure 33: North America Global Angiographic Catheters Market Revenue Share (%), by Country 2024 & 2032
- Figure 34: North America Global Angiographic Catheters Market Volume Share (%), by Country 2024 & 2032
- Figure 35: Europe Global Angiographic Catheters Market Revenue (Million), by Application 2024 & 2032
- Figure 36: Europe Global Angiographic Catheters Market Volume (K Unit), by Application 2024 & 2032
- Figure 37: Europe Global Angiographic Catheters Market Revenue Share (%), by Application 2024 & 2032
- Figure 38: Europe Global Angiographic Catheters Market Volume Share (%), by Application 2024 & 2032
- Figure 39: Europe Global Angiographic Catheters Market Revenue (Million), by End User 2024 & 2032
- Figure 40: Europe Global Angiographic Catheters Market Volume (K Unit), by End User 2024 & 2032
- Figure 41: Europe Global Angiographic Catheters Market Revenue Share (%), by End User 2024 & 2032
- Figure 42: Europe Global Angiographic Catheters Market Volume Share (%), by End User 2024 & 2032
- Figure 43: Europe Global Angiographic Catheters Market Revenue (Million), by Country 2024 & 2032
- Figure 44: Europe Global Angiographic Catheters Market Volume (K Unit), by Country 2024 & 2032
- Figure 45: Europe Global Angiographic Catheters Market Revenue Share (%), by Country 2024 & 2032
- Figure 46: Europe Global Angiographic Catheters Market Volume Share (%), by Country 2024 & 2032
- Figure 47: Asia Pacific Global Angiographic Catheters Market Revenue (Million), by Application 2024 & 2032
- Figure 48: Asia Pacific Global Angiographic Catheters Market Volume (K Unit), by Application 2024 & 2032
- Figure 49: Asia Pacific Global Angiographic Catheters Market Revenue Share (%), by Application 2024 & 2032
- Figure 50: Asia Pacific Global Angiographic Catheters Market Volume Share (%), by Application 2024 & 2032
- Figure 51: Asia Pacific Global Angiographic Catheters Market Revenue (Million), by End User 2024 & 2032
- Figure 52: Asia Pacific Global Angiographic Catheters Market Volume (K Unit), by End User 2024 & 2032
- Figure 53: Asia Pacific Global Angiographic Catheters Market Revenue Share (%), by End User 2024 & 2032
- Figure 54: Asia Pacific Global Angiographic Catheters Market Volume Share (%), by End User 2024 & 2032
- Figure 55: Asia Pacific Global Angiographic Catheters Market Revenue (Million), by Country 2024 & 2032
- Figure 56: Asia Pacific Global Angiographic Catheters Market Volume (K Unit), by Country 2024 & 2032
- Figure 57: Asia Pacific Global Angiographic Catheters Market Revenue Share (%), by Country 2024 & 2032
- Figure 58: Asia Pacific Global Angiographic Catheters Market Volume Share (%), by Country 2024 & 2032
- Figure 59: Middle East and Africa Global Angiographic Catheters Market Revenue (Million), by Application 2024 & 2032
- Figure 60: Middle East and Africa Global Angiographic Catheters Market Volume (K Unit), by Application 2024 & 2032
- Figure 61: Middle East and Africa Global Angiographic Catheters Market Revenue Share (%), by Application 2024 & 2032
- Figure 62: Middle East and Africa Global Angiographic Catheters Market Volume Share (%), by Application 2024 & 2032
- Figure 63: Middle East and Africa Global Angiographic Catheters Market Revenue (Million), by End User 2024 & 2032
- Figure 64: Middle East and Africa Global Angiographic Catheters Market Volume (K Unit), by End User 2024 & 2032
- Figure 65: Middle East and Africa Global Angiographic Catheters Market Revenue Share (%), by End User 2024 & 2032
- Figure 66: Middle East and Africa Global Angiographic Catheters Market Volume Share (%), by End User 2024 & 2032
- Figure 67: Middle East and Africa Global Angiographic Catheters Market Revenue (Million), by Country 2024 & 2032
- Figure 68: Middle East and Africa Global Angiographic Catheters Market Volume (K Unit), by Country 2024 & 2032
- Figure 69: Middle East and Africa Global Angiographic Catheters Market Revenue Share (%), by Country 2024 & 2032
- Figure 70: Middle East and Africa Global Angiographic Catheters Market Volume Share (%), by Country 2024 & 2032
- Figure 71: South America Global Angiographic Catheters Market Revenue (Million), by Application 2024 & 2032
- Figure 72: South America Global Angiographic Catheters Market Volume (K Unit), by Application 2024 & 2032
- Figure 73: South America Global Angiographic Catheters Market Revenue Share (%), by Application 2024 & 2032
- Figure 74: South America Global Angiographic Catheters Market Volume Share (%), by Application 2024 & 2032
- Figure 75: South America Global Angiographic Catheters Market Revenue (Million), by End User 2024 & 2032
- Figure 76: South America Global Angiographic Catheters Market Volume (K Unit), by End User 2024 & 2032
- Figure 77: South America Global Angiographic Catheters Market Revenue Share (%), by End User 2024 & 2032
- Figure 78: South America Global Angiographic Catheters Market Volume Share (%), by End User 2024 & 2032
- Figure 79: South America Global Angiographic Catheters Market Revenue (Million), by Country 2024 & 2032
- Figure 80: South America Global Angiographic Catheters Market Volume (K Unit), by Country 2024 & 2032
- Figure 81: South America Global Angiographic Catheters Market Revenue Share (%), by Country 2024 & 2032
- Figure 82: South America Global Angiographic Catheters Market Volume Share (%), by Country 2024 & 2032
List of Tables
- Table 1: Global Angiographic Catheters Market Revenue Million Forecast, by Region 2019 & 2032
- Table 2: Global Angiographic Catheters Market Volume K Unit Forecast, by Region 2019 & 2032
- Table 3: Global Angiographic Catheters Market Revenue Million Forecast, by Application 2019 & 2032
- Table 4: Global Angiographic Catheters Market Volume K Unit Forecast, by Application 2019 & 2032
- Table 5: Global Angiographic Catheters Market Revenue Million Forecast, by End User 2019 & 2032
- Table 6: Global Angiographic Catheters Market Volume K Unit Forecast, by End User 2019 & 2032
- Table 7: Global Angiographic Catheters Market Revenue Million Forecast, by Region 2019 & 2032
- Table 8: Global Angiographic Catheters Market Volume K Unit Forecast, by Region 2019 & 2032
- Table 9: Global Angiographic Catheters Market Revenue Million Forecast, by Country 2019 & 2032
- Table 10: Global Angiographic Catheters Market Volume K Unit Forecast, by Country 2019 & 2032
- Table 11: Global Angiographic Catheters Market Revenue Million Forecast, by Country 2019 & 2032
- Table 12: Global Angiographic Catheters Market Volume K Unit Forecast, by Country 2019 & 2032
- Table 13: Global Angiographic Catheters Market Revenue Million Forecast, by Country 2019 & 2032
- Table 14: Global Angiographic Catheters Market Volume K Unit Forecast, by Country 2019 & 2032
- Table 15: Global Angiographic Catheters Market Revenue Million Forecast, by Country 2019 & 2032
- Table 16: Global Angiographic Catheters Market Volume K Unit Forecast, by Country 2019 & 2032
- Table 17: Global Angiographic Catheters Market Revenue Million Forecast, by Country 2019 & 2032
- Table 18: Global Angiographic Catheters Market Volume K Unit Forecast, by Country 2019 & 2032
- Table 19: Global Angiographic Catheters Market Revenue Million Forecast, by Application 2019 & 2032
- Table 20: Global Angiographic Catheters Market Volume K Unit Forecast, by Application 2019 & 2032
- Table 21: Global Angiographic Catheters Market Revenue Million Forecast, by End User 2019 & 2032
- Table 22: Global Angiographic Catheters Market Volume K Unit Forecast, by End User 2019 & 2032
- Table 23: Global Angiographic Catheters Market Revenue Million Forecast, by Country 2019 & 2032
- Table 24: Global Angiographic Catheters Market Volume K Unit Forecast, by Country 2019 & 2032
- Table 25: United States Global Angiographic Catheters Market Revenue (Million) Forecast, by Application 2019 & 2032
- Table 26: United States Global Angiographic Catheters Market Volume (K Unit) Forecast, by Application 2019 & 2032
- Table 27: Canada Global Angiographic Catheters Market Revenue (Million) Forecast, by Application 2019 & 2032
- Table 28: Canada Global Angiographic Catheters Market Volume (K Unit) Forecast, by Application 2019 & 2032
- Table 29: Mexico Global Angiographic Catheters Market Revenue (Million) Forecast, by Application 2019 & 2032
- Table 30: Mexico Global Angiographic Catheters Market Volume (K Unit) Forecast, by Application 2019 & 2032
- Table 31: Global Angiographic Catheters Market Revenue Million Forecast, by Application 2019 & 2032
- Table 32: Global Angiographic Catheters Market Volume K Unit Forecast, by Application 2019 & 2032
- Table 33: Global Angiographic Catheters Market Revenue Million Forecast, by End User 2019 & 2032
- Table 34: Global Angiographic Catheters Market Volume K Unit Forecast, by End User 2019 & 2032
- Table 35: Global Angiographic Catheters Market Revenue Million Forecast, by Country 2019 & 2032
- Table 36: Global Angiographic Catheters Market Volume K Unit Forecast, by Country 2019 & 2032
- Table 37: Germany Global Angiographic Catheters Market Revenue (Million) Forecast, by Application 2019 & 2032
- Table 38: Germany Global Angiographic Catheters Market Volume (K Unit) Forecast, by Application 2019 & 2032
- Table 39: United Kingdom Global Angiographic Catheters Market Revenue (Million) Forecast, by Application 2019 & 2032
- Table 40: United Kingdom Global Angiographic Catheters Market Volume (K Unit) Forecast, by Application 2019 & 2032
- Table 41: France Global Angiographic Catheters Market Revenue (Million) Forecast, by Application 2019 & 2032
- Table 42: France Global Angiographic Catheters Market Volume (K Unit) Forecast, by Application 2019 & 2032
- Table 43: Italy Global Angiographic Catheters Market Revenue (Million) Forecast, by Application 2019 & 2032
- Table 44: Italy Global Angiographic Catheters Market Volume (K Unit) Forecast, by Application 2019 & 2032
- Table 45: Spain Global Angiographic Catheters Market Revenue (Million) Forecast, by Application 2019 & 2032
- Table 46: Spain Global Angiographic Catheters Market Volume (K Unit) Forecast, by Application 2019 & 2032
- Table 47: Rest of Europe Global Angiographic Catheters Market Revenue (Million) Forecast, by Application 2019 & 2032
- Table 48: Rest of Europe Global Angiographic Catheters Market Volume (K Unit) Forecast, by Application 2019 & 2032
- Table 49: Global Angiographic Catheters Market Revenue Million Forecast, by Application 2019 & 2032
- Table 50: Global Angiographic Catheters Market Volume K Unit Forecast, by Application 2019 & 2032
- Table 51: Global Angiographic Catheters Market Revenue Million Forecast, by End User 2019 & 2032
- Table 52: Global Angiographic Catheters Market Volume K Unit Forecast, by End User 2019 & 2032
- Table 53: Global Angiographic Catheters Market Revenue Million Forecast, by Country 2019 & 2032
- Table 54: Global Angiographic Catheters Market Volume K Unit Forecast, by Country 2019 & 2032
- Table 55: China Global Angiographic Catheters Market Revenue (Million) Forecast, by Application 2019 & 2032
- Table 56: China Global Angiographic Catheters Market Volume (K Unit) Forecast, by Application 2019 & 2032
- Table 57: Japan Global Angiographic Catheters Market Revenue (Million) Forecast, by Application 2019 & 2032
- Table 58: Japan Global Angiographic Catheters Market Volume (K Unit) Forecast, by Application 2019 & 2032
- Table 59: India Global Angiographic Catheters Market Revenue (Million) Forecast, by Application 2019 & 2032
- Table 60: India Global Angiographic Catheters Market Volume (K Unit) Forecast, by Application 2019 & 2032
- Table 61: Australia Global Angiographic Catheters Market Revenue (Million) Forecast, by Application 2019 & 2032
- Table 62: Australia Global Angiographic Catheters Market Volume (K Unit) Forecast, by Application 2019 & 2032
- Table 63: South Korea Global Angiographic Catheters Market Revenue (Million) Forecast, by Application 2019 & 2032
- Table 64: South Korea Global Angiographic Catheters Market Volume (K Unit) Forecast, by Application 2019 & 2032
- Table 65: Rest of Asia Pacific Global Angiographic Catheters Market Revenue (Million) Forecast, by Application 2019 & 2032
- Table 66: Rest of Asia Pacific Global Angiographic Catheters Market Volume (K Unit) Forecast, by Application 2019 & 2032
- Table 67: Global Angiographic Catheters Market Revenue Million Forecast, by Application 2019 & 2032
- Table 68: Global Angiographic Catheters Market Volume K Unit Forecast, by Application 2019 & 2032
- Table 69: Global Angiographic Catheters Market Revenue Million Forecast, by End User 2019 & 2032
- Table 70: Global Angiographic Catheters Market Volume K Unit Forecast, by End User 2019 & 2032
- Table 71: Global Angiographic Catheters Market Revenue Million Forecast, by Country 2019 & 2032
- Table 72: Global Angiographic Catheters Market Volume K Unit Forecast, by Country 2019 & 2032
- Table 73: GCC Global Angiographic Catheters Market Revenue (Million) Forecast, by Application 2019 & 2032
- Table 74: GCC Global Angiographic Catheters Market Volume (K Unit) Forecast, by Application 2019 & 2032
- Table 75: South Africa Global Angiographic Catheters Market Revenue (Million) Forecast, by Application 2019 & 2032
- Table 76: South Africa Global Angiographic Catheters Market Volume (K Unit) Forecast, by Application 2019 & 2032
- Table 77: Rest of Middle East and Africa Global Angiographic Catheters Market Revenue (Million) Forecast, by Application 2019 & 2032
- Table 78: Rest of Middle East and Africa Global Angiographic Catheters Market Volume (K Unit) Forecast, by Application 2019 & 2032
- Table 79: Global Angiographic Catheters Market Revenue Million Forecast, by Application 2019 & 2032
- Table 80: Global Angiographic Catheters Market Volume K Unit Forecast, by Application 2019 & 2032
- Table 81: Global Angiographic Catheters Market Revenue Million Forecast, by End User 2019 & 2032
- Table 82: Global Angiographic Catheters Market Volume K Unit Forecast, by End User 2019 & 2032
- Table 83: Global Angiographic Catheters Market Revenue Million Forecast, by Country 2019 & 2032
- Table 84: Global Angiographic Catheters Market Volume K Unit Forecast, by Country 2019 & 2032
- Table 85: Brazil Global Angiographic Catheters Market Revenue (Million) Forecast, by Application 2019 & 2032
- Table 86: Brazil Global Angiographic Catheters Market Volume (K Unit) Forecast, by Application 2019 & 2032
- Table 87: Argentina Global Angiographic Catheters Market Revenue (Million) Forecast, by Application 2019 & 2032
- Table 88: Argentina Global Angiographic Catheters Market Volume (K Unit) Forecast, by Application 2019 & 2032
- Table 89: Rest of South America Global Angiographic Catheters Market Revenue (Million) Forecast, by Application 2019 & 2032
- Table 90: Rest of South America Global Angiographic Catheters Market Volume (K Unit) Forecast, by Application 2019 & 2032
Frequently Asked Questions
1. What is the projected Compound Annual Growth Rate (CAGR) of the Global Angiographic Catheters Market?
The projected CAGR is approximately 6.70%.
2. Which companies are prominent players in the Global Angiographic Catheters Market?
Key companies in the market include Terumo Interventional Systems, Cordis a Cardinal Health company, Cook Medical, Merit Medical Systems Inc, Medtronic, AngioDynamics, Oscor Inc, Boston Scientific Corporation.
3. What are the main segments of the Global Angiographic Catheters Market?
The market segments include Application, End User.
4. Can you provide details about the market size?
The market size is estimated to be USD XX Million as of 2022.
5. What are some drivers contributing to market growth?
Increasing Incidence of Cardiovascular Diseases; Rise in Demand for Minimally Invasive Procedures.
6. What are the notable trends driving market growth?
Hospital is Expected to Hold Significant Market Share in the End User Segment.
7. Are there any restraints impacting market growth?
High Cost of Angiographic Procedures; Complications Associated with Angiographic Catheters.
8. Can you provide examples of recent developments in the market?
In Febraury 2022, Teleflex received Food and Drug Adminstration clearence for expanded indication for speciality catheter and coronary guidewire use in crossing chronic total occlusion percutaneous coronary interventions.
9. What pricing options are available for accessing the report?
Pricing options include single-user, multi-user, and enterprise licenses priced at USD 4750, USD 5250, and USD 8750 respectively.
10. Is the market size provided in terms of value or volume?
The market size is provided in terms of value, measured in Million and volume, measured in K Unit.
11. Are there any specific market keywords associated with the report?
Yes, the market keyword associated with the report is "Global Angiographic Catheters Market," which aids in identifying and referencing the specific market segment covered.
12. How do I determine which pricing option suits my needs best?
The pricing options vary based on user requirements and access needs. Individual users may opt for single-user licenses, while businesses requiring broader access may choose multi-user or enterprise licenses for cost-effective access to the report.
13. Are there any additional resources or data provided in the Global Angiographic Catheters Market report?
While the report offers comprehensive insights, it's advisable to review the specific contents or supplementary materials provided to ascertain if additional resources or data are available.
14. How can I stay updated on further developments or reports in the Global Angiographic Catheters Market?
To stay informed about further developments, trends, and reports in the Global Angiographic Catheters Market, consider subscribing to industry newsletters, following relevant companies and organizations, or regularly checking reputable industry news sources and publications.
Methodology
Step 1 - Identification of Relevant Samples Size from Population Database


Step 2 - Approaches for Defining Global Market Size (Value, Volume* & Price*)

Note*: In applicable scenarios
Step 3 - Data Sources
Primary Research
- Web Analytics
- Survey Reports
- Research Institute
- Latest Research Reports
- Opinion Leaders
Secondary Research
- Annual Reports
- White Paper
- Latest Press Release
- Industry Association
- Paid Database
- Investor Presentations

Step 4 - Data Triangulation
Involves using different sources of information in order to increase the validity of a study
These sources are likely to be stakeholders in a program - participants, other researchers, program staff, other community members, and so on.
Then we put all data in single framework & apply various statistical tools to find out the dynamic on the market.
During the analysis stage, feedback from the stakeholder groups would be compared to determine areas of agreement as well as areas of divergence


