
Key Insights
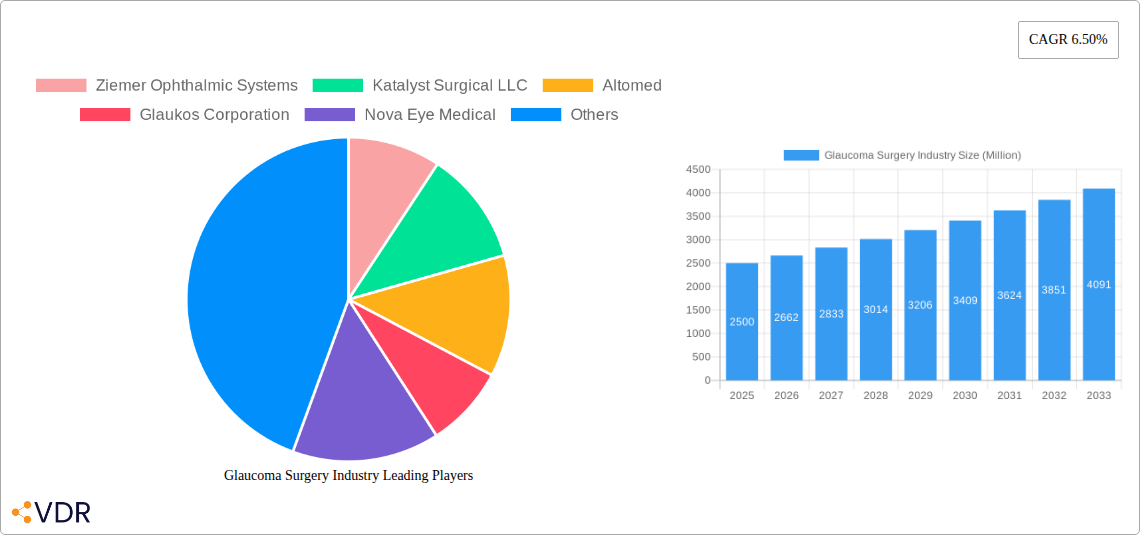
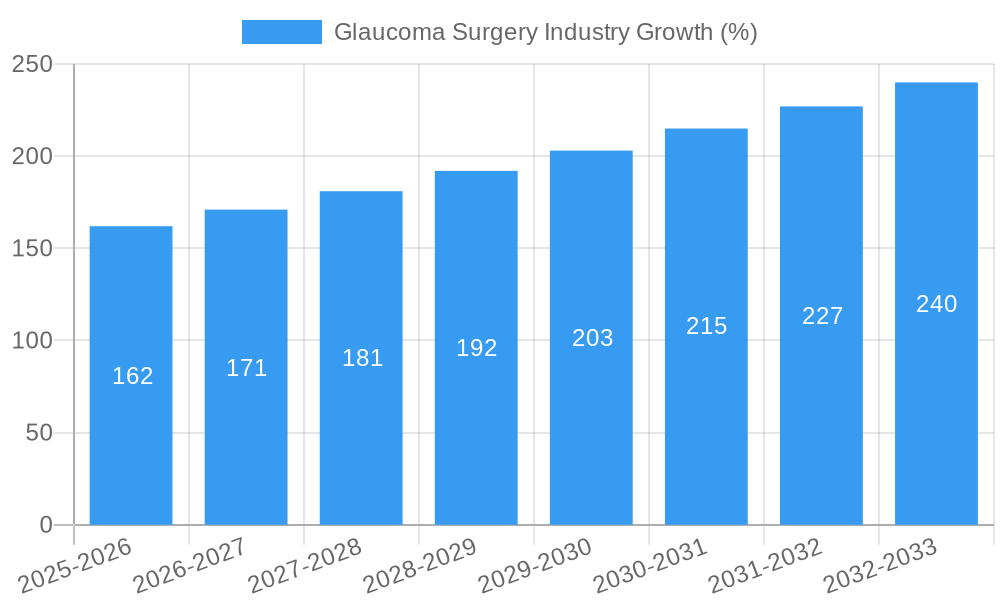
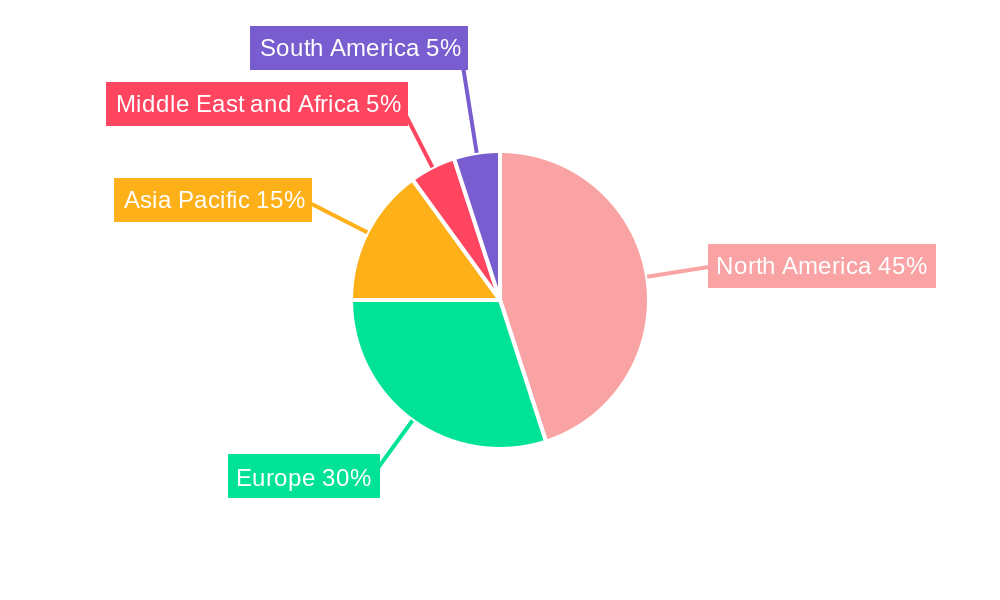
The global glaucoma surgery market is experiencing robust growth, driven by increasing prevalence of glaucoma, advancements in minimally invasive surgical techniques (MIGS), and a rising geriatric population. The market, valued at approximately $2.5 billion in 2025, is projected to exhibit a Compound Annual Growth Rate (CAGR) of 6.50% from 2025 to 2033, reaching an estimated value exceeding $4.5 billion by 2033. This growth is fueled by several key factors. The shift towards MIGS procedures, offering less invasive alternatives to traditional glaucoma surgery, is a significant driver, as is the continuous development of innovative devices like glaucoma drainage devices and laser systems that improve surgical outcomes and reduce recovery times. Furthermore, increasing healthcare expenditure and improved access to advanced ophthalmic care in developing regions are contributing to market expansion. However, the high cost of advanced surgical equipment and procedures, alongside the availability of alternative treatment options, represents a restraint on market growth. The market is segmented by product (Glaucoma Drainage Devices, Laser Systems, Punches, Probes, Other Products), surgery method (Traditional, MIGS, Laser Surgery), and end-user (Hospitals, Ophthalmic Clinics, Other End Users). North America currently holds the largest market share due to high healthcare spending and technological advancements, followed by Europe. The Asia-Pacific region is poised for significant growth, driven by increasing awareness and improving healthcare infrastructure. Key players in the market include Ziemer Ophthalmic Systems, Katalyst Surgical LLC, Glaukos Corporation, and major medical device companies like Johnson & Johnson and Alcon, who are actively engaged in research and development to enhance existing products and introduce novel technologies.
The competitive landscape is characterized by both established players and emerging companies vying for market share through product innovation, strategic partnerships, and geographical expansion. Companies are focusing on developing technologically superior products with improved safety and efficacy profiles, driving demand for the latest glaucoma surgical tools and techniques. The market's future growth will be largely influenced by ongoing technological innovations, regulatory approvals, and the rising adoption of cost-effective MIGS procedures, particularly in emerging markets. The integration of advanced imaging technologies and personalized medicine approaches in glaucoma management will further contribute to market expansion in the coming years.
Glaucoma Surgery Industry: A Comprehensive Market Report (2019-2033)
This comprehensive report provides a detailed analysis of the Glaucoma Surgery Industry, encompassing market dynamics, growth trends, regional insights, product landscapes, and key players. The study period covers 2019-2033, with 2025 as the base and estimated year. This report is invaluable for ophthalmologists, medical device manufacturers, investors, and market researchers seeking a deep understanding of this rapidly evolving sector. The report segments the market by product (Glaucoma Drainage Device, Laser system, Punches, Probes, Other Products), surgery method (Traditional glaucoma surgery, Minimal invasive glaucoma surgery, Laser Surgery), and end-user (Hospitals, Ophthalmic Clinics, Other End Users). The parent market is the ophthalmic surgery market and the child market is glaucoma surgery.
Glaucoma Surgery Industry Market Dynamics & Structure
This section analyzes the market structure, focusing on market concentration, technological innovation drivers, regulatory frameworks, competitive product substitutes, end-user demographics, and M&A trends. The global glaucoma surgery market size in 2024 is estimated at xx Million, with a projected CAGR of xx% from 2025 to 2033.
- Market Concentration: The market exhibits a moderately concentrated structure, with key players holding significant market share. The top five companies account for approximately xx% of the global market.
- Technological Innovation: The industry is characterized by continuous technological advancements, driving the adoption of minimally invasive glaucoma surgery (MIGS) procedures and the development of sophisticated laser systems. Innovation barriers include high R&D costs and stringent regulatory approvals.
- Regulatory Frameworks: Stringent regulatory requirements in major markets influence product development and market entry strategies. Variations in regulatory landscapes across different regions create complexities for global players.
- Competitive Substitutes: Alternative glaucoma management strategies, including medication and lifestyle changes, create competitive pressure for surgical interventions.
- End-User Demographics: The aging global population, coupled with the rising prevalence of glaucoma, fuels the demand for glaucoma surgery. Hospitals and ophthalmic clinics represent the primary end-users.
- M&A Trends: The industry has witnessed a significant number of mergers and acquisitions (M&As) in recent years, with approximately xx deals recorded between 2019 and 2024, totaling an estimated value of xx Million. These transactions reflect strategic expansion and technology acquisition efforts.
Glaucoma Surgery Industry Growth Trends & Insights
This section delves into the market size evolution, adoption rates, technological disruptions, and consumer behavior shifts, utilizing a comprehensive data-driven approach. The glaucoma surgery market is expected to reach xx Million by 2033, driven by factors such as increased awareness, improved surgical techniques, and technological advancements.
The adoption of minimally invasive glaucoma surgery (MIGS) procedures has significantly increased, contributing to market growth. Technological advancements, such as the development of advanced laser systems and improved surgical instruments, have enhanced surgical outcomes and patient safety. Shifting consumer preferences towards less invasive procedures with shorter recovery times are also significant growth drivers. The rising prevalence of glaucoma, particularly in aging populations, is a primary factor contributing to market expansion.
Dominant Regions, Countries, or Segments in Glaucoma Surgery Industry
North America currently dominates the glaucoma surgery market, owing to factors such as high healthcare expenditure, technological advancements, and a well-established healthcare infrastructure. Europe and Asia-Pacific are also experiencing significant growth, driven by rising glaucoma prevalence and increased healthcare investment.
- Product Segments: The Glaucoma Drainage Device segment holds the largest market share due to its effectiveness in managing severe glaucoma cases. However, the Laser system segment is experiencing rapid growth, driven by its minimally invasive nature and improved precision.
- Surgery Methods: Minimal invasive glaucoma surgery (MIGS) is gaining significant traction, replacing traditional glaucoma surgeries due to improved safety and reduced recovery times.
- End-Users: Hospitals remain the dominant end-users due to their comprehensive infrastructure and availability of specialized surgical equipment. However, ophthalmic clinics are increasingly performing glaucoma surgeries.
Glaucoma Surgery Industry Product Landscape
The glaucoma surgery industry features a diverse range of products, including glaucoma drainage devices, laser systems, punches, probes, and other ancillary products. Recent innovations have focused on improving surgical precision, minimizing invasiveness, and enhancing patient outcomes. These advancements include smaller, more precisely engineered instruments, advanced laser systems offering greater accuracy and control, and new materials for implants that enhance biocompatibility and reduce complications. The development of novel minimally invasive procedures and smart surgical instruments are also driving product innovation.
Key Drivers, Barriers & Challenges in Glaucoma Surgery Industry
Key Drivers:
- Increasing prevalence of glaucoma, particularly among aging populations.
- Technological advancements in minimally invasive glaucoma surgery (MIGS) techniques and devices.
- Rising healthcare expenditure and improved access to healthcare services.
Challenges & Restraints:
- High cost of advanced surgical procedures and devices can limit accessibility, particularly in low- and middle-income countries.
- Stringent regulatory requirements and lengthy approval processes can slow down product launches and market entry.
- Intense competition among established players and emerging companies. The market share competition is expected to be high due to the presence of multiple players from different regions.
Emerging Opportunities in Glaucoma Surgery Industry
- Expansion into untapped markets in developing countries with significant glaucoma prevalence.
- Development of personalized treatment plans based on individual patient characteristics.
- Exploration of artificial intelligence (AI) and machine learning (ML) applications for improved surgical planning and precision.
Growth Accelerators in the Glaucoma Surgery Industry
Technological breakthroughs, particularly in MIGS and laser technology, are driving long-term growth. Strategic partnerships between medical device companies and healthcare providers will further enhance market expansion. The increasing focus on improving patient outcomes through minimally invasive techniques and enhanced surgical precision is key.
Key Players Shaping the Glaucoma Surgery Industry Market
- Ziemer Ophthalmic Systems
- Katalyst Surgical LLC
- Altomed
- Glaukos Corporation
- Nova Eye Medical
- Lumenis
- ASICO LLC
- Johnson and Johnson
- Allergan (an AbbVie company)
- Abbott Laboratories Inc
- Alcon
- Carl Zeiss Meditec
Notable Milestones in Glaucoma Surgery Industry Sector
- June 2022: AbbVie announced a USD 60 million acquisition of iSTAR Medical, accelerating minimally invasive glaucoma surgery technology development.
- June 2022: Iridex Corporation received NMPA approval for its Cyclo G6 platform in China, expanding its market reach.
In-Depth Glaucoma Surgery Industry Market Outlook
The glaucoma surgery market is poised for robust growth over the next decade. Continued technological advancements, rising glaucoma prevalence, and strategic investments will drive market expansion. Opportunities exist in developing minimally invasive solutions, expanding into emerging markets, and leveraging data analytics for improved patient care. The focus on personalized medicine and improved surgical precision will further shape the future of the industry.
Glaucoma Surgery Industry Segmentation
-
1. Product
- 1.1. Glaucoma Drainage Device
- 1.2. Laser system
- 1.3. Punches
- 1.4. Probes
- 1.5. Other Products
-
2. Surgery Method
- 2.1. Traditional glaucoma surgery
- 2.2. Minimal invasive glaucoma surgery
- 2.3. Laser Surgery
-
3. End User
- 3.1. Hospitals
- 3.2. Ophtalmic Clinics
- 3.3. Other End Users
Glaucoma Surgery Industry Segmentation By Geography
-
1. North America
- 1.1. United States
- 1.2. Canada
- 1.3. Mexico
-
2. Europe
- 2.1. Germany
- 2.2. United Kingdom
- 2.3. France
- 2.4. Italy
- 2.5. Spain
- 2.6. Rest of Europe
-
3. Asia Pacific
- 3.1. China
- 3.2. Japan
- 3.3. India
- 3.4. Australia
- 3.5. South Korea
- 3.6. Rest of Asia Pacific
-
4. Middle East and Africa
- 4.1. GCC
- 4.2. South Africa
- 4.3. Rest of Middle East and Africa
-
5. South America
- 5.1. Brazil
- 5.2. Argentina
- 5.3. Rest of South America
Glaucoma Surgery Industry REPORT HIGHLIGHTS
| Aspects | Details |
|---|---|
| Study Period | 2019-2033 |
| Base Year | 2024 |
| Estimated Year | 2025 |
| Forecast Period | 2025-2033 |
| Historical Period | 2019-2024 |
| Growth Rate | CAGR of 6.50% from 2019-2033 |
| Segmentation |
|
Table of Contents
- 1. Introduction
- 1.1. Research Scope
- 1.2. Market Segmentation
- 1.3. Research Methodology
- 1.4. Definitions and Assumptions
- 2. Executive Summary
- 2.1. Introduction
- 3. Market Dynamics
- 3.1. Introduction
- 3.2. Market Drivers
- 3.2.1. Rising Prevalence of Glaucoma; Increasing Geriatric Population; Growing Adoption of Surgical Treatments for Glaucoma
- 3.3. Market Restrains
- 3.3.1. Availability of Alternative Treatment Methods
- 3.4. Market Trends
- 3.4.1. Minimal Invasive Glaucoma Surgery is Expected to Witness Growth Over The Forecast Period
- 4. Market Factor Analysis
- 4.1. Porters Five Forces
- 4.2. Supply/Value Chain
- 4.3. PESTEL analysis
- 4.4. Market Entropy
- 4.5. Patent/Trademark Analysis
- 5. Global Glaucoma Surgery Industry Analysis, Insights and Forecast, 2019-2031
- 5.1. Market Analysis, Insights and Forecast - by Product
- 5.1.1. Glaucoma Drainage Device
- 5.1.2. Laser system
- 5.1.3. Punches
- 5.1.4. Probes
- 5.1.5. Other Products
- 5.2. Market Analysis, Insights and Forecast - by Surgery Method
- 5.2.1. Traditional glaucoma surgery
- 5.2.2. Minimal invasive glaucoma surgery
- 5.2.3. Laser Surgery
- 5.3. Market Analysis, Insights and Forecast - by End User
- 5.3.1. Hospitals
- 5.3.2. Ophtalmic Clinics
- 5.3.3. Other End Users
- 5.4. Market Analysis, Insights and Forecast - by Region
- 5.4.1. North America
- 5.4.2. Europe
- 5.4.3. Asia Pacific
- 5.4.4. Middle East and Africa
- 5.4.5. South America
- 5.1. Market Analysis, Insights and Forecast - by Product
- 6. North America Glaucoma Surgery Industry Analysis, Insights and Forecast, 2019-2031
- 6.1. Market Analysis, Insights and Forecast - by Product
- 6.1.1. Glaucoma Drainage Device
- 6.1.2. Laser system
- 6.1.3. Punches
- 6.1.4. Probes
- 6.1.5. Other Products
- 6.2. Market Analysis, Insights and Forecast - by Surgery Method
- 6.2.1. Traditional glaucoma surgery
- 6.2.2. Minimal invasive glaucoma surgery
- 6.2.3. Laser Surgery
- 6.3. Market Analysis, Insights and Forecast - by End User
- 6.3.1. Hospitals
- 6.3.2. Ophtalmic Clinics
- 6.3.3. Other End Users
- 6.1. Market Analysis, Insights and Forecast - by Product
- 7. Europe Glaucoma Surgery Industry Analysis, Insights and Forecast, 2019-2031
- 7.1. Market Analysis, Insights and Forecast - by Product
- 7.1.1. Glaucoma Drainage Device
- 7.1.2. Laser system
- 7.1.3. Punches
- 7.1.4. Probes
- 7.1.5. Other Products
- 7.2. Market Analysis, Insights and Forecast - by Surgery Method
- 7.2.1. Traditional glaucoma surgery
- 7.2.2. Minimal invasive glaucoma surgery
- 7.2.3. Laser Surgery
- 7.3. Market Analysis, Insights and Forecast - by End User
- 7.3.1. Hospitals
- 7.3.2. Ophtalmic Clinics
- 7.3.3. Other End Users
- 7.1. Market Analysis, Insights and Forecast - by Product
- 8. Asia Pacific Glaucoma Surgery Industry Analysis, Insights and Forecast, 2019-2031
- 8.1. Market Analysis, Insights and Forecast - by Product
- 8.1.1. Glaucoma Drainage Device
- 8.1.2. Laser system
- 8.1.3. Punches
- 8.1.4. Probes
- 8.1.5. Other Products
- 8.2. Market Analysis, Insights and Forecast - by Surgery Method
- 8.2.1. Traditional glaucoma surgery
- 8.2.2. Minimal invasive glaucoma surgery
- 8.2.3. Laser Surgery
- 8.3. Market Analysis, Insights and Forecast - by End User
- 8.3.1. Hospitals
- 8.3.2. Ophtalmic Clinics
- 8.3.3. Other End Users
- 8.1. Market Analysis, Insights and Forecast - by Product
- 9. Middle East and Africa Glaucoma Surgery Industry Analysis, Insights and Forecast, 2019-2031
- 9.1. Market Analysis, Insights and Forecast - by Product
- 9.1.1. Glaucoma Drainage Device
- 9.1.2. Laser system
- 9.1.3. Punches
- 9.1.4. Probes
- 9.1.5. Other Products
- 9.2. Market Analysis, Insights and Forecast - by Surgery Method
- 9.2.1. Traditional glaucoma surgery
- 9.2.2. Minimal invasive glaucoma surgery
- 9.2.3. Laser Surgery
- 9.3. Market Analysis, Insights and Forecast - by End User
- 9.3.1. Hospitals
- 9.3.2. Ophtalmic Clinics
- 9.3.3. Other End Users
- 9.1. Market Analysis, Insights and Forecast - by Product
- 10. South America Glaucoma Surgery Industry Analysis, Insights and Forecast, 2019-2031
- 10.1. Market Analysis, Insights and Forecast - by Product
- 10.1.1. Glaucoma Drainage Device
- 10.1.2. Laser system
- 10.1.3. Punches
- 10.1.4. Probes
- 10.1.5. Other Products
- 10.2. Market Analysis, Insights and Forecast - by Surgery Method
- 10.2.1. Traditional glaucoma surgery
- 10.2.2. Minimal invasive glaucoma surgery
- 10.2.3. Laser Surgery
- 10.3. Market Analysis, Insights and Forecast - by End User
- 10.3.1. Hospitals
- 10.3.2. Ophtalmic Clinics
- 10.3.3. Other End Users
- 10.1. Market Analysis, Insights and Forecast - by Product
- 11. North America Glaucoma Surgery Industry Analysis, Insights and Forecast, 2019-2031
- 11.1. Market Analysis, Insights and Forecast - By Country/Sub-region
- 11.1.1. undefined
- 12. Europe Glaucoma Surgery Industry Analysis, Insights and Forecast, 2019-2031
- 12.1. Market Analysis, Insights and Forecast - By Country/Sub-region
- 12.1.1. undefined
- 13. Asia Pacific Glaucoma Surgery Industry Analysis, Insights and Forecast, 2019-2031
- 13.1. Market Analysis, Insights and Forecast - By Country/Sub-region
- 13.1.1. undefined
- 14. Middle East and Africa Glaucoma Surgery Industry Analysis, Insights and Forecast, 2019-2031
- 14.1. Market Analysis, Insights and Forecast - By Country/Sub-region
- 14.1.1. undefined
- 15. South America Glaucoma Surgery Industry Analysis, Insights and Forecast, 2019-2031
- 15.1. Market Analysis, Insights and Forecast - By Country/Sub-region
- 15.1.1. undefined
- 16. Competitive Analysis
- 16.1. Global Market Share Analysis 2024
- 16.2. Company Profiles
- 16.2.1 Ziemer Ophthalmic Systems
- 16.2.1.1. Overview
- 16.2.1.2. Products
- 16.2.1.3. SWOT Analysis
- 16.2.1.4. Recent Developments
- 16.2.1.5. Financials (Based on Availability)
- 16.2.2 Katalyst Surgical LLC
- 16.2.2.1. Overview
- 16.2.2.2. Products
- 16.2.2.3. SWOT Analysis
- 16.2.2.4. Recent Developments
- 16.2.2.5. Financials (Based on Availability)
- 16.2.3 Altomed
- 16.2.3.1. Overview
- 16.2.3.2. Products
- 16.2.3.3. SWOT Analysis
- 16.2.3.4. Recent Developments
- 16.2.3.5. Financials (Based on Availability)
- 16.2.4 Glaukos Corporation
- 16.2.4.1. Overview
- 16.2.4.2. Products
- 16.2.4.3. SWOT Analysis
- 16.2.4.4. Recent Developments
- 16.2.4.5. Financials (Based on Availability)
- 16.2.5 Nova Eye Medical
- 16.2.5.1. Overview
- 16.2.5.2. Products
- 16.2.5.3. SWOT Analysis
- 16.2.5.4. Recent Developments
- 16.2.5.5. Financials (Based on Availability)
- 16.2.6 Lumenis
- 16.2.6.1. Overview
- 16.2.6.2. Products
- 16.2.6.3. SWOT Analysis
- 16.2.6.4. Recent Developments
- 16.2.6.5. Financials (Based on Availability)
- 16.2.7 ASICO LLC
- 16.2.7.1. Overview
- 16.2.7.2. Products
- 16.2.7.3. SWOT Analysis
- 16.2.7.4. Recent Developments
- 16.2.7.5. Financials (Based on Availability)
- 16.2.8 Johnson and Johnson
- 16.2.8.1. Overview
- 16.2.8.2. Products
- 16.2.8.3. SWOT Analysis
- 16.2.8.4. Recent Developments
- 16.2.8.5. Financials (Based on Availability)
- 16.2.9 Allergan
- 16.2.9.1. Overview
- 16.2.9.2. Products
- 16.2.9.3. SWOT Analysis
- 16.2.9.4. Recent Developments
- 16.2.9.5. Financials (Based on Availability)
- 16.2.10 Abbott Laboratories Inc
- 16.2.10.1. Overview
- 16.2.10.2. Products
- 16.2.10.3. SWOT Analysis
- 16.2.10.4. Recent Developments
- 16.2.10.5. Financials (Based on Availability)
- 16.2.11 Alcon
- 16.2.11.1. Overview
- 16.2.11.2. Products
- 16.2.11.3. SWOT Analysis
- 16.2.11.4. Recent Developments
- 16.2.11.5. Financials (Based on Availability)
- 16.2.12 Carl Zeiss Meditec
- 16.2.12.1. Overview
- 16.2.12.2. Products
- 16.2.12.3. SWOT Analysis
- 16.2.12.4. Recent Developments
- 16.2.12.5. Financials (Based on Availability)
- 16.2.1 Ziemer Ophthalmic Systems
List of Figures
- Figure 1: Global Glaucoma Surgery Industry Revenue Breakdown (Million, %) by Region 2024 & 2032
- Figure 2: Global Glaucoma Surgery Industry Volume Breakdown (K Unit, %) by Region 2024 & 2032
- Figure 3: North America Glaucoma Surgery Industry Revenue (Million), by Country 2024 & 2032
- Figure 4: North America Glaucoma Surgery Industry Volume (K Unit), by Country 2024 & 2032
- Figure 5: North America Glaucoma Surgery Industry Revenue Share (%), by Country 2024 & 2032
- Figure 6: North America Glaucoma Surgery Industry Volume Share (%), by Country 2024 & 2032
- Figure 7: Europe Glaucoma Surgery Industry Revenue (Million), by Country 2024 & 2032
- Figure 8: Europe Glaucoma Surgery Industry Volume (K Unit), by Country 2024 & 2032
- Figure 9: Europe Glaucoma Surgery Industry Revenue Share (%), by Country 2024 & 2032
- Figure 10: Europe Glaucoma Surgery Industry Volume Share (%), by Country 2024 & 2032
- Figure 11: Asia Pacific Glaucoma Surgery Industry Revenue (Million), by Country 2024 & 2032
- Figure 12: Asia Pacific Glaucoma Surgery Industry Volume (K Unit), by Country 2024 & 2032
- Figure 13: Asia Pacific Glaucoma Surgery Industry Revenue Share (%), by Country 2024 & 2032
- Figure 14: Asia Pacific Glaucoma Surgery Industry Volume Share (%), by Country 2024 & 2032
- Figure 15: Middle East and Africa Glaucoma Surgery Industry Revenue (Million), by Country 2024 & 2032
- Figure 16: Middle East and Africa Glaucoma Surgery Industry Volume (K Unit), by Country 2024 & 2032
- Figure 17: Middle East and Africa Glaucoma Surgery Industry Revenue Share (%), by Country 2024 & 2032
- Figure 18: Middle East and Africa Glaucoma Surgery Industry Volume Share (%), by Country 2024 & 2032
- Figure 19: South America Glaucoma Surgery Industry Revenue (Million), by Country 2024 & 2032
- Figure 20: South America Glaucoma Surgery Industry Volume (K Unit), by Country 2024 & 2032
- Figure 21: South America Glaucoma Surgery Industry Revenue Share (%), by Country 2024 & 2032
- Figure 22: South America Glaucoma Surgery Industry Volume Share (%), by Country 2024 & 2032
- Figure 23: North America Glaucoma Surgery Industry Revenue (Million), by Product 2024 & 2032
- Figure 24: North America Glaucoma Surgery Industry Volume (K Unit), by Product 2024 & 2032
- Figure 25: North America Glaucoma Surgery Industry Revenue Share (%), by Product 2024 & 2032
- Figure 26: North America Glaucoma Surgery Industry Volume Share (%), by Product 2024 & 2032
- Figure 27: North America Glaucoma Surgery Industry Revenue (Million), by Surgery Method 2024 & 2032
- Figure 28: North America Glaucoma Surgery Industry Volume (K Unit), by Surgery Method 2024 & 2032
- Figure 29: North America Glaucoma Surgery Industry Revenue Share (%), by Surgery Method 2024 & 2032
- Figure 30: North America Glaucoma Surgery Industry Volume Share (%), by Surgery Method 2024 & 2032
- Figure 31: North America Glaucoma Surgery Industry Revenue (Million), by End User 2024 & 2032
- Figure 32: North America Glaucoma Surgery Industry Volume (K Unit), by End User 2024 & 2032
- Figure 33: North America Glaucoma Surgery Industry Revenue Share (%), by End User 2024 & 2032
- Figure 34: North America Glaucoma Surgery Industry Volume Share (%), by End User 2024 & 2032
- Figure 35: North America Glaucoma Surgery Industry Revenue (Million), by Country 2024 & 2032
- Figure 36: North America Glaucoma Surgery Industry Volume (K Unit), by Country 2024 & 2032
- Figure 37: North America Glaucoma Surgery Industry Revenue Share (%), by Country 2024 & 2032
- Figure 38: North America Glaucoma Surgery Industry Volume Share (%), by Country 2024 & 2032
- Figure 39: Europe Glaucoma Surgery Industry Revenue (Million), by Product 2024 & 2032
- Figure 40: Europe Glaucoma Surgery Industry Volume (K Unit), by Product 2024 & 2032
- Figure 41: Europe Glaucoma Surgery Industry Revenue Share (%), by Product 2024 & 2032
- Figure 42: Europe Glaucoma Surgery Industry Volume Share (%), by Product 2024 & 2032
- Figure 43: Europe Glaucoma Surgery Industry Revenue (Million), by Surgery Method 2024 & 2032
- Figure 44: Europe Glaucoma Surgery Industry Volume (K Unit), by Surgery Method 2024 & 2032
- Figure 45: Europe Glaucoma Surgery Industry Revenue Share (%), by Surgery Method 2024 & 2032
- Figure 46: Europe Glaucoma Surgery Industry Volume Share (%), by Surgery Method 2024 & 2032
- Figure 47: Europe Glaucoma Surgery Industry Revenue (Million), by End User 2024 & 2032
- Figure 48: Europe Glaucoma Surgery Industry Volume (K Unit), by End User 2024 & 2032
- Figure 49: Europe Glaucoma Surgery Industry Revenue Share (%), by End User 2024 & 2032
- Figure 50: Europe Glaucoma Surgery Industry Volume Share (%), by End User 2024 & 2032
- Figure 51: Europe Glaucoma Surgery Industry Revenue (Million), by Country 2024 & 2032
- Figure 52: Europe Glaucoma Surgery Industry Volume (K Unit), by Country 2024 & 2032
- Figure 53: Europe Glaucoma Surgery Industry Revenue Share (%), by Country 2024 & 2032
- Figure 54: Europe Glaucoma Surgery Industry Volume Share (%), by Country 2024 & 2032
- Figure 55: Asia Pacific Glaucoma Surgery Industry Revenue (Million), by Product 2024 & 2032
- Figure 56: Asia Pacific Glaucoma Surgery Industry Volume (K Unit), by Product 2024 & 2032
- Figure 57: Asia Pacific Glaucoma Surgery Industry Revenue Share (%), by Product 2024 & 2032
- Figure 58: Asia Pacific Glaucoma Surgery Industry Volume Share (%), by Product 2024 & 2032
- Figure 59: Asia Pacific Glaucoma Surgery Industry Revenue (Million), by Surgery Method 2024 & 2032
- Figure 60: Asia Pacific Glaucoma Surgery Industry Volume (K Unit), by Surgery Method 2024 & 2032
- Figure 61: Asia Pacific Glaucoma Surgery Industry Revenue Share (%), by Surgery Method 2024 & 2032
- Figure 62: Asia Pacific Glaucoma Surgery Industry Volume Share (%), by Surgery Method 2024 & 2032
- Figure 63: Asia Pacific Glaucoma Surgery Industry Revenue (Million), by End User 2024 & 2032
- Figure 64: Asia Pacific Glaucoma Surgery Industry Volume (K Unit), by End User 2024 & 2032
- Figure 65: Asia Pacific Glaucoma Surgery Industry Revenue Share (%), by End User 2024 & 2032
- Figure 66: Asia Pacific Glaucoma Surgery Industry Volume Share (%), by End User 2024 & 2032
- Figure 67: Asia Pacific Glaucoma Surgery Industry Revenue (Million), by Country 2024 & 2032
- Figure 68: Asia Pacific Glaucoma Surgery Industry Volume (K Unit), by Country 2024 & 2032
- Figure 69: Asia Pacific Glaucoma Surgery Industry Revenue Share (%), by Country 2024 & 2032
- Figure 70: Asia Pacific Glaucoma Surgery Industry Volume Share (%), by Country 2024 & 2032
- Figure 71: Middle East and Africa Glaucoma Surgery Industry Revenue (Million), by Product 2024 & 2032
- Figure 72: Middle East and Africa Glaucoma Surgery Industry Volume (K Unit), by Product 2024 & 2032
- Figure 73: Middle East and Africa Glaucoma Surgery Industry Revenue Share (%), by Product 2024 & 2032
- Figure 74: Middle East and Africa Glaucoma Surgery Industry Volume Share (%), by Product 2024 & 2032
- Figure 75: Middle East and Africa Glaucoma Surgery Industry Revenue (Million), by Surgery Method 2024 & 2032
- Figure 76: Middle East and Africa Glaucoma Surgery Industry Volume (K Unit), by Surgery Method 2024 & 2032
- Figure 77: Middle East and Africa Glaucoma Surgery Industry Revenue Share (%), by Surgery Method 2024 & 2032
- Figure 78: Middle East and Africa Glaucoma Surgery Industry Volume Share (%), by Surgery Method 2024 & 2032
- Figure 79: Middle East and Africa Glaucoma Surgery Industry Revenue (Million), by End User 2024 & 2032
- Figure 80: Middle East and Africa Glaucoma Surgery Industry Volume (K Unit), by End User 2024 & 2032
- Figure 81: Middle East and Africa Glaucoma Surgery Industry Revenue Share (%), by End User 2024 & 2032
- Figure 82: Middle East and Africa Glaucoma Surgery Industry Volume Share (%), by End User 2024 & 2032
- Figure 83: Middle East and Africa Glaucoma Surgery Industry Revenue (Million), by Country 2024 & 2032
- Figure 84: Middle East and Africa Glaucoma Surgery Industry Volume (K Unit), by Country 2024 & 2032
- Figure 85: Middle East and Africa Glaucoma Surgery Industry Revenue Share (%), by Country 2024 & 2032
- Figure 86: Middle East and Africa Glaucoma Surgery Industry Volume Share (%), by Country 2024 & 2032
- Figure 87: South America Glaucoma Surgery Industry Revenue (Million), by Product 2024 & 2032
- Figure 88: South America Glaucoma Surgery Industry Volume (K Unit), by Product 2024 & 2032
- Figure 89: South America Glaucoma Surgery Industry Revenue Share (%), by Product 2024 & 2032
- Figure 90: South America Glaucoma Surgery Industry Volume Share (%), by Product 2024 & 2032
- Figure 91: South America Glaucoma Surgery Industry Revenue (Million), by Surgery Method 2024 & 2032
- Figure 92: South America Glaucoma Surgery Industry Volume (K Unit), by Surgery Method 2024 & 2032
- Figure 93: South America Glaucoma Surgery Industry Revenue Share (%), by Surgery Method 2024 & 2032
- Figure 94: South America Glaucoma Surgery Industry Volume Share (%), by Surgery Method 2024 & 2032
- Figure 95: South America Glaucoma Surgery Industry Revenue (Million), by End User 2024 & 2032
- Figure 96: South America Glaucoma Surgery Industry Volume (K Unit), by End User 2024 & 2032
- Figure 97: South America Glaucoma Surgery Industry Revenue Share (%), by End User 2024 & 2032
- Figure 98: South America Glaucoma Surgery Industry Volume Share (%), by End User 2024 & 2032
- Figure 99: South America Glaucoma Surgery Industry Revenue (Million), by Country 2024 & 2032
- Figure 100: South America Glaucoma Surgery Industry Volume (K Unit), by Country 2024 & 2032
- Figure 101: South America Glaucoma Surgery Industry Revenue Share (%), by Country 2024 & 2032
- Figure 102: South America Glaucoma Surgery Industry Volume Share (%), by Country 2024 & 2032
List of Tables
- Table 1: Global Glaucoma Surgery Industry Revenue Million Forecast, by Region 2019 & 2032
- Table 2: Global Glaucoma Surgery Industry Volume K Unit Forecast, by Region 2019 & 2032
- Table 3: Global Glaucoma Surgery Industry Revenue Million Forecast, by Product 2019 & 2032
- Table 4: Global Glaucoma Surgery Industry Volume K Unit Forecast, by Product 2019 & 2032
- Table 5: Global Glaucoma Surgery Industry Revenue Million Forecast, by Surgery Method 2019 & 2032
- Table 6: Global Glaucoma Surgery Industry Volume K Unit Forecast, by Surgery Method 2019 & 2032
- Table 7: Global Glaucoma Surgery Industry Revenue Million Forecast, by End User 2019 & 2032
- Table 8: Global Glaucoma Surgery Industry Volume K Unit Forecast, by End User 2019 & 2032
- Table 9: Global Glaucoma Surgery Industry Revenue Million Forecast, by Region 2019 & 2032
- Table 10: Global Glaucoma Surgery Industry Volume K Unit Forecast, by Region 2019 & 2032
- Table 11: Global Glaucoma Surgery Industry Revenue Million Forecast, by Country 2019 & 2032
- Table 12: Global Glaucoma Surgery Industry Volume K Unit Forecast, by Country 2019 & 2032
- Table 13: Global Glaucoma Surgery Industry Revenue Million Forecast, by Country 2019 & 2032
- Table 14: Global Glaucoma Surgery Industry Volume K Unit Forecast, by Country 2019 & 2032
- Table 15: Global Glaucoma Surgery Industry Revenue Million Forecast, by Country 2019 & 2032
- Table 16: Global Glaucoma Surgery Industry Volume K Unit Forecast, by Country 2019 & 2032
- Table 17: Global Glaucoma Surgery Industry Revenue Million Forecast, by Country 2019 & 2032
- Table 18: Global Glaucoma Surgery Industry Volume K Unit Forecast, by Country 2019 & 2032
- Table 19: Global Glaucoma Surgery Industry Revenue Million Forecast, by Country 2019 & 2032
- Table 20: Global Glaucoma Surgery Industry Volume K Unit Forecast, by Country 2019 & 2032
- Table 21: Global Glaucoma Surgery Industry Revenue Million Forecast, by Product 2019 & 2032
- Table 22: Global Glaucoma Surgery Industry Volume K Unit Forecast, by Product 2019 & 2032
- Table 23: Global Glaucoma Surgery Industry Revenue Million Forecast, by Surgery Method 2019 & 2032
- Table 24: Global Glaucoma Surgery Industry Volume K Unit Forecast, by Surgery Method 2019 & 2032
- Table 25: Global Glaucoma Surgery Industry Revenue Million Forecast, by End User 2019 & 2032
- Table 26: Global Glaucoma Surgery Industry Volume K Unit Forecast, by End User 2019 & 2032
- Table 27: Global Glaucoma Surgery Industry Revenue Million Forecast, by Country 2019 & 2032
- Table 28: Global Glaucoma Surgery Industry Volume K Unit Forecast, by Country 2019 & 2032
- Table 29: United States Glaucoma Surgery Industry Revenue (Million) Forecast, by Application 2019 & 2032
- Table 30: United States Glaucoma Surgery Industry Volume (K Unit) Forecast, by Application 2019 & 2032
- Table 31: Canada Glaucoma Surgery Industry Revenue (Million) Forecast, by Application 2019 & 2032
- Table 32: Canada Glaucoma Surgery Industry Volume (K Unit) Forecast, by Application 2019 & 2032
- Table 33: Mexico Glaucoma Surgery Industry Revenue (Million) Forecast, by Application 2019 & 2032
- Table 34: Mexico Glaucoma Surgery Industry Volume (K Unit) Forecast, by Application 2019 & 2032
- Table 35: Global Glaucoma Surgery Industry Revenue Million Forecast, by Product 2019 & 2032
- Table 36: Global Glaucoma Surgery Industry Volume K Unit Forecast, by Product 2019 & 2032
- Table 37: Global Glaucoma Surgery Industry Revenue Million Forecast, by Surgery Method 2019 & 2032
- Table 38: Global Glaucoma Surgery Industry Volume K Unit Forecast, by Surgery Method 2019 & 2032
- Table 39: Global Glaucoma Surgery Industry Revenue Million Forecast, by End User 2019 & 2032
- Table 40: Global Glaucoma Surgery Industry Volume K Unit Forecast, by End User 2019 & 2032
- Table 41: Global Glaucoma Surgery Industry Revenue Million Forecast, by Country 2019 & 2032
- Table 42: Global Glaucoma Surgery Industry Volume K Unit Forecast, by Country 2019 & 2032
- Table 43: Germany Glaucoma Surgery Industry Revenue (Million) Forecast, by Application 2019 & 2032
- Table 44: Germany Glaucoma Surgery Industry Volume (K Unit) Forecast, by Application 2019 & 2032
- Table 45: United Kingdom Glaucoma Surgery Industry Revenue (Million) Forecast, by Application 2019 & 2032
- Table 46: United Kingdom Glaucoma Surgery Industry Volume (K Unit) Forecast, by Application 2019 & 2032
- Table 47: France Glaucoma Surgery Industry Revenue (Million) Forecast, by Application 2019 & 2032
- Table 48: France Glaucoma Surgery Industry Volume (K Unit) Forecast, by Application 2019 & 2032
- Table 49: Italy Glaucoma Surgery Industry Revenue (Million) Forecast, by Application 2019 & 2032
- Table 50: Italy Glaucoma Surgery Industry Volume (K Unit) Forecast, by Application 2019 & 2032
- Table 51: Spain Glaucoma Surgery Industry Revenue (Million) Forecast, by Application 2019 & 2032
- Table 52: Spain Glaucoma Surgery Industry Volume (K Unit) Forecast, by Application 2019 & 2032
- Table 53: Rest of Europe Glaucoma Surgery Industry Revenue (Million) Forecast, by Application 2019 & 2032
- Table 54: Rest of Europe Glaucoma Surgery Industry Volume (K Unit) Forecast, by Application 2019 & 2032
- Table 55: Global Glaucoma Surgery Industry Revenue Million Forecast, by Product 2019 & 2032
- Table 56: Global Glaucoma Surgery Industry Volume K Unit Forecast, by Product 2019 & 2032
- Table 57: Global Glaucoma Surgery Industry Revenue Million Forecast, by Surgery Method 2019 & 2032
- Table 58: Global Glaucoma Surgery Industry Volume K Unit Forecast, by Surgery Method 2019 & 2032
- Table 59: Global Glaucoma Surgery Industry Revenue Million Forecast, by End User 2019 & 2032
- Table 60: Global Glaucoma Surgery Industry Volume K Unit Forecast, by End User 2019 & 2032
- Table 61: Global Glaucoma Surgery Industry Revenue Million Forecast, by Country 2019 & 2032
- Table 62: Global Glaucoma Surgery Industry Volume K Unit Forecast, by Country 2019 & 2032
- Table 63: China Glaucoma Surgery Industry Revenue (Million) Forecast, by Application 2019 & 2032
- Table 64: China Glaucoma Surgery Industry Volume (K Unit) Forecast, by Application 2019 & 2032
- Table 65: Japan Glaucoma Surgery Industry Revenue (Million) Forecast, by Application 2019 & 2032
- Table 66: Japan Glaucoma Surgery Industry Volume (K Unit) Forecast, by Application 2019 & 2032
- Table 67: India Glaucoma Surgery Industry Revenue (Million) Forecast, by Application 2019 & 2032
- Table 68: India Glaucoma Surgery Industry Volume (K Unit) Forecast, by Application 2019 & 2032
- Table 69: Australia Glaucoma Surgery Industry Revenue (Million) Forecast, by Application 2019 & 2032
- Table 70: Australia Glaucoma Surgery Industry Volume (K Unit) Forecast, by Application 2019 & 2032
- Table 71: South Korea Glaucoma Surgery Industry Revenue (Million) Forecast, by Application 2019 & 2032
- Table 72: South Korea Glaucoma Surgery Industry Volume (K Unit) Forecast, by Application 2019 & 2032
- Table 73: Rest of Asia Pacific Glaucoma Surgery Industry Revenue (Million) Forecast, by Application 2019 & 2032
- Table 74: Rest of Asia Pacific Glaucoma Surgery Industry Volume (K Unit) Forecast, by Application 2019 & 2032
- Table 75: Global Glaucoma Surgery Industry Revenue Million Forecast, by Product 2019 & 2032
- Table 76: Global Glaucoma Surgery Industry Volume K Unit Forecast, by Product 2019 & 2032
- Table 77: Global Glaucoma Surgery Industry Revenue Million Forecast, by Surgery Method 2019 & 2032
- Table 78: Global Glaucoma Surgery Industry Volume K Unit Forecast, by Surgery Method 2019 & 2032
- Table 79: Global Glaucoma Surgery Industry Revenue Million Forecast, by End User 2019 & 2032
- Table 80: Global Glaucoma Surgery Industry Volume K Unit Forecast, by End User 2019 & 2032
- Table 81: Global Glaucoma Surgery Industry Revenue Million Forecast, by Country 2019 & 2032
- Table 82: Global Glaucoma Surgery Industry Volume K Unit Forecast, by Country 2019 & 2032
- Table 83: GCC Glaucoma Surgery Industry Revenue (Million) Forecast, by Application 2019 & 2032
- Table 84: GCC Glaucoma Surgery Industry Volume (K Unit) Forecast, by Application 2019 & 2032
- Table 85: South Africa Glaucoma Surgery Industry Revenue (Million) Forecast, by Application 2019 & 2032
- Table 86: South Africa Glaucoma Surgery Industry Volume (K Unit) Forecast, by Application 2019 & 2032
- Table 87: Rest of Middle East and Africa Glaucoma Surgery Industry Revenue (Million) Forecast, by Application 2019 & 2032
- Table 88: Rest of Middle East and Africa Glaucoma Surgery Industry Volume (K Unit) Forecast, by Application 2019 & 2032
- Table 89: Global Glaucoma Surgery Industry Revenue Million Forecast, by Product 2019 & 2032
- Table 90: Global Glaucoma Surgery Industry Volume K Unit Forecast, by Product 2019 & 2032
- Table 91: Global Glaucoma Surgery Industry Revenue Million Forecast, by Surgery Method 2019 & 2032
- Table 92: Global Glaucoma Surgery Industry Volume K Unit Forecast, by Surgery Method 2019 & 2032
- Table 93: Global Glaucoma Surgery Industry Revenue Million Forecast, by End User 2019 & 2032
- Table 94: Global Glaucoma Surgery Industry Volume K Unit Forecast, by End User 2019 & 2032
- Table 95: Global Glaucoma Surgery Industry Revenue Million Forecast, by Country 2019 & 2032
- Table 96: Global Glaucoma Surgery Industry Volume K Unit Forecast, by Country 2019 & 2032
- Table 97: Brazil Glaucoma Surgery Industry Revenue (Million) Forecast, by Application 2019 & 2032
- Table 98: Brazil Glaucoma Surgery Industry Volume (K Unit) Forecast, by Application 2019 & 2032
- Table 99: Argentina Glaucoma Surgery Industry Revenue (Million) Forecast, by Application 2019 & 2032
- Table 100: Argentina Glaucoma Surgery Industry Volume (K Unit) Forecast, by Application 2019 & 2032
- Table 101: Rest of South America Glaucoma Surgery Industry Revenue (Million) Forecast, by Application 2019 & 2032
- Table 102: Rest of South America Glaucoma Surgery Industry Volume (K Unit) Forecast, by Application 2019 & 2032
Frequently Asked Questions
1. What is the projected Compound Annual Growth Rate (CAGR) of the Glaucoma Surgery Industry?
The projected CAGR is approximately 6.50%.
2. Which companies are prominent players in the Glaucoma Surgery Industry?
Key companies in the market include Ziemer Ophthalmic Systems, Katalyst Surgical LLC, Altomed, Glaukos Corporation, Nova Eye Medical, Lumenis, ASICO LLC, Johnson and Johnson, Allergan, Abbott Laboratories Inc, Alcon, Carl Zeiss Meditec.
3. What are the main segments of the Glaucoma Surgery Industry?
The market segments include Product, Surgery Method, End User.
4. Can you provide details about the market size?
The market size is estimated to be USD XX Million as of 2022.
5. What are some drivers contributing to market growth?
Rising Prevalence of Glaucoma; Increasing Geriatric Population; Growing Adoption of Surgical Treatments for Glaucoma.
6. What are the notable trends driving market growth?
Minimal Invasive Glaucoma Surgery is Expected to Witness Growth Over The Forecast Period.
7. Are there any restraints impacting market growth?
Availability of Alternative Treatment Methods.
8. Can you provide examples of recent developments in the market?
June 2022: AbbVie announced it would pay USD 60 million for the rights to acquire iSTAR Medical, a Belgian company developing a minimally invasive glaucoma implantable surgery device. In order to market the device in the United States, iSTAR is now enrolling in a premarket approval study. AbbVie is assisting in developing and commercializing the MINIject device until this study is completed.
9. What pricing options are available for accessing the report?
Pricing options include single-user, multi-user, and enterprise licenses priced at USD 4750, USD 5250, and USD 8750 respectively.
10. Is the market size provided in terms of value or volume?
The market size is provided in terms of value, measured in Million and volume, measured in K Unit.
11. Are there any specific market keywords associated with the report?
Yes, the market keyword associated with the report is "Glaucoma Surgery Industry," which aids in identifying and referencing the specific market segment covered.
12. How do I determine which pricing option suits my needs best?
The pricing options vary based on user requirements and access needs. Individual users may opt for single-user licenses, while businesses requiring broader access may choose multi-user or enterprise licenses for cost-effective access to the report.
13. Are there any additional resources or data provided in the Glaucoma Surgery Industry report?
While the report offers comprehensive insights, it's advisable to review the specific contents or supplementary materials provided to ascertain if additional resources or data are available.
14. How can I stay updated on further developments or reports in the Glaucoma Surgery Industry?
To stay informed about further developments, trends, and reports in the Glaucoma Surgery Industry, consider subscribing to industry newsletters, following relevant companies and organizations, or regularly checking reputable industry news sources and publications.
Methodology
Step 1 - Identification of Relevant Samples Size from Population Database


Step 2 - Approaches for Defining Global Market Size (Value, Volume* & Price*)

Note*: In applicable scenarios
Step 3 - Data Sources
Primary Research
- Web Analytics
- Survey Reports
- Research Institute
- Latest Research Reports
- Opinion Leaders
Secondary Research
- Annual Reports
- White Paper
- Latest Press Release
- Industry Association
- Paid Database
- Investor Presentations

Step 4 - Data Triangulation
Involves using different sources of information in order to increase the validity of a study
These sources are likely to be stakeholders in a program - participants, other researchers, program staff, other community members, and so on.
Then we put all data in single framework & apply various statistical tools to find out the dynamic on the market.
During the analysis stage, feedback from the stakeholder groups would be compared to determine areas of agreement as well as areas of divergence


