
Key Insights
The global gene delivery system market is experiencing robust growth, driven by the increasing prevalence of chronic diseases like cancer, cardiovascular disorders, and infectious diseases, coupled with escalating demand for advanced therapeutic modalities. The market's 7.30% CAGR signifies substantial investment in research and development of novel gene therapies, fueling innovation across various delivery systems. Viral vectors, particularly adeno-associated viruses (AAVs) and lentiviruses, dominate the market due to their high transfection efficiency, while non-viral methods like liposomes and nanoparticles are gaining traction due to their inherent safety advantages and lower manufacturing costs. The oncology segment commands a significant market share, reflecting the intensive efforts to develop effective gene therapies for cancer treatment, including gene editing and immunotherapy approaches. The injectable route of administration currently holds the largest share, but oral and nasal delivery methods are emerging as promising areas of focus for improved patient compliance and reduced invasiveness. Competition among established pharmaceutical giants and emerging biotech companies is intense, driving innovation and fostering the development of more efficient and safer gene delivery systems. Geographical distribution shows strong growth in North America and Europe, driven by robust regulatory frameworks and significant investment in research and development; however, Asia Pacific is emerging as a rapidly expanding market due to increasing healthcare expenditure and growing awareness of advanced therapies.
The forecast period (2025-2033) anticipates further market expansion, fueled by ongoing clinical trials and approvals of novel gene therapies. Technological advancements, particularly in targeted delivery systems and personalized medicine, will play a significant role in shaping the market landscape. However, challenges remain, including the high cost of gene therapies, regulatory hurdles, and potential safety concerns associated with certain delivery methods. Addressing these challenges through collaborative efforts between researchers, regulatory agencies, and industry players is crucial to unlocking the full therapeutic potential of gene delivery systems and ensuring broad patient access to these life-changing therapies. The continuous refinement of existing technologies and the emergence of innovative approaches will further propel market growth in the coming years.
Gene Delivery System Industry: A Comprehensive Market Report (2019-2033)
This comprehensive report provides a detailed analysis of the Gene Delivery System industry, encompassing market dynamics, growth trends, dominant segments, key players, and future outlook. The study period covers 2019-2033, with 2025 as the base and estimated year. The report segments the market by delivery systems (viral, non-viral, hybrid), application (oncology, infectious diseases, etc.), and route of administration (oral, injectable, etc.), offering a granular understanding of this rapidly evolving field. The market is valued at xx Million units in 2025 and is projected to reach xx Million units by 2033.
Gene Delivery System Industry Market Dynamics & Structure
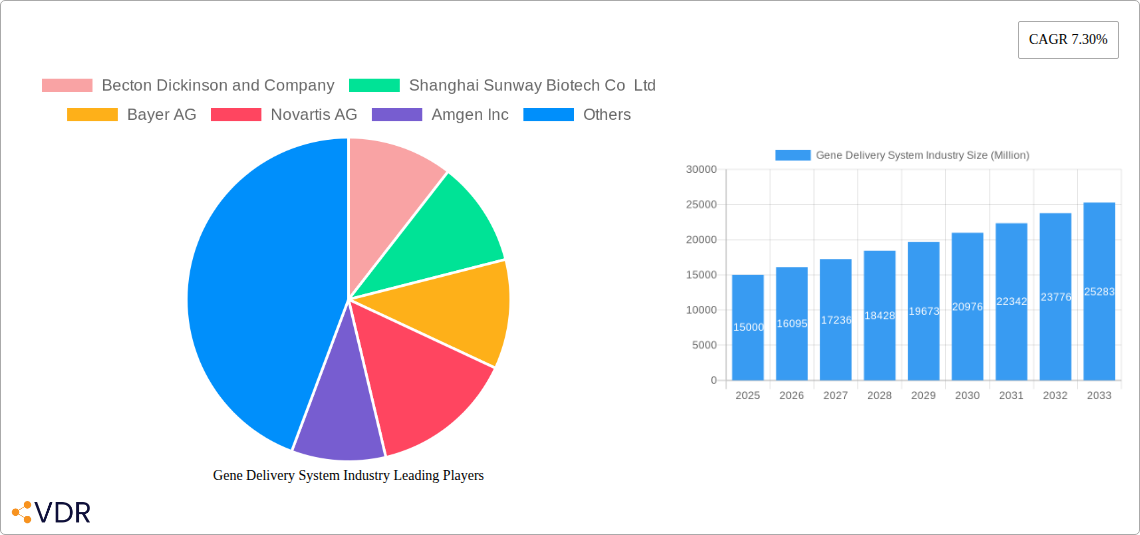
The gene delivery system market is characterized by a moderately concentrated landscape, with key players like Becton Dickinson and Company, Bayer AG, Novartis AG, and Pfizer Inc. holding significant market share. However, the emergence of innovative biotech firms and strategic partnerships is fostering competition. Technological advancements, particularly in CRISPR-Cas9 gene editing and novel viral vector engineering, are major drivers of market growth. Stringent regulatory frameworks and ethical considerations pose challenges, while the increasing prevalence of genetic disorders and the rising success of gene therapies fuel demand. Mergers and acquisitions (M&A) are frequent, reflecting the industry's dynamic nature. For instance, the number of M&A deals in the sector between 2021-2023 totaled approximately xx, representing a xx% increase compared to the previous three years.
- Market Concentration: Moderately concentrated, with top 5 players holding approximately xx% market share in 2025.
- Technological Innovation: CRISPR-Cas9, advanced viral vectors, non-viral delivery systems are key drivers.
- Regulatory Landscape: Stringent regulations impacting time-to-market and development costs.
- Competitive Substitutes: Limited direct substitutes, but alternative therapeutic approaches exist.
- End-User Demographics: Primarily focused on research institutions, pharmaceutical companies, and hospitals.
- M&A Activity: Significant M&A activity, reflecting consolidation and technological acquisition.
Gene Delivery System Industry Growth Trends & Insights
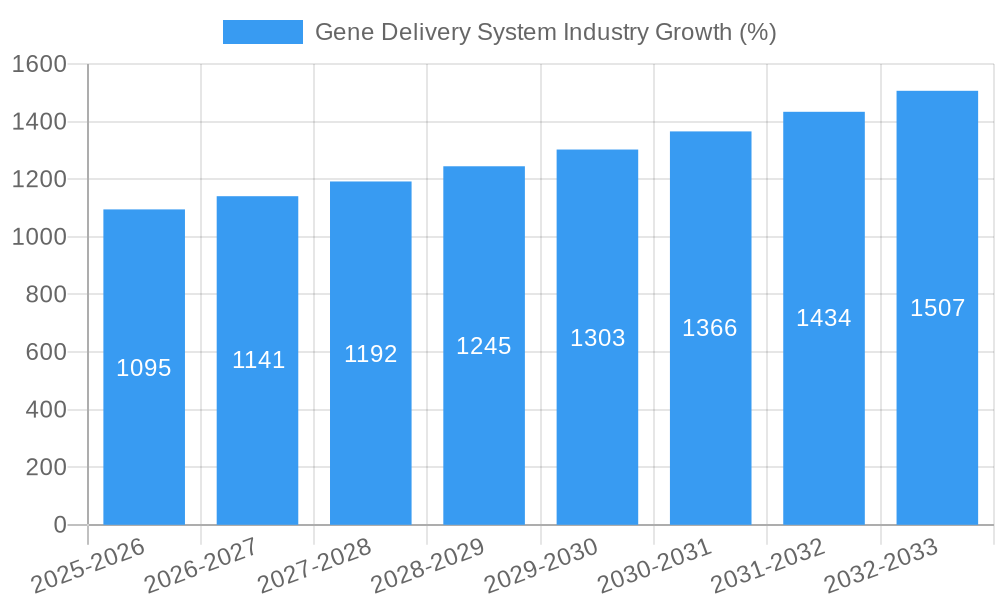
The gene delivery system market exhibits a robust Compound Annual Growth Rate (CAGR) of xx% during the forecast period (2025-2033). This growth is attributed to several factors, including the increasing prevalence of genetic disorders, rising investments in gene therapy research, technological advancements leading to improved efficacy and safety of gene delivery systems, and expanding applications across various therapeutic areas. The market's adoption rate is projected to increase significantly due to successful clinical trials and approvals of novel gene therapies. Consumer behavior is shifting towards greater acceptance and awareness of gene therapy as a viable treatment option. Market penetration is expected to grow from xx% in 2025 to xx% by 2033, driven by the expansion of target indications and improved access to treatments. Technological disruptions, particularly in the development of highly specific and efficient delivery systems, are further fueling market expansion.
Dominant Regions, Countries, or Segments in Gene Delivery System Industry
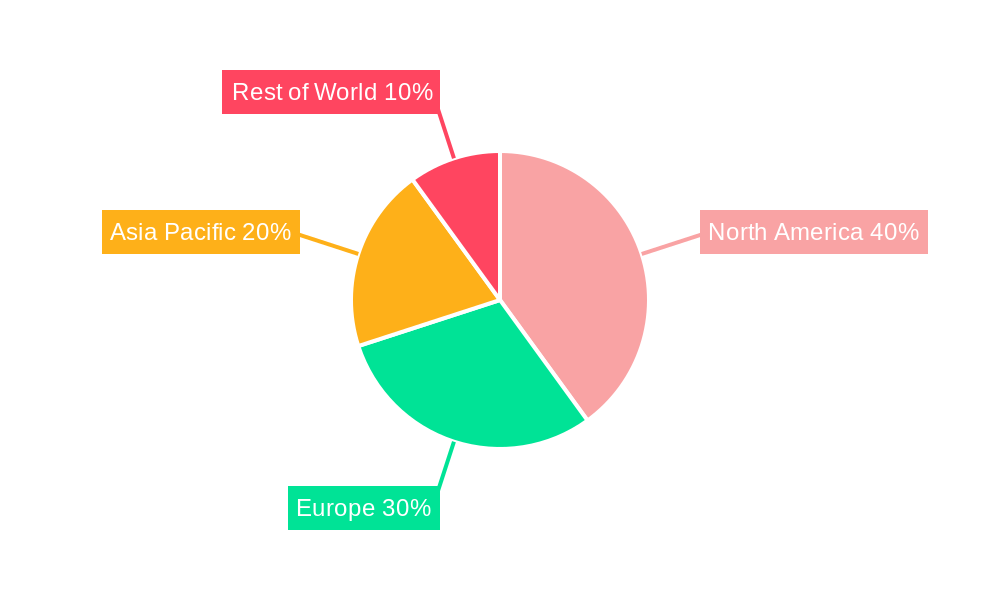
North America currently dominates the gene delivery system market, holding the largest market share in 2025 due to strong research infrastructure, substantial investments in R&D, and the early adoption of innovative gene therapies. However, the Asia-Pacific region is projected to show significant growth during the forecast period, fueled by increasing healthcare expenditure, growing awareness of gene therapy, and expanding research activities. Within the segment breakdown:
By Delivery Systems: Viral gene delivery systems represent the largest segment, driven by their high transfection efficiency; however, non-viral systems are gaining traction due to improved safety profiles.
By Application: Oncology is the leading application segment, due to a high unmet need and significant investment in cancer gene therapy.
By Route of Administration: Injectable routes dominate, reflecting the complexities of delivering genetic material effectively.
Key Drivers (North America): Robust R&D infrastructure, high healthcare expenditure, early adoption of new technologies, strong regulatory support.
Key Drivers (Asia-Pacific): Increasing healthcare expenditure, growing awareness of gene therapy, rising prevalence of target diseases, government initiatives.
Gene Delivery System Industry Product Landscape
The gene delivery system market is characterized by a diverse range of products, including viral vectors (adeno-associated viruses, lentiviruses, retroviruses), non-viral vectors (liposomes, nanoparticles), and hybrid systems combining the advantages of both. Product innovation focuses on improving vector specificity, efficacy, safety, and reducing immunogenicity. Advancements in targeted delivery and controlled release mechanisms are enhancing therapeutic outcomes. The unique selling propositions of various products revolve around efficacy, safety, ease of use, and cost-effectiveness. Technological advancements include the development of self-assembling nanoparticles and targeted delivery systems, improving therapeutic efficacy and reducing side effects.
Key Drivers, Barriers & Challenges in Gene Delivery System Industry
Key Drivers:
- Technological advancements in vector engineering and gene editing.
- Increasing prevalence of genetic disorders.
- Growing investments in gene therapy research and development.
- Favorable regulatory environment in certain regions.
Key Challenges:
- High cost of gene therapy development and manufacturing.
- Complex regulatory pathways and approval processes.
- Potential for immunogenicity and off-target effects.
- Limited access and affordability for patients.
- Supply chain disruptions impacting production and delivery.
Emerging Opportunities in Gene Delivery System Industry
Emerging opportunities lie in the development of novel gene editing technologies, such as CRISPR-Cas9, and the expansion of gene therapy applications to new therapeutic areas like cardiovascular diseases and neurodegenerative disorders. Untapped markets in developing countries present significant growth potential. The growing demand for personalized medicine is also driving innovation in gene delivery systems tailored to individual patient needs. Evolving consumer preferences for minimally invasive therapies and improved safety profiles are creating opportunities for less-invasive delivery systems.
Growth Accelerators in the Gene Delivery System Industry
Long-term growth will be driven by continued technological breakthroughs leading to more efficient and safer gene delivery systems, strategic collaborations between pharmaceutical companies and biotechnology firms accelerating clinical development, and expanding global market penetration through increased access to treatment. The development of innovative manufacturing processes reducing production costs and expanding geographic reach will also be key growth catalysts.
Key Players Shaping the Gene Delivery System Industry Market
- Becton Dickinson and Company
- Shanghai Sunway Biotech Co Ltd
- Bayer AG
- Novartis AG
- Amgen Inc
- Sirion-Biotech GmbH
- Takara Bio
- GenScript ProBio
- F Hoffmann-La Roche AG
- Shenzhen SiBiono GeneTech Co Ltd
- Batavia Biosciences
- Genezen
- Pfizer Inc
Notable Milestones in Gene Delivery System Industry Sector
- August 2022: Versant Ventures launched Vector BioPharma AG, focusing on a novel viral-gene-free precision gene delivery platform. This signifies a shift towards safer and more effective delivery methods.
- November 2022: IMUNON and Acuitas Therapeutics entered a technology evaluation agreement, combining plasmid DNA with lipid nanoparticle delivery. This collaboration highlights the importance of synergistic partnerships in advancing gene delivery technology.
In-Depth Gene Delivery System Industry Market Outlook
The future of the gene delivery system market is exceptionally promising, driven by the continued development of innovative therapies and the growing understanding of the human genome. Strategic partnerships, increased R&D investments, and expansion into new therapeutic areas will be pivotal in shaping the industry's future trajectory. The market's potential for growth is substantial, particularly in areas like personalized medicine and the treatment of currently incurable diseases. Companies focused on developing safer, more effective, and cost-efficient gene delivery systems will be best positioned to capture significant market share.
Gene Delivery System Industry Segmentation
-
1. Delivery Systems
-
1.1. Viral Gene Delivery Systems
- 1.1.1. Adenovirus Systems
- 1.1.2. Lentiviral Systems
- 1.1.3. Retroviral Systems
- 1.1.4. Other Viral Gene Delivery Systems
- 1.2. Non-viral Gene Delivery
- 1.3. Combined Hybrid Delivery Systems
-
1.1. Viral Gene Delivery Systems
-
2. Application
- 2.1. Oncology
- 2.2. Infectious Diseases
- 2.3. Cardiovascular Disorders
- 2.4. Diabetes
-
3. Route of Administration
- 3.1. Oral
- 3.2. Injectable
- 3.3. Nasal
Gene Delivery System Industry Segmentation By Geography
-
1. North America
- 1.1. United States
- 1.2. Canada
- 1.3. Mexico
-
2. Europe
- 2.1. Germany
- 2.2. United Kingdom
- 2.3. France
- 2.4. Italy
- 2.5. Spain
- 2.6. Rest of Europe
-
3. Asia Pacific
- 3.1. China
- 3.2. Japan
- 3.3. India
- 3.4. Australia
- 3.5. South Korea
- 3.6. Rest of Asia Pacific
-
4. Middle East and Africa
- 4.1. GCC
- 4.2. South Africa
- 4.3. Rest of Middle East and Africa
-
5. South America
- 5.1. Brazil
- 5.2. Argentina
- 5.3. Rest of South America
Gene Delivery System Industry REPORT HIGHLIGHTS
| Aspects | Details |
|---|---|
| Study Period | 2019-2033 |
| Base Year | 2024 |
| Estimated Year | 2025 |
| Forecast Period | 2025-2033 |
| Historical Period | 2019-2024 |
| Growth Rate | CAGR of 7.30% from 2019-2033 |
| Segmentation |
|
Table of Contents
- 1. Introduction
- 1.1. Research Scope
- 1.2. Market Segmentation
- 1.3. Research Methodology
- 1.4. Definitions and Assumptions
- 2. Executive Summary
- 2.1. Introduction
- 3. Market Dynamics
- 3.1. Introduction
- 3.2. Market Drivers
- 3.2.1. Growing Burden of Chronic Diseases and Lifestyle Disorders; Technological Advancements in Research by Biopharmaceutical Companies
- 3.3. Market Restrains
- 3.3.1. High Cost of Treatment
- 3.4. Market Trends
- 3.4.1. Viral Gene Delivery Systems Segment is Expected to Hold the Largest Share in the Gene Delivery Systems Market
- 4. Market Factor Analysis
- 4.1. Porters Five Forces
- 4.2. Supply/Value Chain
- 4.3. PESTEL analysis
- 4.4. Market Entropy
- 4.5. Patent/Trademark Analysis
- 5. Global Gene Delivery System Industry Analysis, Insights and Forecast, 2019-2031
- 5.1. Market Analysis, Insights and Forecast - by Delivery Systems
- 5.1.1. Viral Gene Delivery Systems
- 5.1.1.1. Adenovirus Systems
- 5.1.1.2. Lentiviral Systems
- 5.1.1.3. Retroviral Systems
- 5.1.1.4. Other Viral Gene Delivery Systems
- 5.1.2. Non-viral Gene Delivery
- 5.1.3. Combined Hybrid Delivery Systems
- 5.1.1. Viral Gene Delivery Systems
- 5.2. Market Analysis, Insights and Forecast - by Application
- 5.2.1. Oncology
- 5.2.2. Infectious Diseases
- 5.2.3. Cardiovascular Disorders
- 5.2.4. Diabetes
- 5.3. Market Analysis, Insights and Forecast - by Route of Administration
- 5.3.1. Oral
- 5.3.2. Injectable
- 5.3.3. Nasal
- 5.4. Market Analysis, Insights and Forecast - by Region
- 5.4.1. North America
- 5.4.2. Europe
- 5.4.3. Asia Pacific
- 5.4.4. Middle East and Africa
- 5.4.5. South America
- 5.1. Market Analysis, Insights and Forecast - by Delivery Systems
- 6. North America Gene Delivery System Industry Analysis, Insights and Forecast, 2019-2031
- 6.1. Market Analysis, Insights and Forecast - by Delivery Systems
- 6.1.1. Viral Gene Delivery Systems
- 6.1.1.1. Adenovirus Systems
- 6.1.1.2. Lentiviral Systems
- 6.1.1.3. Retroviral Systems
- 6.1.1.4. Other Viral Gene Delivery Systems
- 6.1.2. Non-viral Gene Delivery
- 6.1.3. Combined Hybrid Delivery Systems
- 6.1.1. Viral Gene Delivery Systems
- 6.2. Market Analysis, Insights and Forecast - by Application
- 6.2.1. Oncology
- 6.2.2. Infectious Diseases
- 6.2.3. Cardiovascular Disorders
- 6.2.4. Diabetes
- 6.3. Market Analysis, Insights and Forecast - by Route of Administration
- 6.3.1. Oral
- 6.3.2. Injectable
- 6.3.3. Nasal
- 6.1. Market Analysis, Insights and Forecast - by Delivery Systems
- 7. Europe Gene Delivery System Industry Analysis, Insights and Forecast, 2019-2031
- 7.1. Market Analysis, Insights and Forecast - by Delivery Systems
- 7.1.1. Viral Gene Delivery Systems
- 7.1.1.1. Adenovirus Systems
- 7.1.1.2. Lentiviral Systems
- 7.1.1.3. Retroviral Systems
- 7.1.1.4. Other Viral Gene Delivery Systems
- 7.1.2. Non-viral Gene Delivery
- 7.1.3. Combined Hybrid Delivery Systems
- 7.1.1. Viral Gene Delivery Systems
- 7.2. Market Analysis, Insights and Forecast - by Application
- 7.2.1. Oncology
- 7.2.2. Infectious Diseases
- 7.2.3. Cardiovascular Disorders
- 7.2.4. Diabetes
- 7.3. Market Analysis, Insights and Forecast - by Route of Administration
- 7.3.1. Oral
- 7.3.2. Injectable
- 7.3.3. Nasal
- 7.1. Market Analysis, Insights and Forecast - by Delivery Systems
- 8. Asia Pacific Gene Delivery System Industry Analysis, Insights and Forecast, 2019-2031
- 8.1. Market Analysis, Insights and Forecast - by Delivery Systems
- 8.1.1. Viral Gene Delivery Systems
- 8.1.1.1. Adenovirus Systems
- 8.1.1.2. Lentiviral Systems
- 8.1.1.3. Retroviral Systems
- 8.1.1.4. Other Viral Gene Delivery Systems
- 8.1.2. Non-viral Gene Delivery
- 8.1.3. Combined Hybrid Delivery Systems
- 8.1.1. Viral Gene Delivery Systems
- 8.2. Market Analysis, Insights and Forecast - by Application
- 8.2.1. Oncology
- 8.2.2. Infectious Diseases
- 8.2.3. Cardiovascular Disorders
- 8.2.4. Diabetes
- 8.3. Market Analysis, Insights and Forecast - by Route of Administration
- 8.3.1. Oral
- 8.3.2. Injectable
- 8.3.3. Nasal
- 8.1. Market Analysis, Insights and Forecast - by Delivery Systems
- 9. Middle East and Africa Gene Delivery System Industry Analysis, Insights and Forecast, 2019-2031
- 9.1. Market Analysis, Insights and Forecast - by Delivery Systems
- 9.1.1. Viral Gene Delivery Systems
- 9.1.1.1. Adenovirus Systems
- 9.1.1.2. Lentiviral Systems
- 9.1.1.3. Retroviral Systems
- 9.1.1.4. Other Viral Gene Delivery Systems
- 9.1.2. Non-viral Gene Delivery
- 9.1.3. Combined Hybrid Delivery Systems
- 9.1.1. Viral Gene Delivery Systems
- 9.2. Market Analysis, Insights and Forecast - by Application
- 9.2.1. Oncology
- 9.2.2. Infectious Diseases
- 9.2.3. Cardiovascular Disorders
- 9.2.4. Diabetes
- 9.3. Market Analysis, Insights and Forecast - by Route of Administration
- 9.3.1. Oral
- 9.3.2. Injectable
- 9.3.3. Nasal
- 9.1. Market Analysis, Insights and Forecast - by Delivery Systems
- 10. South America Gene Delivery System Industry Analysis, Insights and Forecast, 2019-2031
- 10.1. Market Analysis, Insights and Forecast - by Delivery Systems
- 10.1.1. Viral Gene Delivery Systems
- 10.1.1.1. Adenovirus Systems
- 10.1.1.2. Lentiviral Systems
- 10.1.1.3. Retroviral Systems
- 10.1.1.4. Other Viral Gene Delivery Systems
- 10.1.2. Non-viral Gene Delivery
- 10.1.3. Combined Hybrid Delivery Systems
- 10.1.1. Viral Gene Delivery Systems
- 10.2. Market Analysis, Insights and Forecast - by Application
- 10.2.1. Oncology
- 10.2.2. Infectious Diseases
- 10.2.3. Cardiovascular Disorders
- 10.2.4. Diabetes
- 10.3. Market Analysis, Insights and Forecast - by Route of Administration
- 10.3.1. Oral
- 10.3.2. Injectable
- 10.3.3. Nasal
- 10.1. Market Analysis, Insights and Forecast - by Delivery Systems
- 11. North America Gene Delivery System Industry Analysis, Insights and Forecast, 2019-2031
- 11.1. Market Analysis, Insights and Forecast - By Country/Sub-region
- 11.1.1 United States
- 11.1.2 Canada
- 11.1.3 Mexico
- 12. Europe Gene Delivery System Industry Analysis, Insights and Forecast, 2019-2031
- 12.1. Market Analysis, Insights and Forecast - By Country/Sub-region
- 12.1.1 Germany
- 12.1.2 United Kingdom
- 12.1.3 France
- 12.1.4 Italy
- 12.1.5 Spain
- 12.1.6 Rest of Europe
- 13. Asia Pacific Gene Delivery System Industry Analysis, Insights and Forecast, 2019-2031
- 13.1. Market Analysis, Insights and Forecast - By Country/Sub-region
- 13.1.1 China
- 13.1.2 Japan
- 13.1.3 India
- 13.1.4 Australia
- 13.1.5 South Korea
- 13.1.6 Rest of Asia Pacific
- 14. Middle East and Africa Gene Delivery System Industry Analysis, Insights and Forecast, 2019-2031
- 14.1. Market Analysis, Insights and Forecast - By Country/Sub-region
- 14.1.1 GCC
- 14.1.2 South Africa
- 14.1.3 Rest of Middle East and Africa
- 15. South America Gene Delivery System Industry Analysis, Insights and Forecast, 2019-2031
- 15.1. Market Analysis, Insights and Forecast - By Country/Sub-region
- 15.1.1 Brazil
- 15.1.2 Argentina
- 15.1.3 Rest of South America
- 16. Competitive Analysis
- 16.1. Global Market Share Analysis 2024
- 16.2. Company Profiles
- 16.2.1 Becton Dickinson and Company
- 16.2.1.1. Overview
- 16.2.1.2. Products
- 16.2.1.3. SWOT Analysis
- 16.2.1.4. Recent Developments
- 16.2.1.5. Financials (Based on Availability)
- 16.2.2 Shanghai Sunway Biotech Co Ltd
- 16.2.2.1. Overview
- 16.2.2.2. Products
- 16.2.2.3. SWOT Analysis
- 16.2.2.4. Recent Developments
- 16.2.2.5. Financials (Based on Availability)
- 16.2.3 Bayer AG
- 16.2.3.1. Overview
- 16.2.3.2. Products
- 16.2.3.3. SWOT Analysis
- 16.2.3.4. Recent Developments
- 16.2.3.5. Financials (Based on Availability)
- 16.2.4 Novartis AG
- 16.2.4.1. Overview
- 16.2.4.2. Products
- 16.2.4.3. SWOT Analysis
- 16.2.4.4. Recent Developments
- 16.2.4.5. Financials (Based on Availability)
- 16.2.5 Amgen Inc
- 16.2.5.1. Overview
- 16.2.5.2. Products
- 16.2.5.3. SWOT Analysis
- 16.2.5.4. Recent Developments
- 16.2.5.5. Financials (Based on Availability)
- 16.2.6 Sirion-Biotech GmbH
- 16.2.6.1. Overview
- 16.2.6.2. Products
- 16.2.6.3. SWOT Analysis
- 16.2.6.4. Recent Developments
- 16.2.6.5. Financials (Based on Availability)
- 16.2.7 Takara Bio
- 16.2.7.1. Overview
- 16.2.7.2. Products
- 16.2.7.3. SWOT Analysis
- 16.2.7.4. Recent Developments
- 16.2.7.5. Financials (Based on Availability)
- 16.2.8 GenScript ProBio
- 16.2.8.1. Overview
- 16.2.8.2. Products
- 16.2.8.3. SWOT Analysis
- 16.2.8.4. Recent Developments
- 16.2.8.5. Financials (Based on Availability)
- 16.2.9 F Hoffmann-La Roche AG
- 16.2.9.1. Overview
- 16.2.9.2. Products
- 16.2.9.3. SWOT Analysis
- 16.2.9.4. Recent Developments
- 16.2.9.5. Financials (Based on Availability)
- 16.2.10 Shenzhen SiBiono GeneTech Co Ltd
- 16.2.10.1. Overview
- 16.2.10.2. Products
- 16.2.10.3. SWOT Analysis
- 16.2.10.4. Recent Developments
- 16.2.10.5. Financials (Based on Availability)
- 16.2.11 Batavia Biosciences
- 16.2.11.1. Overview
- 16.2.11.2. Products
- 16.2.11.3. SWOT Analysis
- 16.2.11.4. Recent Developments
- 16.2.11.5. Financials (Based on Availability)
- 16.2.12 Genezen
- 16.2.12.1. Overview
- 16.2.12.2. Products
- 16.2.12.3. SWOT Analysis
- 16.2.12.4. Recent Developments
- 16.2.12.5. Financials (Based on Availability)
- 16.2.13 Pfizer Inc
- 16.2.13.1. Overview
- 16.2.13.2. Products
- 16.2.13.3. SWOT Analysis
- 16.2.13.4. Recent Developments
- 16.2.13.5. Financials (Based on Availability)
- 16.2.1 Becton Dickinson and Company
List of Figures
- Figure 1: Global Gene Delivery System Industry Revenue Breakdown (Million, %) by Region 2024 & 2032
- Figure 2: Global Gene Delivery System Industry Volume Breakdown (K Unit, %) by Region 2024 & 2032
- Figure 3: North America Gene Delivery System Industry Revenue (Million), by Country 2024 & 2032
- Figure 4: North America Gene Delivery System Industry Volume (K Unit), by Country 2024 & 2032
- Figure 5: North America Gene Delivery System Industry Revenue Share (%), by Country 2024 & 2032
- Figure 6: North America Gene Delivery System Industry Volume Share (%), by Country 2024 & 2032
- Figure 7: Europe Gene Delivery System Industry Revenue (Million), by Country 2024 & 2032
- Figure 8: Europe Gene Delivery System Industry Volume (K Unit), by Country 2024 & 2032
- Figure 9: Europe Gene Delivery System Industry Revenue Share (%), by Country 2024 & 2032
- Figure 10: Europe Gene Delivery System Industry Volume Share (%), by Country 2024 & 2032
- Figure 11: Asia Pacific Gene Delivery System Industry Revenue (Million), by Country 2024 & 2032
- Figure 12: Asia Pacific Gene Delivery System Industry Volume (K Unit), by Country 2024 & 2032
- Figure 13: Asia Pacific Gene Delivery System Industry Revenue Share (%), by Country 2024 & 2032
- Figure 14: Asia Pacific Gene Delivery System Industry Volume Share (%), by Country 2024 & 2032
- Figure 15: Middle East and Africa Gene Delivery System Industry Revenue (Million), by Country 2024 & 2032
- Figure 16: Middle East and Africa Gene Delivery System Industry Volume (K Unit), by Country 2024 & 2032
- Figure 17: Middle East and Africa Gene Delivery System Industry Revenue Share (%), by Country 2024 & 2032
- Figure 18: Middle East and Africa Gene Delivery System Industry Volume Share (%), by Country 2024 & 2032
- Figure 19: South America Gene Delivery System Industry Revenue (Million), by Country 2024 & 2032
- Figure 20: South America Gene Delivery System Industry Volume (K Unit), by Country 2024 & 2032
- Figure 21: South America Gene Delivery System Industry Revenue Share (%), by Country 2024 & 2032
- Figure 22: South America Gene Delivery System Industry Volume Share (%), by Country 2024 & 2032
- Figure 23: North America Gene Delivery System Industry Revenue (Million), by Delivery Systems 2024 & 2032
- Figure 24: North America Gene Delivery System Industry Volume (K Unit), by Delivery Systems 2024 & 2032
- Figure 25: North America Gene Delivery System Industry Revenue Share (%), by Delivery Systems 2024 & 2032
- Figure 26: North America Gene Delivery System Industry Volume Share (%), by Delivery Systems 2024 & 2032
- Figure 27: North America Gene Delivery System Industry Revenue (Million), by Application 2024 & 2032
- Figure 28: North America Gene Delivery System Industry Volume (K Unit), by Application 2024 & 2032
- Figure 29: North America Gene Delivery System Industry Revenue Share (%), by Application 2024 & 2032
- Figure 30: North America Gene Delivery System Industry Volume Share (%), by Application 2024 & 2032
- Figure 31: North America Gene Delivery System Industry Revenue (Million), by Route of Administration 2024 & 2032
- Figure 32: North America Gene Delivery System Industry Volume (K Unit), by Route of Administration 2024 & 2032
- Figure 33: North America Gene Delivery System Industry Revenue Share (%), by Route of Administration 2024 & 2032
- Figure 34: North America Gene Delivery System Industry Volume Share (%), by Route of Administration 2024 & 2032
- Figure 35: North America Gene Delivery System Industry Revenue (Million), by Country 2024 & 2032
- Figure 36: North America Gene Delivery System Industry Volume (K Unit), by Country 2024 & 2032
- Figure 37: North America Gene Delivery System Industry Revenue Share (%), by Country 2024 & 2032
- Figure 38: North America Gene Delivery System Industry Volume Share (%), by Country 2024 & 2032
- Figure 39: Europe Gene Delivery System Industry Revenue (Million), by Delivery Systems 2024 & 2032
- Figure 40: Europe Gene Delivery System Industry Volume (K Unit), by Delivery Systems 2024 & 2032
- Figure 41: Europe Gene Delivery System Industry Revenue Share (%), by Delivery Systems 2024 & 2032
- Figure 42: Europe Gene Delivery System Industry Volume Share (%), by Delivery Systems 2024 & 2032
- Figure 43: Europe Gene Delivery System Industry Revenue (Million), by Application 2024 & 2032
- Figure 44: Europe Gene Delivery System Industry Volume (K Unit), by Application 2024 & 2032
- Figure 45: Europe Gene Delivery System Industry Revenue Share (%), by Application 2024 & 2032
- Figure 46: Europe Gene Delivery System Industry Volume Share (%), by Application 2024 & 2032
- Figure 47: Europe Gene Delivery System Industry Revenue (Million), by Route of Administration 2024 & 2032
- Figure 48: Europe Gene Delivery System Industry Volume (K Unit), by Route of Administration 2024 & 2032
- Figure 49: Europe Gene Delivery System Industry Revenue Share (%), by Route of Administration 2024 & 2032
- Figure 50: Europe Gene Delivery System Industry Volume Share (%), by Route of Administration 2024 & 2032
- Figure 51: Europe Gene Delivery System Industry Revenue (Million), by Country 2024 & 2032
- Figure 52: Europe Gene Delivery System Industry Volume (K Unit), by Country 2024 & 2032
- Figure 53: Europe Gene Delivery System Industry Revenue Share (%), by Country 2024 & 2032
- Figure 54: Europe Gene Delivery System Industry Volume Share (%), by Country 2024 & 2032
- Figure 55: Asia Pacific Gene Delivery System Industry Revenue (Million), by Delivery Systems 2024 & 2032
- Figure 56: Asia Pacific Gene Delivery System Industry Volume (K Unit), by Delivery Systems 2024 & 2032
- Figure 57: Asia Pacific Gene Delivery System Industry Revenue Share (%), by Delivery Systems 2024 & 2032
- Figure 58: Asia Pacific Gene Delivery System Industry Volume Share (%), by Delivery Systems 2024 & 2032
- Figure 59: Asia Pacific Gene Delivery System Industry Revenue (Million), by Application 2024 & 2032
- Figure 60: Asia Pacific Gene Delivery System Industry Volume (K Unit), by Application 2024 & 2032
- Figure 61: Asia Pacific Gene Delivery System Industry Revenue Share (%), by Application 2024 & 2032
- Figure 62: Asia Pacific Gene Delivery System Industry Volume Share (%), by Application 2024 & 2032
- Figure 63: Asia Pacific Gene Delivery System Industry Revenue (Million), by Route of Administration 2024 & 2032
- Figure 64: Asia Pacific Gene Delivery System Industry Volume (K Unit), by Route of Administration 2024 & 2032
- Figure 65: Asia Pacific Gene Delivery System Industry Revenue Share (%), by Route of Administration 2024 & 2032
- Figure 66: Asia Pacific Gene Delivery System Industry Volume Share (%), by Route of Administration 2024 & 2032
- Figure 67: Asia Pacific Gene Delivery System Industry Revenue (Million), by Country 2024 & 2032
- Figure 68: Asia Pacific Gene Delivery System Industry Volume (K Unit), by Country 2024 & 2032
- Figure 69: Asia Pacific Gene Delivery System Industry Revenue Share (%), by Country 2024 & 2032
- Figure 70: Asia Pacific Gene Delivery System Industry Volume Share (%), by Country 2024 & 2032
- Figure 71: Middle East and Africa Gene Delivery System Industry Revenue (Million), by Delivery Systems 2024 & 2032
- Figure 72: Middle East and Africa Gene Delivery System Industry Volume (K Unit), by Delivery Systems 2024 & 2032
- Figure 73: Middle East and Africa Gene Delivery System Industry Revenue Share (%), by Delivery Systems 2024 & 2032
- Figure 74: Middle East and Africa Gene Delivery System Industry Volume Share (%), by Delivery Systems 2024 & 2032
- Figure 75: Middle East and Africa Gene Delivery System Industry Revenue (Million), by Application 2024 & 2032
- Figure 76: Middle East and Africa Gene Delivery System Industry Volume (K Unit), by Application 2024 & 2032
- Figure 77: Middle East and Africa Gene Delivery System Industry Revenue Share (%), by Application 2024 & 2032
- Figure 78: Middle East and Africa Gene Delivery System Industry Volume Share (%), by Application 2024 & 2032
- Figure 79: Middle East and Africa Gene Delivery System Industry Revenue (Million), by Route of Administration 2024 & 2032
- Figure 80: Middle East and Africa Gene Delivery System Industry Volume (K Unit), by Route of Administration 2024 & 2032
- Figure 81: Middle East and Africa Gene Delivery System Industry Revenue Share (%), by Route of Administration 2024 & 2032
- Figure 82: Middle East and Africa Gene Delivery System Industry Volume Share (%), by Route of Administration 2024 & 2032
- Figure 83: Middle East and Africa Gene Delivery System Industry Revenue (Million), by Country 2024 & 2032
- Figure 84: Middle East and Africa Gene Delivery System Industry Volume (K Unit), by Country 2024 & 2032
- Figure 85: Middle East and Africa Gene Delivery System Industry Revenue Share (%), by Country 2024 & 2032
- Figure 86: Middle East and Africa Gene Delivery System Industry Volume Share (%), by Country 2024 & 2032
- Figure 87: South America Gene Delivery System Industry Revenue (Million), by Delivery Systems 2024 & 2032
- Figure 88: South America Gene Delivery System Industry Volume (K Unit), by Delivery Systems 2024 & 2032
- Figure 89: South America Gene Delivery System Industry Revenue Share (%), by Delivery Systems 2024 & 2032
- Figure 90: South America Gene Delivery System Industry Volume Share (%), by Delivery Systems 2024 & 2032
- Figure 91: South America Gene Delivery System Industry Revenue (Million), by Application 2024 & 2032
- Figure 92: South America Gene Delivery System Industry Volume (K Unit), by Application 2024 & 2032
- Figure 93: South America Gene Delivery System Industry Revenue Share (%), by Application 2024 & 2032
- Figure 94: South America Gene Delivery System Industry Volume Share (%), by Application 2024 & 2032
- Figure 95: South America Gene Delivery System Industry Revenue (Million), by Route of Administration 2024 & 2032
- Figure 96: South America Gene Delivery System Industry Volume (K Unit), by Route of Administration 2024 & 2032
- Figure 97: South America Gene Delivery System Industry Revenue Share (%), by Route of Administration 2024 & 2032
- Figure 98: South America Gene Delivery System Industry Volume Share (%), by Route of Administration 2024 & 2032
- Figure 99: South America Gene Delivery System Industry Revenue (Million), by Country 2024 & 2032
- Figure 100: South America Gene Delivery System Industry Volume (K Unit), by Country 2024 & 2032
- Figure 101: South America Gene Delivery System Industry Revenue Share (%), by Country 2024 & 2032
- Figure 102: South America Gene Delivery System Industry Volume Share (%), by Country 2024 & 2032
List of Tables
- Table 1: Global Gene Delivery System Industry Revenue Million Forecast, by Region 2019 & 2032
- Table 2: Global Gene Delivery System Industry Volume K Unit Forecast, by Region 2019 & 2032
- Table 3: Global Gene Delivery System Industry Revenue Million Forecast, by Delivery Systems 2019 & 2032
- Table 4: Global Gene Delivery System Industry Volume K Unit Forecast, by Delivery Systems 2019 & 2032
- Table 5: Global Gene Delivery System Industry Revenue Million Forecast, by Application 2019 & 2032
- Table 6: Global Gene Delivery System Industry Volume K Unit Forecast, by Application 2019 & 2032
- Table 7: Global Gene Delivery System Industry Revenue Million Forecast, by Route of Administration 2019 & 2032
- Table 8: Global Gene Delivery System Industry Volume K Unit Forecast, by Route of Administration 2019 & 2032
- Table 9: Global Gene Delivery System Industry Revenue Million Forecast, by Region 2019 & 2032
- Table 10: Global Gene Delivery System Industry Volume K Unit Forecast, by Region 2019 & 2032
- Table 11: Global Gene Delivery System Industry Revenue Million Forecast, by Country 2019 & 2032
- Table 12: Global Gene Delivery System Industry Volume K Unit Forecast, by Country 2019 & 2032
- Table 13: United States Gene Delivery System Industry Revenue (Million) Forecast, by Application 2019 & 2032
- Table 14: United States Gene Delivery System Industry Volume (K Unit) Forecast, by Application 2019 & 2032
- Table 15: Canada Gene Delivery System Industry Revenue (Million) Forecast, by Application 2019 & 2032
- Table 16: Canada Gene Delivery System Industry Volume (K Unit) Forecast, by Application 2019 & 2032
- Table 17: Mexico Gene Delivery System Industry Revenue (Million) Forecast, by Application 2019 & 2032
- Table 18: Mexico Gene Delivery System Industry Volume (K Unit) Forecast, by Application 2019 & 2032
- Table 19: Global Gene Delivery System Industry Revenue Million Forecast, by Country 2019 & 2032
- Table 20: Global Gene Delivery System Industry Volume K Unit Forecast, by Country 2019 & 2032
- Table 21: Germany Gene Delivery System Industry Revenue (Million) Forecast, by Application 2019 & 2032
- Table 22: Germany Gene Delivery System Industry Volume (K Unit) Forecast, by Application 2019 & 2032
- Table 23: United Kingdom Gene Delivery System Industry Revenue (Million) Forecast, by Application 2019 & 2032
- Table 24: United Kingdom Gene Delivery System Industry Volume (K Unit) Forecast, by Application 2019 & 2032
- Table 25: France Gene Delivery System Industry Revenue (Million) Forecast, by Application 2019 & 2032
- Table 26: France Gene Delivery System Industry Volume (K Unit) Forecast, by Application 2019 & 2032
- Table 27: Italy Gene Delivery System Industry Revenue (Million) Forecast, by Application 2019 & 2032
- Table 28: Italy Gene Delivery System Industry Volume (K Unit) Forecast, by Application 2019 & 2032
- Table 29: Spain Gene Delivery System Industry Revenue (Million) Forecast, by Application 2019 & 2032
- Table 30: Spain Gene Delivery System Industry Volume (K Unit) Forecast, by Application 2019 & 2032
- Table 31: Rest of Europe Gene Delivery System Industry Revenue (Million) Forecast, by Application 2019 & 2032
- Table 32: Rest of Europe Gene Delivery System Industry Volume (K Unit) Forecast, by Application 2019 & 2032
- Table 33: Global Gene Delivery System Industry Revenue Million Forecast, by Country 2019 & 2032
- Table 34: Global Gene Delivery System Industry Volume K Unit Forecast, by Country 2019 & 2032
- Table 35: China Gene Delivery System Industry Revenue (Million) Forecast, by Application 2019 & 2032
- Table 36: China Gene Delivery System Industry Volume (K Unit) Forecast, by Application 2019 & 2032
- Table 37: Japan Gene Delivery System Industry Revenue (Million) Forecast, by Application 2019 & 2032
- Table 38: Japan Gene Delivery System Industry Volume (K Unit) Forecast, by Application 2019 & 2032
- Table 39: India Gene Delivery System Industry Revenue (Million) Forecast, by Application 2019 & 2032
- Table 40: India Gene Delivery System Industry Volume (K Unit) Forecast, by Application 2019 & 2032
- Table 41: Australia Gene Delivery System Industry Revenue (Million) Forecast, by Application 2019 & 2032
- Table 42: Australia Gene Delivery System Industry Volume (K Unit) Forecast, by Application 2019 & 2032
- Table 43: South Korea Gene Delivery System Industry Revenue (Million) Forecast, by Application 2019 & 2032
- Table 44: South Korea Gene Delivery System Industry Volume (K Unit) Forecast, by Application 2019 & 2032
- Table 45: Rest of Asia Pacific Gene Delivery System Industry Revenue (Million) Forecast, by Application 2019 & 2032
- Table 46: Rest of Asia Pacific Gene Delivery System Industry Volume (K Unit) Forecast, by Application 2019 & 2032
- Table 47: Global Gene Delivery System Industry Revenue Million Forecast, by Country 2019 & 2032
- Table 48: Global Gene Delivery System Industry Volume K Unit Forecast, by Country 2019 & 2032
- Table 49: GCC Gene Delivery System Industry Revenue (Million) Forecast, by Application 2019 & 2032
- Table 50: GCC Gene Delivery System Industry Volume (K Unit) Forecast, by Application 2019 & 2032
- Table 51: South Africa Gene Delivery System Industry Revenue (Million) Forecast, by Application 2019 & 2032
- Table 52: South Africa Gene Delivery System Industry Volume (K Unit) Forecast, by Application 2019 & 2032
- Table 53: Rest of Middle East and Africa Gene Delivery System Industry Revenue (Million) Forecast, by Application 2019 & 2032
- Table 54: Rest of Middle East and Africa Gene Delivery System Industry Volume (K Unit) Forecast, by Application 2019 & 2032
- Table 55: Global Gene Delivery System Industry Revenue Million Forecast, by Country 2019 & 2032
- Table 56: Global Gene Delivery System Industry Volume K Unit Forecast, by Country 2019 & 2032
- Table 57: Brazil Gene Delivery System Industry Revenue (Million) Forecast, by Application 2019 & 2032
- Table 58: Brazil Gene Delivery System Industry Volume (K Unit) Forecast, by Application 2019 & 2032
- Table 59: Argentina Gene Delivery System Industry Revenue (Million) Forecast, by Application 2019 & 2032
- Table 60: Argentina Gene Delivery System Industry Volume (K Unit) Forecast, by Application 2019 & 2032
- Table 61: Rest of South America Gene Delivery System Industry Revenue (Million) Forecast, by Application 2019 & 2032
- Table 62: Rest of South America Gene Delivery System Industry Volume (K Unit) Forecast, by Application 2019 & 2032
- Table 63: Global Gene Delivery System Industry Revenue Million Forecast, by Delivery Systems 2019 & 2032
- Table 64: Global Gene Delivery System Industry Volume K Unit Forecast, by Delivery Systems 2019 & 2032
- Table 65: Global Gene Delivery System Industry Revenue Million Forecast, by Application 2019 & 2032
- Table 66: Global Gene Delivery System Industry Volume K Unit Forecast, by Application 2019 & 2032
- Table 67: Global Gene Delivery System Industry Revenue Million Forecast, by Route of Administration 2019 & 2032
- Table 68: Global Gene Delivery System Industry Volume K Unit Forecast, by Route of Administration 2019 & 2032
- Table 69: Global Gene Delivery System Industry Revenue Million Forecast, by Country 2019 & 2032
- Table 70: Global Gene Delivery System Industry Volume K Unit Forecast, by Country 2019 & 2032
- Table 71: United States Gene Delivery System Industry Revenue (Million) Forecast, by Application 2019 & 2032
- Table 72: United States Gene Delivery System Industry Volume (K Unit) Forecast, by Application 2019 & 2032
- Table 73: Canada Gene Delivery System Industry Revenue (Million) Forecast, by Application 2019 & 2032
- Table 74: Canada Gene Delivery System Industry Volume (K Unit) Forecast, by Application 2019 & 2032
- Table 75: Mexico Gene Delivery System Industry Revenue (Million) Forecast, by Application 2019 & 2032
- Table 76: Mexico Gene Delivery System Industry Volume (K Unit) Forecast, by Application 2019 & 2032
- Table 77: Global Gene Delivery System Industry Revenue Million Forecast, by Delivery Systems 2019 & 2032
- Table 78: Global Gene Delivery System Industry Volume K Unit Forecast, by Delivery Systems 2019 & 2032
- Table 79: Global Gene Delivery System Industry Revenue Million Forecast, by Application 2019 & 2032
- Table 80: Global Gene Delivery System Industry Volume K Unit Forecast, by Application 2019 & 2032
- Table 81: Global Gene Delivery System Industry Revenue Million Forecast, by Route of Administration 2019 & 2032
- Table 82: Global Gene Delivery System Industry Volume K Unit Forecast, by Route of Administration 2019 & 2032
- Table 83: Global Gene Delivery System Industry Revenue Million Forecast, by Country 2019 & 2032
- Table 84: Global Gene Delivery System Industry Volume K Unit Forecast, by Country 2019 & 2032
- Table 85: Germany Gene Delivery System Industry Revenue (Million) Forecast, by Application 2019 & 2032
- Table 86: Germany Gene Delivery System Industry Volume (K Unit) Forecast, by Application 2019 & 2032
- Table 87: United Kingdom Gene Delivery System Industry Revenue (Million) Forecast, by Application 2019 & 2032
- Table 88: United Kingdom Gene Delivery System Industry Volume (K Unit) Forecast, by Application 2019 & 2032
- Table 89: France Gene Delivery System Industry Revenue (Million) Forecast, by Application 2019 & 2032
- Table 90: France Gene Delivery System Industry Volume (K Unit) Forecast, by Application 2019 & 2032
- Table 91: Italy Gene Delivery System Industry Revenue (Million) Forecast, by Application 2019 & 2032
- Table 92: Italy Gene Delivery System Industry Volume (K Unit) Forecast, by Application 2019 & 2032
- Table 93: Spain Gene Delivery System Industry Revenue (Million) Forecast, by Application 2019 & 2032
- Table 94: Spain Gene Delivery System Industry Volume (K Unit) Forecast, by Application 2019 & 2032
- Table 95: Rest of Europe Gene Delivery System Industry Revenue (Million) Forecast, by Application 2019 & 2032
- Table 96: Rest of Europe Gene Delivery System Industry Volume (K Unit) Forecast, by Application 2019 & 2032
- Table 97: Global Gene Delivery System Industry Revenue Million Forecast, by Delivery Systems 2019 & 2032
- Table 98: Global Gene Delivery System Industry Volume K Unit Forecast, by Delivery Systems 2019 & 2032
- Table 99: Global Gene Delivery System Industry Revenue Million Forecast, by Application 2019 & 2032
- Table 100: Global Gene Delivery System Industry Volume K Unit Forecast, by Application 2019 & 2032
- Table 101: Global Gene Delivery System Industry Revenue Million Forecast, by Route of Administration 2019 & 2032
- Table 102: Global Gene Delivery System Industry Volume K Unit Forecast, by Route of Administration 2019 & 2032
- Table 103: Global Gene Delivery System Industry Revenue Million Forecast, by Country 2019 & 2032
- Table 104: Global Gene Delivery System Industry Volume K Unit Forecast, by Country 2019 & 2032
- Table 105: China Gene Delivery System Industry Revenue (Million) Forecast, by Application 2019 & 2032
- Table 106: China Gene Delivery System Industry Volume (K Unit) Forecast, by Application 2019 & 2032
- Table 107: Japan Gene Delivery System Industry Revenue (Million) Forecast, by Application 2019 & 2032
- Table 108: Japan Gene Delivery System Industry Volume (K Unit) Forecast, by Application 2019 & 2032
- Table 109: India Gene Delivery System Industry Revenue (Million) Forecast, by Application 2019 & 2032
- Table 110: India Gene Delivery System Industry Volume (K Unit) Forecast, by Application 2019 & 2032
- Table 111: Australia Gene Delivery System Industry Revenue (Million) Forecast, by Application 2019 & 2032
- Table 112: Australia Gene Delivery System Industry Volume (K Unit) Forecast, by Application 2019 & 2032
- Table 113: South Korea Gene Delivery System Industry Revenue (Million) Forecast, by Application 2019 & 2032
- Table 114: South Korea Gene Delivery System Industry Volume (K Unit) Forecast, by Application 2019 & 2032
- Table 115: Rest of Asia Pacific Gene Delivery System Industry Revenue (Million) Forecast, by Application 2019 & 2032
- Table 116: Rest of Asia Pacific Gene Delivery System Industry Volume (K Unit) Forecast, by Application 2019 & 2032
- Table 117: Global Gene Delivery System Industry Revenue Million Forecast, by Delivery Systems 2019 & 2032
- Table 118: Global Gene Delivery System Industry Volume K Unit Forecast, by Delivery Systems 2019 & 2032
- Table 119: Global Gene Delivery System Industry Revenue Million Forecast, by Application 2019 & 2032
- Table 120: Global Gene Delivery System Industry Volume K Unit Forecast, by Application 2019 & 2032
- Table 121: Global Gene Delivery System Industry Revenue Million Forecast, by Route of Administration 2019 & 2032
- Table 122: Global Gene Delivery System Industry Volume K Unit Forecast, by Route of Administration 2019 & 2032
- Table 123: Global Gene Delivery System Industry Revenue Million Forecast, by Country 2019 & 2032
- Table 124: Global Gene Delivery System Industry Volume K Unit Forecast, by Country 2019 & 2032
- Table 125: GCC Gene Delivery System Industry Revenue (Million) Forecast, by Application 2019 & 2032
- Table 126: GCC Gene Delivery System Industry Volume (K Unit) Forecast, by Application 2019 & 2032
- Table 127: South Africa Gene Delivery System Industry Revenue (Million) Forecast, by Application 2019 & 2032
- Table 128: South Africa Gene Delivery System Industry Volume (K Unit) Forecast, by Application 2019 & 2032
- Table 129: Rest of Middle East and Africa Gene Delivery System Industry Revenue (Million) Forecast, by Application 2019 & 2032
- Table 130: Rest of Middle East and Africa Gene Delivery System Industry Volume (K Unit) Forecast, by Application 2019 & 2032
- Table 131: Global Gene Delivery System Industry Revenue Million Forecast, by Delivery Systems 2019 & 2032
- Table 132: Global Gene Delivery System Industry Volume K Unit Forecast, by Delivery Systems 2019 & 2032
- Table 133: Global Gene Delivery System Industry Revenue Million Forecast, by Application 2019 & 2032
- Table 134: Global Gene Delivery System Industry Volume K Unit Forecast, by Application 2019 & 2032
- Table 135: Global Gene Delivery System Industry Revenue Million Forecast, by Route of Administration 2019 & 2032
- Table 136: Global Gene Delivery System Industry Volume K Unit Forecast, by Route of Administration 2019 & 2032
- Table 137: Global Gene Delivery System Industry Revenue Million Forecast, by Country 2019 & 2032
- Table 138: Global Gene Delivery System Industry Volume K Unit Forecast, by Country 2019 & 2032
- Table 139: Brazil Gene Delivery System Industry Revenue (Million) Forecast, by Application 2019 & 2032
- Table 140: Brazil Gene Delivery System Industry Volume (K Unit) Forecast, by Application 2019 & 2032
- Table 141: Argentina Gene Delivery System Industry Revenue (Million) Forecast, by Application 2019 & 2032
- Table 142: Argentina Gene Delivery System Industry Volume (K Unit) Forecast, by Application 2019 & 2032
- Table 143: Rest of South America Gene Delivery System Industry Revenue (Million) Forecast, by Application 2019 & 2032
- Table 144: Rest of South America Gene Delivery System Industry Volume (K Unit) Forecast, by Application 2019 & 2032
Frequently Asked Questions
1. What is the projected Compound Annual Growth Rate (CAGR) of the Gene Delivery System Industry?
The projected CAGR is approximately 7.30%.
2. Which companies are prominent players in the Gene Delivery System Industry?
Key companies in the market include Becton Dickinson and Company, Shanghai Sunway Biotech Co Ltd, Bayer AG, Novartis AG, Amgen Inc, Sirion-Biotech GmbH, Takara Bio, GenScript ProBio, F Hoffmann-La Roche AG, Shenzhen SiBiono GeneTech Co Ltd, Batavia Biosciences, Genezen, Pfizer Inc.
3. What are the main segments of the Gene Delivery System Industry?
The market segments include Delivery Systems, Application, Route of Administration.
4. Can you provide details about the market size?
The market size is estimated to be USD XX Million as of 2022.
5. What are some drivers contributing to market growth?
Growing Burden of Chronic Diseases and Lifestyle Disorders; Technological Advancements in Research by Biopharmaceutical Companies.
6. What are the notable trends driving market growth?
Viral Gene Delivery Systems Segment is Expected to Hold the Largest Share in the Gene Delivery Systems Market.
7. Are there any restraints impacting market growth?
High Cost of Treatment.
8. Can you provide examples of recent developments in the market?
In August 2022, Versant Ventures launched Vector BioPharma AG, a biopharmaceutical company developing a precision gene delivery platform devoid of viral genes.
9. What pricing options are available for accessing the report?
Pricing options include single-user, multi-user, and enterprise licenses priced at USD 4750, USD 5250, and USD 8750 respectively.
10. Is the market size provided in terms of value or volume?
The market size is provided in terms of value, measured in Million and volume, measured in K Unit.
11. Are there any specific market keywords associated with the report?
Yes, the market keyword associated with the report is "Gene Delivery System Industry," which aids in identifying and referencing the specific market segment covered.
12. How do I determine which pricing option suits my needs best?
The pricing options vary based on user requirements and access needs. Individual users may opt for single-user licenses, while businesses requiring broader access may choose multi-user or enterprise licenses for cost-effective access to the report.
13. Are there any additional resources or data provided in the Gene Delivery System Industry report?
While the report offers comprehensive insights, it's advisable to review the specific contents or supplementary materials provided to ascertain if additional resources or data are available.
14. How can I stay updated on further developments or reports in the Gene Delivery System Industry?
To stay informed about further developments, trends, and reports in the Gene Delivery System Industry, consider subscribing to industry newsletters, following relevant companies and organizations, or regularly checking reputable industry news sources and publications.
Methodology
Step 1 - Identification of Relevant Samples Size from Population Database


Step 2 - Approaches for Defining Global Market Size (Value, Volume* & Price*)

Note*: In applicable scenarios
Step 3 - Data Sources
Primary Research
- Web Analytics
- Survey Reports
- Research Institute
- Latest Research Reports
- Opinion Leaders
Secondary Research
- Annual Reports
- White Paper
- Latest Press Release
- Industry Association
- Paid Database
- Investor Presentations

Step 4 - Data Triangulation
Involves using different sources of information in order to increase the validity of a study
These sources are likely to be stakeholders in a program - participants, other researchers, program staff, other community members, and so on.
Then we put all data in single framework & apply various statistical tools to find out the dynamic on the market.
During the analysis stage, feedback from the stakeholder groups would be compared to determine areas of agreement as well as areas of divergence


