
Key Insights
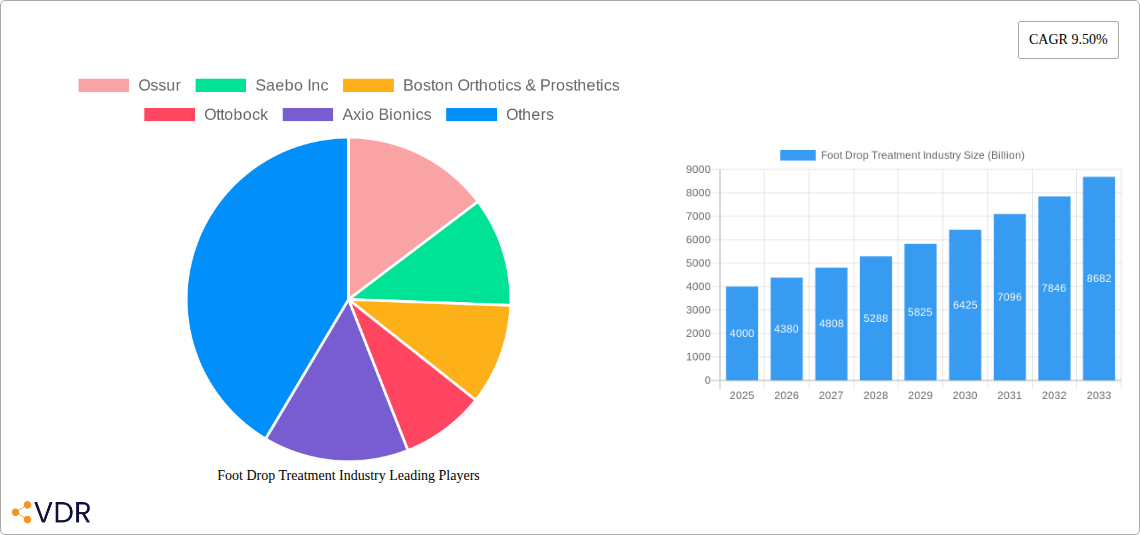
The global foot drop treatment market, valued at approximately $4 billion in 2025, is projected to experience robust growth, exhibiting a Compound Annual Growth Rate (CAGR) of 9.50% from 2025 to 2033. This expansion is driven by several key factors. The rising prevalence of neurological disorders like stroke, multiple sclerosis, and cerebral palsy, which frequently lead to foot drop, forms a significant market driver. Furthermore, advancements in medical technology, including the development of more sophisticated functional electrical stimulators (FES) and improved braces/splints, are enhancing treatment options and patient outcomes, thereby fueling market growth. Increased awareness regarding available treatments and improved access to healthcare services, particularly in developing economies, also contribute to market expansion. The market is segmented by product type (functional electrical stimulators, braces/splints) and application (neuropathy, muscle disorders, brain & spinal disorders). Functional electrical stimulators represent a high-growth segment due to their effectiveness in restoring mobility and reducing reliance on passive treatments. Geographically, North America currently holds a significant market share, attributable to the high prevalence of neurological disorders and advanced healthcare infrastructure. However, rapidly developing economies in Asia Pacific are expected to witness substantial growth in the coming years, driven by increasing healthcare expenditure and rising awareness. While the market faces restraints such as high treatment costs and potential side effects associated with some therapies, the overall growth trajectory remains positive, underpinned by a growing elderly population and the continuous innovation within the medical device sector.
The competitive landscape is characterized by a mix of established players like Ossur, Ottobock, and Bioness Inc., and smaller, specialized companies. These companies are engaged in continuous research and development to improve existing therapies and introduce innovative solutions. Strategic collaborations, mergers and acquisitions, and product launches are expected to further intensify competition and shape the market dynamics in the coming years. The forecast period, 2025-2033, anticipates a significant increase in market size, driven by the factors mentioned above. The market is expected to see a continued shift towards minimally invasive and technologically advanced treatments, creating opportunities for companies specializing in these areas. The focus will likely remain on improving patient outcomes, reducing treatment costs, and expanding access to care globally.
Foot Drop Treatment Industry Market Report: 2019-2033
This comprehensive report provides an in-depth analysis of the Foot Drop Treatment industry, encompassing market size, growth trends, competitive landscape, and future outlook. The study period covers 2019-2033, with 2025 serving as the base and estimated year. This report is essential for industry professionals, investors, and stakeholders seeking to understand and capitalize on opportunities within this dynamic market valued at xx Billion in 2025 and projected to reach xx Billion by 2033.
Foot Drop Treatment Industry Market Dynamics & Structure
The Foot Drop Treatment market, a sub-segment of the larger Orthopedic Devices market (Parent Market) and encompassing specific segments like Neuropathy Treatment (Child Market), is characterized by moderate concentration, with key players holding significant market share. Technological innovation, driven by advancements in FES (Functional Electrical Stimulation) and smart brace technologies, significantly shapes market dynamics. Stringent regulatory frameworks, particularly concerning medical device approvals (e.g., FDA approvals in the US), influence market entry and product development. Competitive pressure stems from both established players and emerging companies introducing innovative solutions. The market also experiences a growing demand driven by an aging population and increasing prevalence of neurological disorders. M&A activity is moderate, with strategic acquisitions aiming to expand product portfolios and geographic reach.
- Market Concentration: Moderately concentrated, with top 5 players holding approximately xx% market share in 2025.
- Technological Innovation: Significant advancements in FES, biofeedback, and smart sensor integration are driving growth.
- Regulatory Framework: Stringent regulatory approvals (e.g., FDA, CE Mark) influence market entry and product lifecycle.
- Competitive Substitutes: Conservative treatment methods and alternative therapies pose some competitive pressure.
- End-User Demographics: Aging population, increasing prevalence of neurological disorders, and rising healthcare expenditure are key drivers.
- M&A Trends: Moderate M&A activity observed, primarily focusing on expanding product portfolios and geographical reach. Approximately xx M&A deals were recorded between 2019 and 2024.
Foot Drop Treatment Industry Growth Trends & Insights
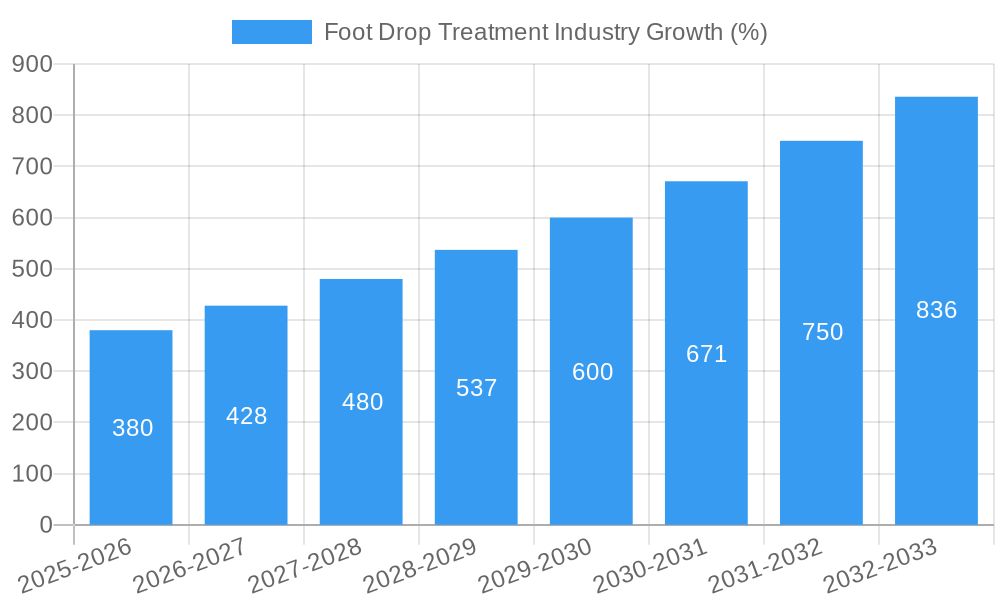
The Foot Drop Treatment market exhibits a steady growth trajectory, driven by factors such as the rising prevalence of neurological disorders like stroke, multiple sclerosis, and cerebral palsy. Technological advancements, including the introduction of sophisticated FES devices and smart braces, are accelerating market expansion. Increasing awareness about the condition and improved accessibility to advanced treatment options are also contributing to higher adoption rates. The market is witnessing a shift towards minimally invasive and personalized treatment approaches, further fueling growth. The market is expected to register a CAGR of xx% during the forecast period (2025-2033), reaching an estimated market value of xx Billion by 2033. Market penetration of FES devices is projected to increase from xx% in 2025 to xx% by 2033.
Dominant Regions, Countries, or Segments in Foot Drop Treatment Industry
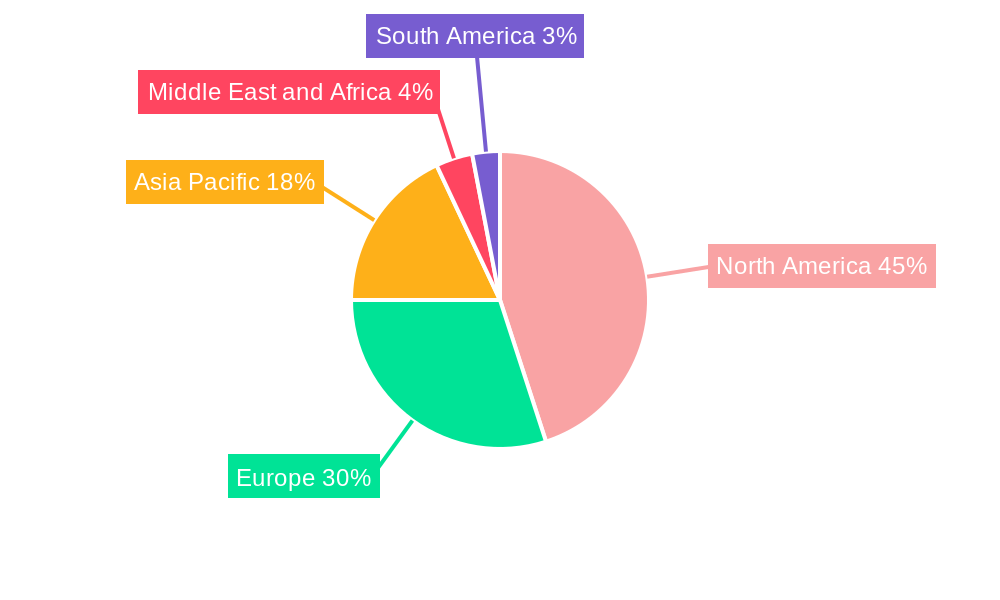
North America currently dominates the Foot Drop Treatment market, driven by high healthcare expenditure, advanced medical infrastructure, and a large patient population. Europe follows as a significant market, showcasing robust growth potential due to rising prevalence of neurological disorders and increasing investments in healthcare technology. Within product types, the Functional Electrical Stimulator (FES) segment is witnessing faster growth compared to braces/splints, propelled by technological advancements and improved efficacy. Among applications, the Neuropathy segment holds the largest share, followed by Muscle Disorders and Brain & Spinal Disorders segments.
- North America: High healthcare expenditure, advanced medical infrastructure, and large patient pool drive market dominance.
- Europe: Strong growth potential driven by rising prevalence of neurological disorders and healthcare technology investments.
- Asia-Pacific: High growth potential due to rising healthcare awareness, increasing disposable incomes, and expanding healthcare infrastructure. However, market penetration is currently lower compared to North America and Europe.
- Product Type: FES segment demonstrates faster growth due to technological advancements and improved clinical outcomes.
- Application: Neuropathy segment holds the largest market share, attributed to its high prevalence and significant unmet needs.
Foot Drop Treatment Industry Product Landscape
The Foot Drop Treatment market offers a diverse range of products, including FES devices, braces, and splints, each with unique features and functionalities. Recent innovations have focused on enhancing comfort, improving efficacy, and incorporating smart technologies. FES devices are evolving from bulky, complex systems to lightweight, user-friendly options with advanced features like personalized stimulation patterns and wireless connectivity. Braces and splints are incorporating advanced materials and designs to improve comfort, support, and mobility. The key selling propositions revolve around enhanced patient comfort, improved functional outcomes, and minimally invasive treatment approaches.
Key Drivers, Barriers & Challenges in Foot Drop Treatment Industry
Key Drivers:
- Rising prevalence of neurological disorders (stroke, MS, cerebral palsy).
- Technological advancements in FES and smart brace technologies.
- Increasing healthcare expenditure and insurance coverage.
- Growing awareness and patient education initiatives.
Key Challenges:
- High cost of advanced treatment options, limiting accessibility.
- Stringent regulatory approvals and reimbursement hurdles.
- Limited market penetration in developing countries due to infrastructure limitations.
- Intense competition among established players and new entrants. This translates to a xx% reduction in average profit margins for the top 5 players between 2024 and projected 2025.
Emerging Opportunities in Foot Drop Treatment Industry
- Expanding market penetration in developing economies.
- Development of personalized treatment solutions leveraging AI and machine learning.
- Integration of wearable sensors and telemedicine for remote monitoring and rehabilitation.
- Focus on innovative materials and designs to enhance comfort and effectiveness of braces and splints.
Growth Accelerators in the Foot Drop Treatment Industry
Technological breakthroughs such as improved battery life in FES devices, advanced algorithms for personalized treatment, and wireless connectivity are significantly accelerating market growth. Strategic partnerships between device manufacturers and rehabilitation centers expand market reach and improve patient access. Expansion into untapped markets in developing countries presents substantial growth potential.
Key Players Shaping the Foot Drop Treatment Industry Market
- Ossur
- Saebo Inc
- Boston Orthotics & Prosthetics
- Ottobock
- Axio Bionics
- Thrive Orthopedics
- Turbomed Orthotics
- Accelerated Care Plus Corporation
- Allard
- Bioness Inc
Notable Milestones in Foot Drop Treatment Industry Sector
- August 2022: Development of a new electrode-integrated Velcro sleeve for muscle stimulation in patients with neurological conditions. Market launch anticipated in 2023.
- March 2022: USFDA approval of Cionic's Neural Sleeve, a lightweight leg-worn device for movement analysis and augmentation.
In-Depth Foot Drop Treatment Industry Market Outlook
The Foot Drop Treatment market is poised for robust growth, driven by technological innovation, expanding patient populations, and increasing healthcare spending. Strategic partnerships, product diversification, and expansion into emerging markets present significant opportunities for market players. The development of personalized, minimally invasive treatments will further shape market dynamics in the coming years. The market's potential for growth is substantial, indicating a promising future for companies operating within this sector.
Foot Drop Treatment Industry Segmentation
-
1. Product Type
- 1.1. Functional Electrical Stimulator
- 1.2. Braces/Splints
-
2. Application
- 2.1. Neuropathy
- 2.2. Muscle Disorders
- 2.3. Brain & Spinal Disorders
Foot Drop Treatment Industry Segmentation By Geography
-
1. North America
- 1.1. United States
- 1.2. Canada
- 1.3. Mexico
-
2. Europe
- 2.1. Germany
- 2.2. United Kingdom
- 2.3. France
- 2.4. Italy
- 2.5. Spain
- 2.6. Rest of Europe
-
3. Asia Pacific
- 3.1. China
- 3.2. Japan
- 3.3. India
- 3.4. Australia
- 3.5. South Korea
- 3.6. Rest of Asia Pacific
-
4. Middle East and Africa
- 4.1. GCC
- 4.2. South Africa
- 4.3. Rest of Middle East and Africa
-
5. South America
- 5.1. Brazil
- 5.2. Argentina
- 5.3. Rest of South America
Foot Drop Treatment Industry REPORT HIGHLIGHTS
| Aspects | Details |
|---|---|
| Study Period | 2019-2033 |
| Base Year | 2024 |
| Estimated Year | 2025 |
| Forecast Period | 2025-2033 |
| Historical Period | 2019-2024 |
| Growth Rate | CAGR of 9.50% from 2019-2033 |
| Segmentation |
|
Table of Contents
- 1. Introduction
- 1.1. Research Scope
- 1.2. Market Segmentation
- 1.3. Research Methodology
- 1.4. Definitions and Assumptions
- 2. Executive Summary
- 2.1. Introduction
- 3. Market Dynamics
- 3.1. Introduction
- 3.2. Market Drivers
- 3.2.1. Growing Burden of Chronic Diseases; Advancements in Products
- 3.3. Market Restrains
- 3.3.1. High Cost of Functional Electrical Stimulators
- 3.4. Market Trends
- 3.4.1. Functional Electrical Stimulator Segment is Expected to Show a Significant Growth Rate in the Foot Drop Treatment Market
- 4. Market Factor Analysis
- 4.1. Porters Five Forces
- 4.2. Supply/Value Chain
- 4.3. PESTEL analysis
- 4.4. Market Entropy
- 4.5. Patent/Trademark Analysis
- 5. Global Foot Drop Treatment Industry Analysis, Insights and Forecast, 2019-2031
- 5.1. Market Analysis, Insights and Forecast - by Product Type
- 5.1.1. Functional Electrical Stimulator
- 5.1.2. Braces/Splints
- 5.2. Market Analysis, Insights and Forecast - by Application
- 5.2.1. Neuropathy
- 5.2.2. Muscle Disorders
- 5.2.3. Brain & Spinal Disorders
- 5.3. Market Analysis, Insights and Forecast - by Region
- 5.3.1. North America
- 5.3.2. Europe
- 5.3.3. Asia Pacific
- 5.3.4. Middle East and Africa
- 5.3.5. South America
- 5.1. Market Analysis, Insights and Forecast - by Product Type
- 6. North America Foot Drop Treatment Industry Analysis, Insights and Forecast, 2019-2031
- 6.1. Market Analysis, Insights and Forecast - by Product Type
- 6.1.1. Functional Electrical Stimulator
- 6.1.2. Braces/Splints
- 6.2. Market Analysis, Insights and Forecast - by Application
- 6.2.1. Neuropathy
- 6.2.2. Muscle Disorders
- 6.2.3. Brain & Spinal Disorders
- 6.1. Market Analysis, Insights and Forecast - by Product Type
- 7. Europe Foot Drop Treatment Industry Analysis, Insights and Forecast, 2019-2031
- 7.1. Market Analysis, Insights and Forecast - by Product Type
- 7.1.1. Functional Electrical Stimulator
- 7.1.2. Braces/Splints
- 7.2. Market Analysis, Insights and Forecast - by Application
- 7.2.1. Neuropathy
- 7.2.2. Muscle Disorders
- 7.2.3. Brain & Spinal Disorders
- 7.1. Market Analysis, Insights and Forecast - by Product Type
- 8. Asia Pacific Foot Drop Treatment Industry Analysis, Insights and Forecast, 2019-2031
- 8.1. Market Analysis, Insights and Forecast - by Product Type
- 8.1.1. Functional Electrical Stimulator
- 8.1.2. Braces/Splints
- 8.2. Market Analysis, Insights and Forecast - by Application
- 8.2.1. Neuropathy
- 8.2.2. Muscle Disorders
- 8.2.3. Brain & Spinal Disorders
- 8.1. Market Analysis, Insights and Forecast - by Product Type
- 9. Middle East and Africa Foot Drop Treatment Industry Analysis, Insights and Forecast, 2019-2031
- 9.1. Market Analysis, Insights and Forecast - by Product Type
- 9.1.1. Functional Electrical Stimulator
- 9.1.2. Braces/Splints
- 9.2. Market Analysis, Insights and Forecast - by Application
- 9.2.1. Neuropathy
- 9.2.2. Muscle Disorders
- 9.2.3. Brain & Spinal Disorders
- 9.1. Market Analysis, Insights and Forecast - by Product Type
- 10. South America Foot Drop Treatment Industry Analysis, Insights and Forecast, 2019-2031
- 10.1. Market Analysis, Insights and Forecast - by Product Type
- 10.1.1. Functional Electrical Stimulator
- 10.1.2. Braces/Splints
- 10.2. Market Analysis, Insights and Forecast - by Application
- 10.2.1. Neuropathy
- 10.2.2. Muscle Disorders
- 10.2.3. Brain & Spinal Disorders
- 10.1. Market Analysis, Insights and Forecast - by Product Type
- 11. North America Foot Drop Treatment Industry Analysis, Insights and Forecast, 2019-2031
- 11.1. Market Analysis, Insights and Forecast - By Country/Sub-region
- 11.1.1 United States
- 11.1.2 Canada
- 11.1.3 Mexico
- 12. Europe Foot Drop Treatment Industry Analysis, Insights and Forecast, 2019-2031
- 12.1. Market Analysis, Insights and Forecast - By Country/Sub-region
- 12.1.1 Germany
- 12.1.2 United Kingdom
- 12.1.3 France
- 12.1.4 Italy
- 12.1.5 Spain
- 12.1.6 Rest of Europe
- 13. Asia Pacific Foot Drop Treatment Industry Analysis, Insights and Forecast, 2019-2031
- 13.1. Market Analysis, Insights and Forecast - By Country/Sub-region
- 13.1.1 China
- 13.1.2 Japan
- 13.1.3 India
- 13.1.4 Australia
- 13.1.5 South Korea
- 13.1.6 Rest of Asia Pacific
- 14. Middle East and Africa Foot Drop Treatment Industry Analysis, Insights and Forecast, 2019-2031
- 14.1. Market Analysis, Insights and Forecast - By Country/Sub-region
- 14.1.1 GCC
- 14.1.2 South Africa
- 14.1.3 Rest of Middle East and Africa
- 15. South America Foot Drop Treatment Industry Analysis, Insights and Forecast, 2019-2031
- 15.1. Market Analysis, Insights and Forecast - By Country/Sub-region
- 15.1.1 Brazil
- 15.1.2 Argentina
- 15.1.3 Rest of South America
- 16. Competitive Analysis
- 16.1. Global Market Share Analysis 2024
- 16.2. Company Profiles
- 16.2.1 Ossur
- 16.2.1.1. Overview
- 16.2.1.2. Products
- 16.2.1.3. SWOT Analysis
- 16.2.1.4. Recent Developments
- 16.2.1.5. Financials (Based on Availability)
- 16.2.2 Saebo Inc
- 16.2.2.1. Overview
- 16.2.2.2. Products
- 16.2.2.3. SWOT Analysis
- 16.2.2.4. Recent Developments
- 16.2.2.5. Financials (Based on Availability)
- 16.2.3 Boston Orthotics & Prosthetics
- 16.2.3.1. Overview
- 16.2.3.2. Products
- 16.2.3.3. SWOT Analysis
- 16.2.3.4. Recent Developments
- 16.2.3.5. Financials (Based on Availability)
- 16.2.4 Ottobock
- 16.2.4.1. Overview
- 16.2.4.2. Products
- 16.2.4.3. SWOT Analysis
- 16.2.4.4. Recent Developments
- 16.2.4.5. Financials (Based on Availability)
- 16.2.5 Axio Bionics
- 16.2.5.1. Overview
- 16.2.5.2. Products
- 16.2.5.3. SWOT Analysis
- 16.2.5.4. Recent Developments
- 16.2.5.5. Financials (Based on Availability)
- 16.2.6 Thrive Orthopedics
- 16.2.6.1. Overview
- 16.2.6.2. Products
- 16.2.6.3. SWOT Analysis
- 16.2.6.4. Recent Developments
- 16.2.6.5. Financials (Based on Availability)
- 16.2.7 Turbomed Orthotics*List Not Exhaustive
- 16.2.7.1. Overview
- 16.2.7.2. Products
- 16.2.7.3. SWOT Analysis
- 16.2.7.4. Recent Developments
- 16.2.7.5. Financials (Based on Availability)
- 16.2.8 Accelerated Care Plus Corporation
- 16.2.8.1. Overview
- 16.2.8.2. Products
- 16.2.8.3. SWOT Analysis
- 16.2.8.4. Recent Developments
- 16.2.8.5. Financials (Based on Availability)
- 16.2.9 Allard
- 16.2.9.1. Overview
- 16.2.9.2. Products
- 16.2.9.3. SWOT Analysis
- 16.2.9.4. Recent Developments
- 16.2.9.5. Financials (Based on Availability)
- 16.2.10 Bioness Inc
- 16.2.10.1. Overview
- 16.2.10.2. Products
- 16.2.10.3. SWOT Analysis
- 16.2.10.4. Recent Developments
- 16.2.10.5. Financials (Based on Availability)
- 16.2.1 Ossur
List of Figures
- Figure 1: Global Foot Drop Treatment Industry Revenue Breakdown (Billion, %) by Region 2024 & 2032
- Figure 2: Global Foot Drop Treatment Industry Volume Breakdown (Piece, %) by Region 2024 & 2032
- Figure 3: North America Foot Drop Treatment Industry Revenue (Billion), by Country 2024 & 2032
- Figure 4: North America Foot Drop Treatment Industry Volume (Piece), by Country 2024 & 2032
- Figure 5: North America Foot Drop Treatment Industry Revenue Share (%), by Country 2024 & 2032
- Figure 6: North America Foot Drop Treatment Industry Volume Share (%), by Country 2024 & 2032
- Figure 7: Europe Foot Drop Treatment Industry Revenue (Billion), by Country 2024 & 2032
- Figure 8: Europe Foot Drop Treatment Industry Volume (Piece), by Country 2024 & 2032
- Figure 9: Europe Foot Drop Treatment Industry Revenue Share (%), by Country 2024 & 2032
- Figure 10: Europe Foot Drop Treatment Industry Volume Share (%), by Country 2024 & 2032
- Figure 11: Asia Pacific Foot Drop Treatment Industry Revenue (Billion), by Country 2024 & 2032
- Figure 12: Asia Pacific Foot Drop Treatment Industry Volume (Piece), by Country 2024 & 2032
- Figure 13: Asia Pacific Foot Drop Treatment Industry Revenue Share (%), by Country 2024 & 2032
- Figure 14: Asia Pacific Foot Drop Treatment Industry Volume Share (%), by Country 2024 & 2032
- Figure 15: Middle East and Africa Foot Drop Treatment Industry Revenue (Billion), by Country 2024 & 2032
- Figure 16: Middle East and Africa Foot Drop Treatment Industry Volume (Piece), by Country 2024 & 2032
- Figure 17: Middle East and Africa Foot Drop Treatment Industry Revenue Share (%), by Country 2024 & 2032
- Figure 18: Middle East and Africa Foot Drop Treatment Industry Volume Share (%), by Country 2024 & 2032
- Figure 19: South America Foot Drop Treatment Industry Revenue (Billion), by Country 2024 & 2032
- Figure 20: South America Foot Drop Treatment Industry Volume (Piece), by Country 2024 & 2032
- Figure 21: South America Foot Drop Treatment Industry Revenue Share (%), by Country 2024 & 2032
- Figure 22: South America Foot Drop Treatment Industry Volume Share (%), by Country 2024 & 2032
- Figure 23: North America Foot Drop Treatment Industry Revenue (Billion), by Product Type 2024 & 2032
- Figure 24: North America Foot Drop Treatment Industry Volume (Piece), by Product Type 2024 & 2032
- Figure 25: North America Foot Drop Treatment Industry Revenue Share (%), by Product Type 2024 & 2032
- Figure 26: North America Foot Drop Treatment Industry Volume Share (%), by Product Type 2024 & 2032
- Figure 27: North America Foot Drop Treatment Industry Revenue (Billion), by Application 2024 & 2032
- Figure 28: North America Foot Drop Treatment Industry Volume (Piece), by Application 2024 & 2032
- Figure 29: North America Foot Drop Treatment Industry Revenue Share (%), by Application 2024 & 2032
- Figure 30: North America Foot Drop Treatment Industry Volume Share (%), by Application 2024 & 2032
- Figure 31: North America Foot Drop Treatment Industry Revenue (Billion), by Country 2024 & 2032
- Figure 32: North America Foot Drop Treatment Industry Volume (Piece), by Country 2024 & 2032
- Figure 33: North America Foot Drop Treatment Industry Revenue Share (%), by Country 2024 & 2032
- Figure 34: North America Foot Drop Treatment Industry Volume Share (%), by Country 2024 & 2032
- Figure 35: Europe Foot Drop Treatment Industry Revenue (Billion), by Product Type 2024 & 2032
- Figure 36: Europe Foot Drop Treatment Industry Volume (Piece), by Product Type 2024 & 2032
- Figure 37: Europe Foot Drop Treatment Industry Revenue Share (%), by Product Type 2024 & 2032
- Figure 38: Europe Foot Drop Treatment Industry Volume Share (%), by Product Type 2024 & 2032
- Figure 39: Europe Foot Drop Treatment Industry Revenue (Billion), by Application 2024 & 2032
- Figure 40: Europe Foot Drop Treatment Industry Volume (Piece), by Application 2024 & 2032
- Figure 41: Europe Foot Drop Treatment Industry Revenue Share (%), by Application 2024 & 2032
- Figure 42: Europe Foot Drop Treatment Industry Volume Share (%), by Application 2024 & 2032
- Figure 43: Europe Foot Drop Treatment Industry Revenue (Billion), by Country 2024 & 2032
- Figure 44: Europe Foot Drop Treatment Industry Volume (Piece), by Country 2024 & 2032
- Figure 45: Europe Foot Drop Treatment Industry Revenue Share (%), by Country 2024 & 2032
- Figure 46: Europe Foot Drop Treatment Industry Volume Share (%), by Country 2024 & 2032
- Figure 47: Asia Pacific Foot Drop Treatment Industry Revenue (Billion), by Product Type 2024 & 2032
- Figure 48: Asia Pacific Foot Drop Treatment Industry Volume (Piece), by Product Type 2024 & 2032
- Figure 49: Asia Pacific Foot Drop Treatment Industry Revenue Share (%), by Product Type 2024 & 2032
- Figure 50: Asia Pacific Foot Drop Treatment Industry Volume Share (%), by Product Type 2024 & 2032
- Figure 51: Asia Pacific Foot Drop Treatment Industry Revenue (Billion), by Application 2024 & 2032
- Figure 52: Asia Pacific Foot Drop Treatment Industry Volume (Piece), by Application 2024 & 2032
- Figure 53: Asia Pacific Foot Drop Treatment Industry Revenue Share (%), by Application 2024 & 2032
- Figure 54: Asia Pacific Foot Drop Treatment Industry Volume Share (%), by Application 2024 & 2032
- Figure 55: Asia Pacific Foot Drop Treatment Industry Revenue (Billion), by Country 2024 & 2032
- Figure 56: Asia Pacific Foot Drop Treatment Industry Volume (Piece), by Country 2024 & 2032
- Figure 57: Asia Pacific Foot Drop Treatment Industry Revenue Share (%), by Country 2024 & 2032
- Figure 58: Asia Pacific Foot Drop Treatment Industry Volume Share (%), by Country 2024 & 2032
- Figure 59: Middle East and Africa Foot Drop Treatment Industry Revenue (Billion), by Product Type 2024 & 2032
- Figure 60: Middle East and Africa Foot Drop Treatment Industry Volume (Piece), by Product Type 2024 & 2032
- Figure 61: Middle East and Africa Foot Drop Treatment Industry Revenue Share (%), by Product Type 2024 & 2032
- Figure 62: Middle East and Africa Foot Drop Treatment Industry Volume Share (%), by Product Type 2024 & 2032
- Figure 63: Middle East and Africa Foot Drop Treatment Industry Revenue (Billion), by Application 2024 & 2032
- Figure 64: Middle East and Africa Foot Drop Treatment Industry Volume (Piece), by Application 2024 & 2032
- Figure 65: Middle East and Africa Foot Drop Treatment Industry Revenue Share (%), by Application 2024 & 2032
- Figure 66: Middle East and Africa Foot Drop Treatment Industry Volume Share (%), by Application 2024 & 2032
- Figure 67: Middle East and Africa Foot Drop Treatment Industry Revenue (Billion), by Country 2024 & 2032
- Figure 68: Middle East and Africa Foot Drop Treatment Industry Volume (Piece), by Country 2024 & 2032
- Figure 69: Middle East and Africa Foot Drop Treatment Industry Revenue Share (%), by Country 2024 & 2032
- Figure 70: Middle East and Africa Foot Drop Treatment Industry Volume Share (%), by Country 2024 & 2032
- Figure 71: South America Foot Drop Treatment Industry Revenue (Billion), by Product Type 2024 & 2032
- Figure 72: South America Foot Drop Treatment Industry Volume (Piece), by Product Type 2024 & 2032
- Figure 73: South America Foot Drop Treatment Industry Revenue Share (%), by Product Type 2024 & 2032
- Figure 74: South America Foot Drop Treatment Industry Volume Share (%), by Product Type 2024 & 2032
- Figure 75: South America Foot Drop Treatment Industry Revenue (Billion), by Application 2024 & 2032
- Figure 76: South America Foot Drop Treatment Industry Volume (Piece), by Application 2024 & 2032
- Figure 77: South America Foot Drop Treatment Industry Revenue Share (%), by Application 2024 & 2032
- Figure 78: South America Foot Drop Treatment Industry Volume Share (%), by Application 2024 & 2032
- Figure 79: South America Foot Drop Treatment Industry Revenue (Billion), by Country 2024 & 2032
- Figure 80: South America Foot Drop Treatment Industry Volume (Piece), by Country 2024 & 2032
- Figure 81: South America Foot Drop Treatment Industry Revenue Share (%), by Country 2024 & 2032
- Figure 82: South America Foot Drop Treatment Industry Volume Share (%), by Country 2024 & 2032
List of Tables
- Table 1: Global Foot Drop Treatment Industry Revenue Billion Forecast, by Region 2019 & 2032
- Table 2: Global Foot Drop Treatment Industry Volume Piece Forecast, by Region 2019 & 2032
- Table 3: Global Foot Drop Treatment Industry Revenue Billion Forecast, by Product Type 2019 & 2032
- Table 4: Global Foot Drop Treatment Industry Volume Piece Forecast, by Product Type 2019 & 2032
- Table 5: Global Foot Drop Treatment Industry Revenue Billion Forecast, by Application 2019 & 2032
- Table 6: Global Foot Drop Treatment Industry Volume Piece Forecast, by Application 2019 & 2032
- Table 7: Global Foot Drop Treatment Industry Revenue Billion Forecast, by Region 2019 & 2032
- Table 8: Global Foot Drop Treatment Industry Volume Piece Forecast, by Region 2019 & 2032
- Table 9: Global Foot Drop Treatment Industry Revenue Billion Forecast, by Country 2019 & 2032
- Table 10: Global Foot Drop Treatment Industry Volume Piece Forecast, by Country 2019 & 2032
- Table 11: United States Foot Drop Treatment Industry Revenue (Billion) Forecast, by Application 2019 & 2032
- Table 12: United States Foot Drop Treatment Industry Volume (Piece) Forecast, by Application 2019 & 2032
- Table 13: Canada Foot Drop Treatment Industry Revenue (Billion) Forecast, by Application 2019 & 2032
- Table 14: Canada Foot Drop Treatment Industry Volume (Piece) Forecast, by Application 2019 & 2032
- Table 15: Mexico Foot Drop Treatment Industry Revenue (Billion) Forecast, by Application 2019 & 2032
- Table 16: Mexico Foot Drop Treatment Industry Volume (Piece) Forecast, by Application 2019 & 2032
- Table 17: Global Foot Drop Treatment Industry Revenue Billion Forecast, by Country 2019 & 2032
- Table 18: Global Foot Drop Treatment Industry Volume Piece Forecast, by Country 2019 & 2032
- Table 19: Germany Foot Drop Treatment Industry Revenue (Billion) Forecast, by Application 2019 & 2032
- Table 20: Germany Foot Drop Treatment Industry Volume (Piece) Forecast, by Application 2019 & 2032
- Table 21: United Kingdom Foot Drop Treatment Industry Revenue (Billion) Forecast, by Application 2019 & 2032
- Table 22: United Kingdom Foot Drop Treatment Industry Volume (Piece) Forecast, by Application 2019 & 2032
- Table 23: France Foot Drop Treatment Industry Revenue (Billion) Forecast, by Application 2019 & 2032
- Table 24: France Foot Drop Treatment Industry Volume (Piece) Forecast, by Application 2019 & 2032
- Table 25: Italy Foot Drop Treatment Industry Revenue (Billion) Forecast, by Application 2019 & 2032
- Table 26: Italy Foot Drop Treatment Industry Volume (Piece) Forecast, by Application 2019 & 2032
- Table 27: Spain Foot Drop Treatment Industry Revenue (Billion) Forecast, by Application 2019 & 2032
- Table 28: Spain Foot Drop Treatment Industry Volume (Piece) Forecast, by Application 2019 & 2032
- Table 29: Rest of Europe Foot Drop Treatment Industry Revenue (Billion) Forecast, by Application 2019 & 2032
- Table 30: Rest of Europe Foot Drop Treatment Industry Volume (Piece) Forecast, by Application 2019 & 2032
- Table 31: Global Foot Drop Treatment Industry Revenue Billion Forecast, by Country 2019 & 2032
- Table 32: Global Foot Drop Treatment Industry Volume Piece Forecast, by Country 2019 & 2032
- Table 33: China Foot Drop Treatment Industry Revenue (Billion) Forecast, by Application 2019 & 2032
- Table 34: China Foot Drop Treatment Industry Volume (Piece) Forecast, by Application 2019 & 2032
- Table 35: Japan Foot Drop Treatment Industry Revenue (Billion) Forecast, by Application 2019 & 2032
- Table 36: Japan Foot Drop Treatment Industry Volume (Piece) Forecast, by Application 2019 & 2032
- Table 37: India Foot Drop Treatment Industry Revenue (Billion) Forecast, by Application 2019 & 2032
- Table 38: India Foot Drop Treatment Industry Volume (Piece) Forecast, by Application 2019 & 2032
- Table 39: Australia Foot Drop Treatment Industry Revenue (Billion) Forecast, by Application 2019 & 2032
- Table 40: Australia Foot Drop Treatment Industry Volume (Piece) Forecast, by Application 2019 & 2032
- Table 41: South Korea Foot Drop Treatment Industry Revenue (Billion) Forecast, by Application 2019 & 2032
- Table 42: South Korea Foot Drop Treatment Industry Volume (Piece) Forecast, by Application 2019 & 2032
- Table 43: Rest of Asia Pacific Foot Drop Treatment Industry Revenue (Billion) Forecast, by Application 2019 & 2032
- Table 44: Rest of Asia Pacific Foot Drop Treatment Industry Volume (Piece) Forecast, by Application 2019 & 2032
- Table 45: Global Foot Drop Treatment Industry Revenue Billion Forecast, by Country 2019 & 2032
- Table 46: Global Foot Drop Treatment Industry Volume Piece Forecast, by Country 2019 & 2032
- Table 47: GCC Foot Drop Treatment Industry Revenue (Billion) Forecast, by Application 2019 & 2032
- Table 48: GCC Foot Drop Treatment Industry Volume (Piece) Forecast, by Application 2019 & 2032
- Table 49: South Africa Foot Drop Treatment Industry Revenue (Billion) Forecast, by Application 2019 & 2032
- Table 50: South Africa Foot Drop Treatment Industry Volume (Piece) Forecast, by Application 2019 & 2032
- Table 51: Rest of Middle East and Africa Foot Drop Treatment Industry Revenue (Billion) Forecast, by Application 2019 & 2032
- Table 52: Rest of Middle East and Africa Foot Drop Treatment Industry Volume (Piece) Forecast, by Application 2019 & 2032
- Table 53: Global Foot Drop Treatment Industry Revenue Billion Forecast, by Country 2019 & 2032
- Table 54: Global Foot Drop Treatment Industry Volume Piece Forecast, by Country 2019 & 2032
- Table 55: Brazil Foot Drop Treatment Industry Revenue (Billion) Forecast, by Application 2019 & 2032
- Table 56: Brazil Foot Drop Treatment Industry Volume (Piece) Forecast, by Application 2019 & 2032
- Table 57: Argentina Foot Drop Treatment Industry Revenue (Billion) Forecast, by Application 2019 & 2032
- Table 58: Argentina Foot Drop Treatment Industry Volume (Piece) Forecast, by Application 2019 & 2032
- Table 59: Rest of South America Foot Drop Treatment Industry Revenue (Billion) Forecast, by Application 2019 & 2032
- Table 60: Rest of South America Foot Drop Treatment Industry Volume (Piece) Forecast, by Application 2019 & 2032
- Table 61: Global Foot Drop Treatment Industry Revenue Billion Forecast, by Product Type 2019 & 2032
- Table 62: Global Foot Drop Treatment Industry Volume Piece Forecast, by Product Type 2019 & 2032
- Table 63: Global Foot Drop Treatment Industry Revenue Billion Forecast, by Application 2019 & 2032
- Table 64: Global Foot Drop Treatment Industry Volume Piece Forecast, by Application 2019 & 2032
- Table 65: Global Foot Drop Treatment Industry Revenue Billion Forecast, by Country 2019 & 2032
- Table 66: Global Foot Drop Treatment Industry Volume Piece Forecast, by Country 2019 & 2032
- Table 67: United States Foot Drop Treatment Industry Revenue (Billion) Forecast, by Application 2019 & 2032
- Table 68: United States Foot Drop Treatment Industry Volume (Piece) Forecast, by Application 2019 & 2032
- Table 69: Canada Foot Drop Treatment Industry Revenue (Billion) Forecast, by Application 2019 & 2032
- Table 70: Canada Foot Drop Treatment Industry Volume (Piece) Forecast, by Application 2019 & 2032
- Table 71: Mexico Foot Drop Treatment Industry Revenue (Billion) Forecast, by Application 2019 & 2032
- Table 72: Mexico Foot Drop Treatment Industry Volume (Piece) Forecast, by Application 2019 & 2032
- Table 73: Global Foot Drop Treatment Industry Revenue Billion Forecast, by Product Type 2019 & 2032
- Table 74: Global Foot Drop Treatment Industry Volume Piece Forecast, by Product Type 2019 & 2032
- Table 75: Global Foot Drop Treatment Industry Revenue Billion Forecast, by Application 2019 & 2032
- Table 76: Global Foot Drop Treatment Industry Volume Piece Forecast, by Application 2019 & 2032
- Table 77: Global Foot Drop Treatment Industry Revenue Billion Forecast, by Country 2019 & 2032
- Table 78: Global Foot Drop Treatment Industry Volume Piece Forecast, by Country 2019 & 2032
- Table 79: Germany Foot Drop Treatment Industry Revenue (Billion) Forecast, by Application 2019 & 2032
- Table 80: Germany Foot Drop Treatment Industry Volume (Piece) Forecast, by Application 2019 & 2032
- Table 81: United Kingdom Foot Drop Treatment Industry Revenue (Billion) Forecast, by Application 2019 & 2032
- Table 82: United Kingdom Foot Drop Treatment Industry Volume (Piece) Forecast, by Application 2019 & 2032
- Table 83: France Foot Drop Treatment Industry Revenue (Billion) Forecast, by Application 2019 & 2032
- Table 84: France Foot Drop Treatment Industry Volume (Piece) Forecast, by Application 2019 & 2032
- Table 85: Italy Foot Drop Treatment Industry Revenue (Billion) Forecast, by Application 2019 & 2032
- Table 86: Italy Foot Drop Treatment Industry Volume (Piece) Forecast, by Application 2019 & 2032
- Table 87: Spain Foot Drop Treatment Industry Revenue (Billion) Forecast, by Application 2019 & 2032
- Table 88: Spain Foot Drop Treatment Industry Volume (Piece) Forecast, by Application 2019 & 2032
- Table 89: Rest of Europe Foot Drop Treatment Industry Revenue (Billion) Forecast, by Application 2019 & 2032
- Table 90: Rest of Europe Foot Drop Treatment Industry Volume (Piece) Forecast, by Application 2019 & 2032
- Table 91: Global Foot Drop Treatment Industry Revenue Billion Forecast, by Product Type 2019 & 2032
- Table 92: Global Foot Drop Treatment Industry Volume Piece Forecast, by Product Type 2019 & 2032
- Table 93: Global Foot Drop Treatment Industry Revenue Billion Forecast, by Application 2019 & 2032
- Table 94: Global Foot Drop Treatment Industry Volume Piece Forecast, by Application 2019 & 2032
- Table 95: Global Foot Drop Treatment Industry Revenue Billion Forecast, by Country 2019 & 2032
- Table 96: Global Foot Drop Treatment Industry Volume Piece Forecast, by Country 2019 & 2032
- Table 97: China Foot Drop Treatment Industry Revenue (Billion) Forecast, by Application 2019 & 2032
- Table 98: China Foot Drop Treatment Industry Volume (Piece) Forecast, by Application 2019 & 2032
- Table 99: Japan Foot Drop Treatment Industry Revenue (Billion) Forecast, by Application 2019 & 2032
- Table 100: Japan Foot Drop Treatment Industry Volume (Piece) Forecast, by Application 2019 & 2032
- Table 101: India Foot Drop Treatment Industry Revenue (Billion) Forecast, by Application 2019 & 2032
- Table 102: India Foot Drop Treatment Industry Volume (Piece) Forecast, by Application 2019 & 2032
- Table 103: Australia Foot Drop Treatment Industry Revenue (Billion) Forecast, by Application 2019 & 2032
- Table 104: Australia Foot Drop Treatment Industry Volume (Piece) Forecast, by Application 2019 & 2032
- Table 105: South Korea Foot Drop Treatment Industry Revenue (Billion) Forecast, by Application 2019 & 2032
- Table 106: South Korea Foot Drop Treatment Industry Volume (Piece) Forecast, by Application 2019 & 2032
- Table 107: Rest of Asia Pacific Foot Drop Treatment Industry Revenue (Billion) Forecast, by Application 2019 & 2032
- Table 108: Rest of Asia Pacific Foot Drop Treatment Industry Volume (Piece) Forecast, by Application 2019 & 2032
- Table 109: Global Foot Drop Treatment Industry Revenue Billion Forecast, by Product Type 2019 & 2032
- Table 110: Global Foot Drop Treatment Industry Volume Piece Forecast, by Product Type 2019 & 2032
- Table 111: Global Foot Drop Treatment Industry Revenue Billion Forecast, by Application 2019 & 2032
- Table 112: Global Foot Drop Treatment Industry Volume Piece Forecast, by Application 2019 & 2032
- Table 113: Global Foot Drop Treatment Industry Revenue Billion Forecast, by Country 2019 & 2032
- Table 114: Global Foot Drop Treatment Industry Volume Piece Forecast, by Country 2019 & 2032
- Table 115: GCC Foot Drop Treatment Industry Revenue (Billion) Forecast, by Application 2019 & 2032
- Table 116: GCC Foot Drop Treatment Industry Volume (Piece) Forecast, by Application 2019 & 2032
- Table 117: South Africa Foot Drop Treatment Industry Revenue (Billion) Forecast, by Application 2019 & 2032
- Table 118: South Africa Foot Drop Treatment Industry Volume (Piece) Forecast, by Application 2019 & 2032
- Table 119: Rest of Middle East and Africa Foot Drop Treatment Industry Revenue (Billion) Forecast, by Application 2019 & 2032
- Table 120: Rest of Middle East and Africa Foot Drop Treatment Industry Volume (Piece) Forecast, by Application 2019 & 2032
- Table 121: Global Foot Drop Treatment Industry Revenue Billion Forecast, by Product Type 2019 & 2032
- Table 122: Global Foot Drop Treatment Industry Volume Piece Forecast, by Product Type 2019 & 2032
- Table 123: Global Foot Drop Treatment Industry Revenue Billion Forecast, by Application 2019 & 2032
- Table 124: Global Foot Drop Treatment Industry Volume Piece Forecast, by Application 2019 & 2032
- Table 125: Global Foot Drop Treatment Industry Revenue Billion Forecast, by Country 2019 & 2032
- Table 126: Global Foot Drop Treatment Industry Volume Piece Forecast, by Country 2019 & 2032
- Table 127: Brazil Foot Drop Treatment Industry Revenue (Billion) Forecast, by Application 2019 & 2032
- Table 128: Brazil Foot Drop Treatment Industry Volume (Piece) Forecast, by Application 2019 & 2032
- Table 129: Argentina Foot Drop Treatment Industry Revenue (Billion) Forecast, by Application 2019 & 2032
- Table 130: Argentina Foot Drop Treatment Industry Volume (Piece) Forecast, by Application 2019 & 2032
- Table 131: Rest of South America Foot Drop Treatment Industry Revenue (Billion) Forecast, by Application 2019 & 2032
- Table 132: Rest of South America Foot Drop Treatment Industry Volume (Piece) Forecast, by Application 2019 & 2032
Frequently Asked Questions
1. What is the projected Compound Annual Growth Rate (CAGR) of the Foot Drop Treatment Industry?
The projected CAGR is approximately 9.50%.
2. Which companies are prominent players in the Foot Drop Treatment Industry?
Key companies in the market include Ossur, Saebo Inc, Boston Orthotics & Prosthetics, Ottobock, Axio Bionics, Thrive Orthopedics, Turbomed Orthotics*List Not Exhaustive, Accelerated Care Plus Corporation, Allard, Bioness Inc.
3. What are the main segments of the Foot Drop Treatment Industry?
The market segments include Product Type, Application.
4. Can you provide details about the market size?
The market size is estimated to be USD 4 Billion as of 2022.
5. What are some drivers contributing to market growth?
Growing Burden of Chronic Diseases; Advancements in Products.
6. What are the notable trends driving market growth?
Functional Electrical Stimulator Segment is Expected to Show a Significant Growth Rate in the Foot Drop Treatment Market.
7. Are there any restraints impacting market growth?
High Cost of Functional Electrical Stimulators.
8. Can you provide examples of recent developments in the market?
As per the news published in August 2022, a Velcro sleeve fastened around the leg has been designed with electrodes that help stimulate the muscles of those who experience difficulty getting around due to nervous system conditions. This device will be ready for delivery to those who have experienced a stroke, or have multiple sclerosis or cerebral palsy, in 2023.
9. What pricing options are available for accessing the report?
Pricing options include single-user, multi-user, and enterprise licenses priced at USD 4750, USD 5250, and USD 8750 respectively.
10. Is the market size provided in terms of value or volume?
The market size is provided in terms of value, measured in Billion and volume, measured in Piece.
11. Are there any specific market keywords associated with the report?
Yes, the market keyword associated with the report is "Foot Drop Treatment Industry," which aids in identifying and referencing the specific market segment covered.
12. How do I determine which pricing option suits my needs best?
The pricing options vary based on user requirements and access needs. Individual users may opt for single-user licenses, while businesses requiring broader access may choose multi-user or enterprise licenses for cost-effective access to the report.
13. Are there any additional resources or data provided in the Foot Drop Treatment Industry report?
While the report offers comprehensive insights, it's advisable to review the specific contents or supplementary materials provided to ascertain if additional resources or data are available.
14. How can I stay updated on further developments or reports in the Foot Drop Treatment Industry?
To stay informed about further developments, trends, and reports in the Foot Drop Treatment Industry, consider subscribing to industry newsletters, following relevant companies and organizations, or regularly checking reputable industry news sources and publications.
Methodology
Step 1 - Identification of Relevant Samples Size from Population Database


Step 2 - Approaches for Defining Global Market Size (Value, Volume* & Price*)

Note*: In applicable scenarios
Step 3 - Data Sources
Primary Research
- Web Analytics
- Survey Reports
- Research Institute
- Latest Research Reports
- Opinion Leaders
Secondary Research
- Annual Reports
- White Paper
- Latest Press Release
- Industry Association
- Paid Database
- Investor Presentations

Step 4 - Data Triangulation
Involves using different sources of information in order to increase the validity of a study
These sources are likely to be stakeholders in a program - participants, other researchers, program staff, other community members, and so on.
Then we put all data in single framework & apply various statistical tools to find out the dynamic on the market.
During the analysis stage, feedback from the stakeholder groups would be compared to determine areas of agreement as well as areas of divergence


