

Key Insights
The European natural gas market, valued at $401.9 billion in 2025, is projected for substantial growth with a Compound Annual Growth Rate (CAGR) of 1.4% between 2025 and 2033. This expansion is driven by rising energy demand from industrialization and population growth, where natural gas plays a vital role in power generation and industrial processes. Furthermore, its function as a transitional fuel during the shift to renewables sustains demand in the short to medium term. Key market restraints include geopolitical instability, supply chain disruptions, and the long-term transition towards renewable energy sources. Major players such as Chevron Corporation, BP PLC, and Shell PLC are strategically positioned within this dynamic market. Market segmentation varies across European regions, influenced by industrial needs, climate, and the pace of renewable energy adoption.
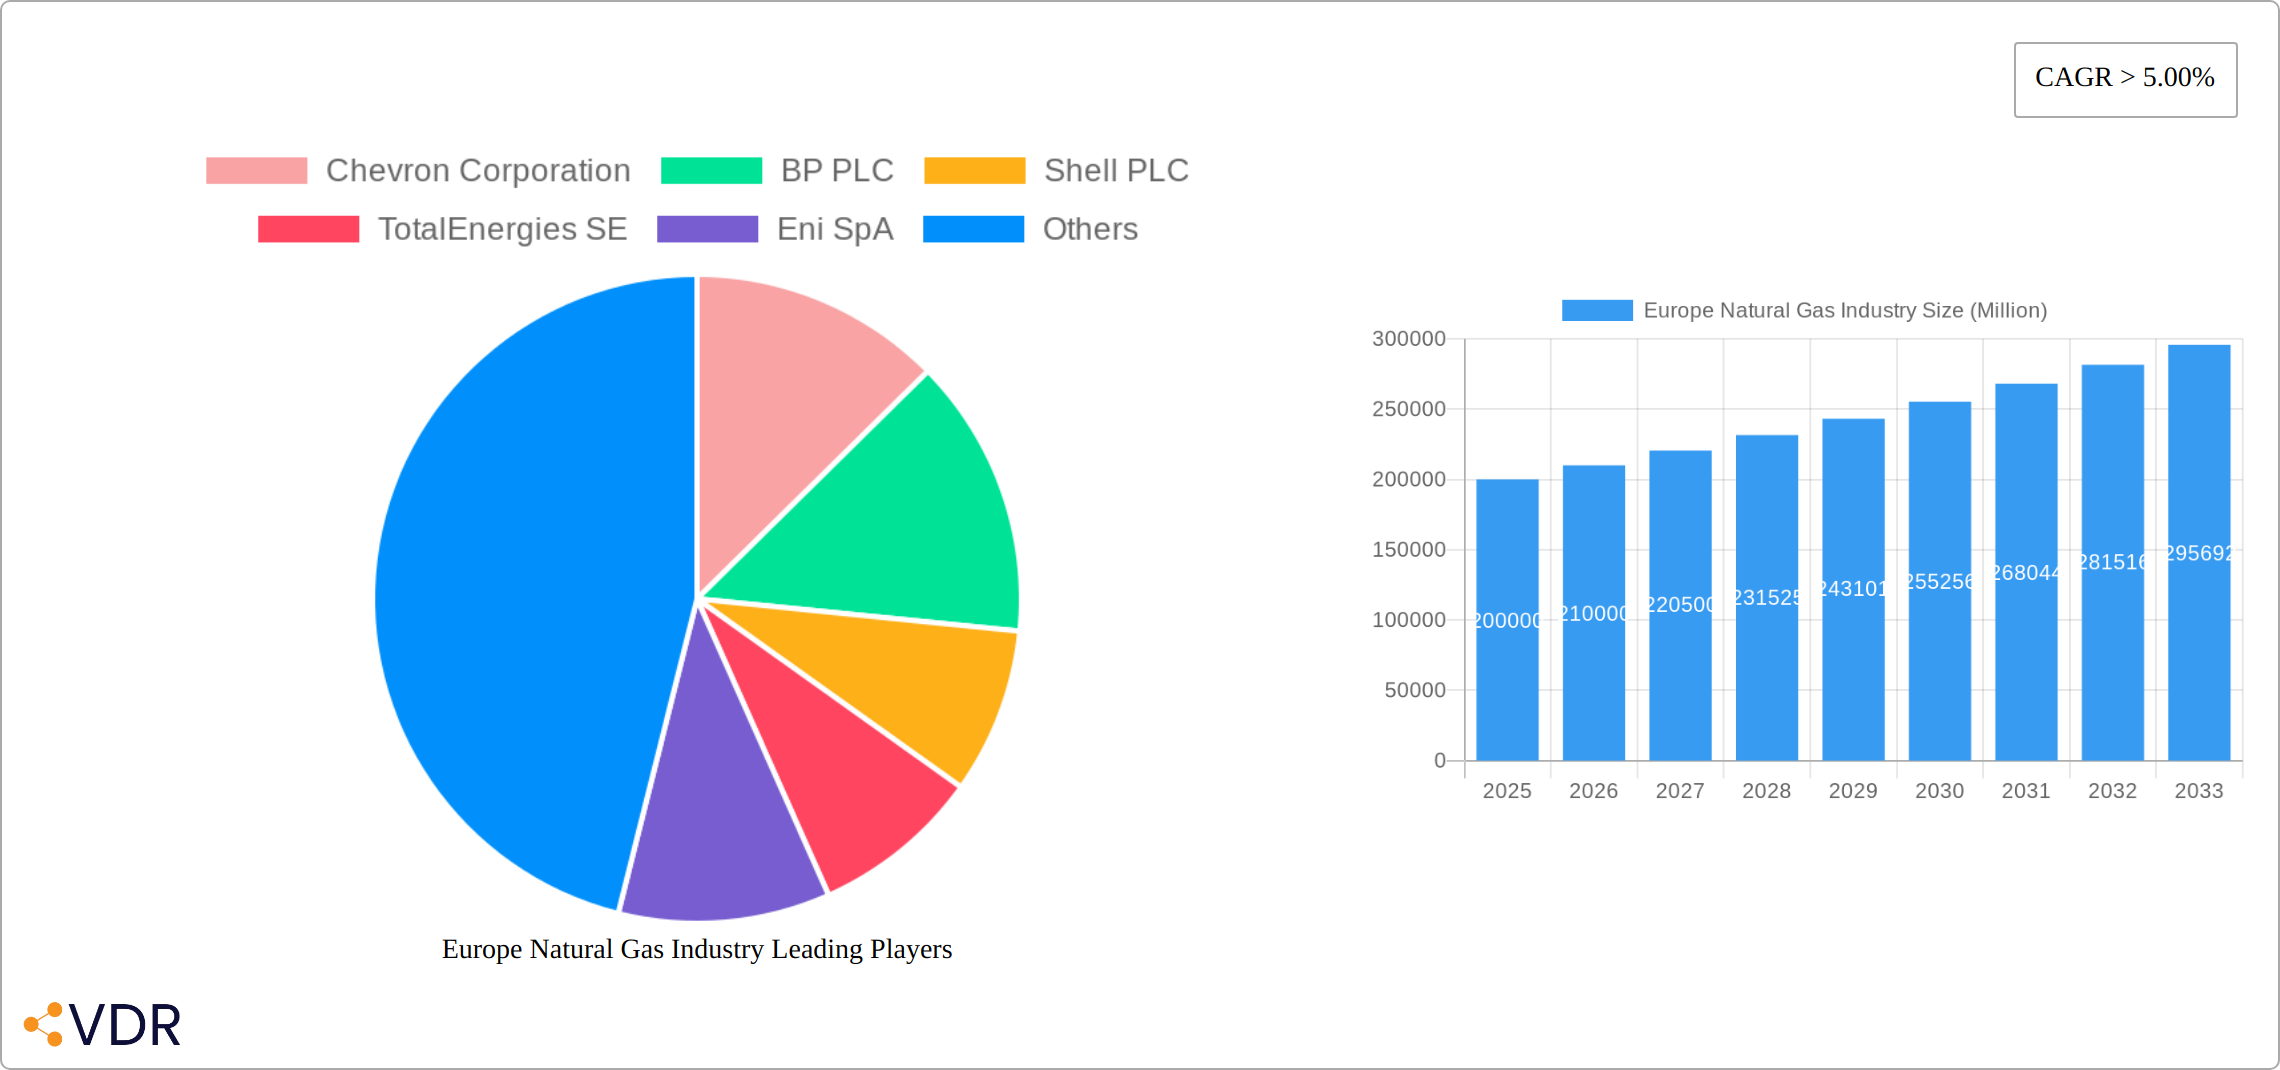
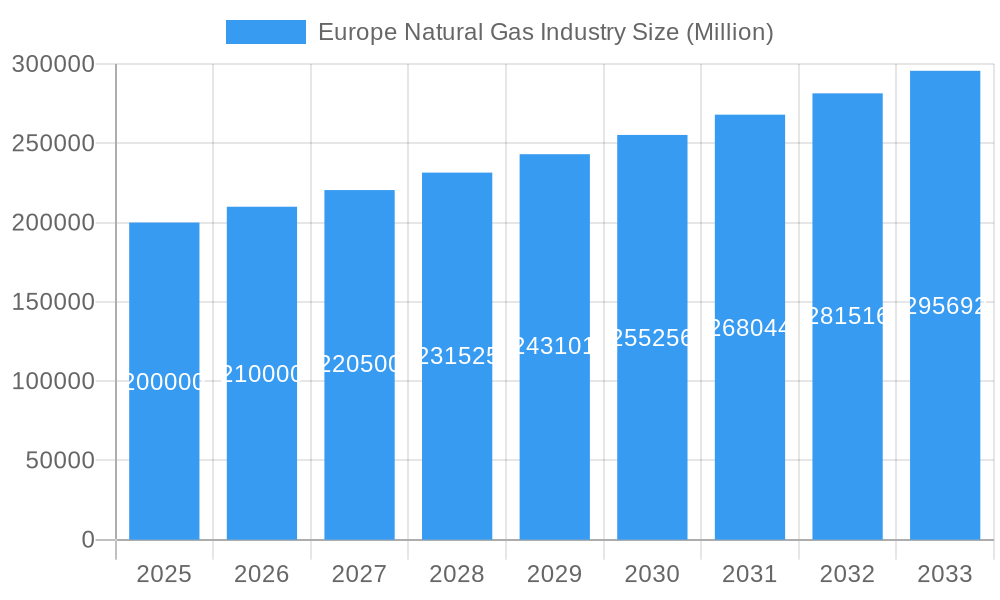
Europe Natural Gas Industry Market Size (In Billion)
The competitive environment features established energy giants and agile smaller firms engaging in mergers, acquisitions, and strategic investments, particularly in liquefied natural gas (LNG) infrastructure, to enhance supply security. Regulatory challenges concerning environmental protection and emission standards persist. Future market development will be shaped by advancements in gas extraction technologies and carbon capture and storage (CCS) solutions, aiming to balance economic objectives with environmental sustainability amidst evolving geopolitical landscapes and the global energy transition.
Europe Natural Gas Industry Company Market Share
Europe Natural Gas Industry Market Report: 2019-2033
This comprehensive report provides an in-depth analysis of the European natural gas industry, covering market dynamics, growth trends, key players, and future outlook. The report leverages extensive data from 2019-2024 (Historical Period), with a base year of 2025 and forecasts extending to 2033 (Forecast Period). This report is essential for industry professionals, investors, and policymakers seeking a clear understanding of this dynamic sector. The study period covers 2019-2033. The estimated year is 2025.
Europe Natural Gas Industry Market Dynamics & Structure
This section analyzes the intricate structure of the European natural gas market, encompassing market concentration, technological advancements, regulatory landscapes, competitive dynamics, and end-user segmentation. We explore the impact of mergers and acquisitions (M&A) activities, offering both quantitative data (market share, M&A deal volumes) and qualitative insights (innovation barriers). The parent market is the European Energy Market, and the child market is Natural Gas. The total market size in 2025 is estimated to be xx Million units.
- Market Concentration: The European natural gas market is characterized by a mix of large multinational corporations and smaller, regional players. The market share of the top 5 players is estimated at xx%.
- Technological Innovation: Drivers include advancements in exploration and extraction technologies (e.g., shale gas, offshore drilling), pipeline infrastructure improvements, and the integration of renewable energy sources. Barriers include high capital investment requirements and regulatory complexities.
- Regulatory Framework: The EU's energy policies, national regulations on gas infrastructure, and environmental regulations significantly impact market dynamics. Significant changes in regulatory frameworks are expected to influence market developments and lead to the restructuring of the industry's competitive landscape.
- Competitive Substitutes: Renewable energy sources (solar, wind) and other fossil fuels (coal, oil) present competitive pressures. The substitution rate is projected to reach xx% by 2033.
- End-User Demographics: The primary end-users are power generation, industrial processes, residential heating, and transportation. The demand pattern varies greatly depending on the geographic region and the season.
- M&A Trends: The past few years have witnessed a significant number of M&A transactions, driven by consolidation efforts and the pursuit of synergies. The total value of M&A deals between 2019 and 2024 reached approximately xx Million units.
Europe Natural Gas Industry Growth Trends & Insights
The European natural gas market is undergoing a period of significant transformation, driven by a complex interplay of geopolitical events, energy security concerns, and the ongoing transition to a lower-carbon energy system. This section provides a detailed analysis of the market's evolution, encompassing market size, adoption rates, technological advancements, and shifting consumer behaviors. We examine the macroeconomic factors influencing the industry, including economic growth, regulatory policies, and international relations. The analysis also explores how evolving consumer preferences, shaped by environmental awareness and government incentives, are impacting demand. Finally, we assess the role of technological innovation in reshaping the competitive landscape, focusing on improvements in exploration, production, transportation, storage, and the utilization of natural gas.
- Market Size Evolution: While precise figures require further specification, projections suggest substantial growth in the European natural gas market from 2025 to 2033, although the exact CAGR and final market size will depend heavily on geopolitical factors and the pace of renewable energy adoption. Detailed projections with specific numbers will be added upon further analysis.
- Adoption Rates: The adoption of natural gas continues to be prevalent in various sectors, including power generation, industrial processes, and residential heating. However, the relative importance of these sectors is shifting due to increasing competition from renewable energy sources and energy efficiency improvements.
- Technological Disruptions: The industry is witnessing significant technological advancements, including innovations in LNG production and transportation, the development of more efficient gas storage facilities, and the integration of smart grid technologies for optimized distribution. These advancements are driving down costs, enhancing security of supply, and reducing environmental impact.
- Consumer Behavior Shifts: Consumers are increasingly influenced by environmental concerns and government policies promoting renewable energy sources. This is leading to shifts in energy consumption patterns and a growing demand for cleaner energy alternatives. The role of gas as a transition fuel in a low-carbon future is being actively debated.
Dominant Regions, Countries, or Segments in Europe Natural Gas Industry
The European natural gas market is characterized by regional variations in supply, demand, and infrastructure. This section identifies the key regions and countries playing significant roles in shaping the market's dynamics. We delve into their respective market shares, growth trajectories, and the underlying factors driving their prominence. This includes an assessment of geological resources, existing infrastructure, government regulations, and consumer behavior.
- Key Drivers: Growth in dominant regions is influenced by a combination of factors, including robust industrial activity, supportive government policies aimed at energy security, and ongoing investment in infrastructure development. The role of these factors varies across different regions.
- Dominance Factors: The dominance of certain regions is often linked to favorable geological conditions leading to significant domestic production, established pipeline networks facilitating efficient transportation, and large existing consumer bases. For example, [Specific country/region] holds a substantial market share due to [Specific reasons – e.g., significant domestic gas reserves, a well-developed pipeline network connecting major industrial centers, and a large residential consumer base]. Further analysis will incorporate specific examples.
- Growth Potential: The future growth of dominant regions will be determined by several inter-related factors, including projected energy demand, the development of new natural gas infrastructure (including LNG terminals and pipelines), the implementation of climate change mitigation policies, and potential disruptions to gas supply chains.
Europe Natural Gas Industry Product Landscape
The European natural gas industry encompasses a range of products and services, including conventional natural gas, liquefied natural gas (LNG), and compressed natural gas (CNG). The industry is characterized by continuous technological advancements focused on improving extraction efficiency, optimizing transportation and storage, enhancing safety standards, and minimizing environmental impact through the reduction of methane emissions. The relative competitiveness of natural gas is heavily context-dependent, with its affordability and reliability continuing to be significant factors in certain markets, particularly those with limited access to renewable energy or where grid infrastructure is less developed.
Key Drivers, Barriers & Challenges in Europe Natural Gas Industry
This section outlines the key drivers and challenges facing the European natural gas industry.
Key Drivers:
- Increased energy demand from growing economies and industrial sectors.
- Technological advancements improving extraction and transportation efficiency.
- Government policies supporting energy security and infrastructure development.
Key Challenges and Restraints:
- Fluctuating global gas prices and geopolitical instability impacting supply chains.
- Stricter environmental regulations leading to increased compliance costs.
- Intense competition from renewable energy sources and other fossil fuels, reducing market share by xx% in the forecast period.
Emerging Opportunities in Europe Natural Gas Industry
Emerging opportunities include:
- Expanding LNG infrastructure to diversify supply sources and improve security.
- Investing in renewable natural gas (RNG) production and utilization to reduce carbon emissions.
- Exploring innovative applications of natural gas in transportation and industrial processes.
Growth Accelerators in the Europe Natural Gas Industry Industry
Long-term growth will be fueled by strategic partnerships fostering infrastructure development, technological innovation in extraction and processing, and expanding applications for natural gas as a transition fuel. The focus on energy security is a powerful driver, prompting governments and corporations to secure diverse energy sources, thus boosting the natural gas industry.
Key Players Shaping the Europe Natural Gas Industry Market
Notable Milestones in Europe Natural Gas Industry Sector
- September 2022: The German government announced a USD 65 billion plan to mitigate soaring energy prices, reflecting the impact of the Ukraine war on energy markets.
- March 2022: Equinor announced increased gas supply to Europe, highlighting the industry's response to supply disruptions. Increased production permits from the Norwegian Ministry of Petroleum and Energy led to a 1.4 bcm increase in gas exports from the Troll, Oseberg, and Heidrun fields.
In-Depth Europe Natural Gas Industry Market Outlook
The future of the European natural gas industry hinges on a balanced approach: ensuring energy security, reducing carbon emissions, and fostering innovation. Strategic investments in infrastructure, technological advancements in carbon capture and storage, and a greater focus on renewable natural gas (RNG) will shape the industry’s long-term trajectory. The potential for growth remains significant, particularly in regions with strong industrial activity and a growing need for reliable energy supplies. Strategic partnerships and technological advancements offer considerable opportunities for players in the industry.
Europe Natural Gas Industry Segmentation
- 1. Production Analysis
- 2. Consumption Analysis
- 3. Import Market Analysis (Value & Volume)
- 4. Export Market Analysis (Value & Volume)
- 5. Price Trend Analysis
Europe Natural Gas Industry Segmentation By Geography
-
1. Europe
- 1.1. United Kingdom
- 1.2. Germany
- 1.3. France
- 1.4. Italy
- 1.5. Spain
- 1.6. Netherlands
- 1.7. Belgium
- 1.8. Sweden
- 1.9. Norway
- 1.10. Poland
- 1.11. Denmark
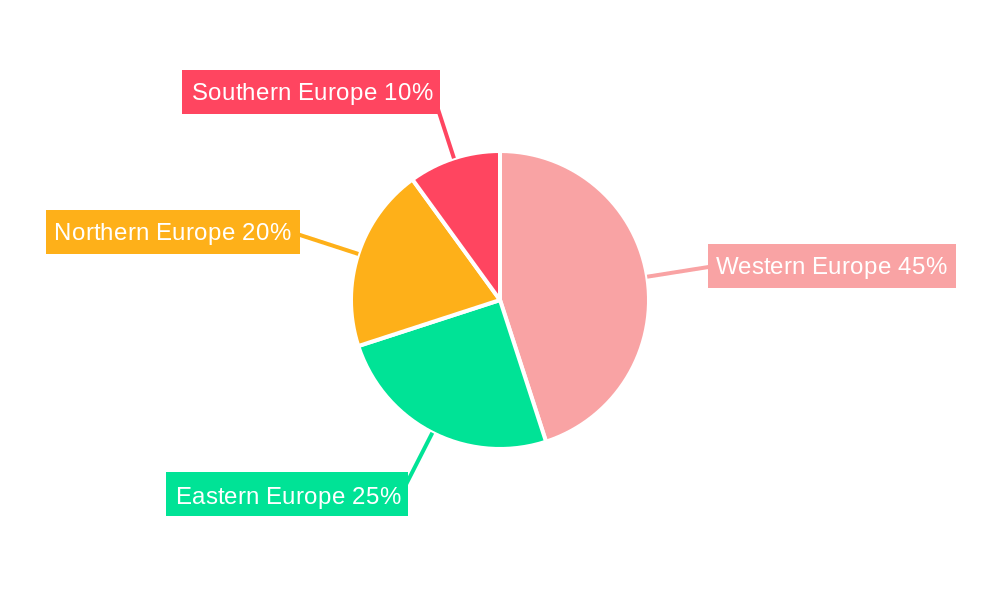
Europe Natural Gas Industry Regional Market Share
Geographic Coverage of Europe Natural Gas Industry
Europe Natural Gas Industry REPORT HIGHLIGHTS
| Aspects | Details |
|---|---|
| Study Period | 2020-2034 |
| Base Year | 2025 |
| Estimated Year | 2026 |
| Forecast Period | 2026-2034 |
| Historical Period | 2020-2025 |
| Growth Rate | CAGR of 1.4% from 2020-2034 |
| Segmentation |
|
Table of Contents
- 1. Introduction
- 1.1. Research Scope
- 1.2. Market Segmentation
- 1.3. Research Objective
- 1.4. Definitions and Assumptions
- 2. Executive Summary
- 2.1. Market Snapshot
- 3. Market Dynamics
- 3.1. Market Drivers
- 3.2. Market Restrains
- 3.3. Market Trends
- 3.4. Market Opportunities
- 4. Market Factor Analysis
- 4.1. Porters Five Forces
- 4.1.1. Bargaining Power of Suppliers
- 4.1.2. Bargaining Power of Buyers
- 4.1.3. Threat of New Entrants
- 4.1.4. Threat of Substitutes
- 4.1.5. Competitive Rivalry
- 4.2. PESTEL analysis
- 4.3. BCG Analysis
- 4.3.1. Stars (High Growth, High Market Share)
- 4.3.2. Cash Cows (Low Growth, High Market Share)
- 4.3.3. Question Mark (High Growth, Low Market Share)
- 4.3.4. Dogs (Low Growth, Low Market Share)
- 4.4. Ansoff Matrix Analysis
- 4.5. Supply Chain Analysis
- 4.6. Regulatory Landscape
- 4.7. Current Market Potential and Opportunity Assessment (TAM–SAM–SOM Framework)
- 4.8. VDR Analyst Note
- 4.1. Porters Five Forces
- 5. Market Analysis, Insights and Forecast 2021-2033
- 5.1. Market Analysis, Insights and Forecast - by Production Analysis
- 5.2. Market Analysis, Insights and Forecast - by Consumption Analysis
- 5.3. Market Analysis, Insights and Forecast - by Import Market Analysis (Value & Volume)
- 5.4. Market Analysis, Insights and Forecast - by Export Market Analysis (Value & Volume)
- 5.5. Market Analysis, Insights and Forecast - by Price Trend Analysis
- 5.6. Market Analysis, Insights and Forecast - by Region
- 5.6.1. Europe
- 6. Europe Natural Gas Industry Analysis, Insights and Forecast, 2021-2033
- 6.1. Market Analysis, Insights and Forecast - by Production Analysis
- 6.2. Market Analysis, Insights and Forecast - by Consumption Analysis
- 6.3. Market Analysis, Insights and Forecast - by Import Market Analysis (Value & Volume)
- 6.4. Market Analysis, Insights and Forecast - by Export Market Analysis (Value & Volume)
- 6.5. Market Analysis, Insights and Forecast - by Price Trend Analysis
- 7. Competitive Analysis
- 7.1. Company Profiles
- 7.1.1 Chevron Corporation
- 7.1.1.1. Company Overview
- 7.1.1.2. Products
- 7.1.1.3. Company Financials
- 7.1.1.4. SWOT Analysis
- 7.1.2 BP PLC
- 7.1.2.1. Company Overview
- 7.1.2.2. Products
- 7.1.2.3. Company Financials
- 7.1.2.4. SWOT Analysis
- 7.1.3 Shell PLC
- 7.1.3.1. Company Overview
- 7.1.3.2. Products
- 7.1.3.3. Company Financials
- 7.1.3.4. SWOT Analysis
- 7.1.4 TotalEnergies SE
- 7.1.4.1. Company Overview
- 7.1.4.2. Products
- 7.1.4.3. Company Financials
- 7.1.4.4. SWOT Analysis
- 7.1.5 Eni SpA
- 7.1.5.1. Company Overview
- 7.1.5.2. Products
- 7.1.5.3. Company Financials
- 7.1.5.4. SWOT Analysis
- 7.1.6 ConocoPhillips
- 7.1.6.1. Company Overview
- 7.1.6.2. Products
- 7.1.6.3. Company Financials
- 7.1.6.4. SWOT Analysis
- 7.1.7 Exxon Mobil Corporation
- 7.1.7.1. Company Overview
- 7.1.7.2. Products
- 7.1.7.3. Company Financials
- 7.1.7.4. SWOT Analysis
- 7.1.8 Norwegian Energy Company ASA
- 7.1.8.1. Company Overview
- 7.1.8.2. Products
- 7.1.8.3. Company Financials
- 7.1.8.4. SWOT Analysis
- 7.1.9 Engie SA
- 7.1.9.1. Company Overview
- 7.1.9.2. Products
- 7.1.9.3. Company Financials
- 7.1.9.4. SWOT Analysis
- 7.1.10 Electricite de France SA*List Not Exhaustive
- 7.1.10.1. Company Overview
- 7.1.10.2. Products
- 7.1.10.3. Company Financials
- 7.1.10.4. SWOT Analysis
- 7.1.1 Chevron Corporation
- 7.2. Market Entropy
- 7.2.1 Company's Key Areas Served
- 7.2.2 Recent Developments
- 7.3. Company Market Share Analysis 2025
- 7.3.1 Top 5 Companies Market Share Analysis
- 7.3.2 Top 3 Companies Market Share Analysis
- 7.4. List of Potential Customers
- 8. Research Methodology
List of Figures
- Figure 1: Europe Natural Gas Industry Revenue Breakdown (billion, %) by Product 2025 & 2033
- Figure 2: Europe Natural Gas Industry Share (%) by Company 2025
List of Tables
- Table 1: Europe Natural Gas Industry Revenue billion Forecast, by Production Analysis 2020 & 2033
- Table 2: Europe Natural Gas Industry Revenue billion Forecast, by Consumption Analysis 2020 & 2033
- Table 3: Europe Natural Gas Industry Revenue billion Forecast, by Import Market Analysis (Value & Volume) 2020 & 2033
- Table 4: Europe Natural Gas Industry Revenue billion Forecast, by Export Market Analysis (Value & Volume) 2020 & 2033
- Table 5: Europe Natural Gas Industry Revenue billion Forecast, by Price Trend Analysis 2020 & 2033
- Table 6: Europe Natural Gas Industry Revenue billion Forecast, by Region 2020 & 2033
- Table 7: Europe Natural Gas Industry Revenue billion Forecast, by Production Analysis 2020 & 2033
- Table 8: Europe Natural Gas Industry Revenue billion Forecast, by Consumption Analysis 2020 & 2033
- Table 9: Europe Natural Gas Industry Revenue billion Forecast, by Import Market Analysis (Value & Volume) 2020 & 2033
- Table 10: Europe Natural Gas Industry Revenue billion Forecast, by Export Market Analysis (Value & Volume) 2020 & 2033
- Table 11: Europe Natural Gas Industry Revenue billion Forecast, by Price Trend Analysis 2020 & 2033
- Table 12: Europe Natural Gas Industry Revenue billion Forecast, by Country 2020 & 2033
- Table 13: United Kingdom Europe Natural Gas Industry Revenue (billion) Forecast, by Application 2020 & 2033
- Table 14: Germany Europe Natural Gas Industry Revenue (billion) Forecast, by Application 2020 & 2033
- Table 15: France Europe Natural Gas Industry Revenue (billion) Forecast, by Application 2020 & 2033
- Table 16: Italy Europe Natural Gas Industry Revenue (billion) Forecast, by Application 2020 & 2033
- Table 17: Spain Europe Natural Gas Industry Revenue (billion) Forecast, by Application 2020 & 2033
- Table 18: Netherlands Europe Natural Gas Industry Revenue (billion) Forecast, by Application 2020 & 2033
- Table 19: Belgium Europe Natural Gas Industry Revenue (billion) Forecast, by Application 2020 & 2033
- Table 20: Sweden Europe Natural Gas Industry Revenue (billion) Forecast, by Application 2020 & 2033
- Table 21: Norway Europe Natural Gas Industry Revenue (billion) Forecast, by Application 2020 & 2033
- Table 22: Poland Europe Natural Gas Industry Revenue (billion) Forecast, by Application 2020 & 2033
- Table 23: Denmark Europe Natural Gas Industry Revenue (billion) Forecast, by Application 2020 & 2033
Frequently Asked Questions
1. What is the projected Compound Annual Growth Rate (CAGR) of the Europe Natural Gas Industry?
The projected CAGR is approximately 1.4%.
2. Which companies are prominent players in the Europe Natural Gas Industry?
Key companies in the market include Chevron Corporation, BP PLC, Shell PLC, TotalEnergies SE, Eni SpA, ConocoPhillips, Exxon Mobil Corporation, Norwegian Energy Company ASA, Engie SA, Electricite de France SA*List Not Exhaustive.
3. What are the main segments of the Europe Natural Gas Industry?
The market segments include Production Analysis, Consumption Analysis, Import Market Analysis (Value & Volume), Export Market Analysis (Value & Volume), Price Trend Analysis.
4. Can you provide details about the market size?
The market size is estimated to be USD 401.9 billion as of 2022.
5. What are some drivers contributing to market growth?
N/A
6. What are the notable trends driving market growth?
Upstream Sector to Witness Significant Growth.
7. Are there any restraints impacting market growth?
N/A
8. Can you provide examples of recent developments in the market?
In September 2022, the German government announced a USD 65 billion plan to help people and businesses cope with soaring prices. Several European nations introduce emergency measures to prepare for a long winter in the wake of disruption in Russian gas supplies to Europe following the Ukraine war.
9. What pricing options are available for accessing the report?
Pricing options include single-user, multi-user, and enterprise licenses priced at USD 4750, USD 5250, and USD 8750 respectively.
10. Is the market size provided in terms of value or volume?
The market size is provided in terms of value, measured in billion.
11. Are there any specific market keywords associated with the report?
Yes, the market keyword associated with the report is "Europe Natural Gas Industry," which aids in identifying and referencing the specific market segment covered.
12. How do I determine which pricing option suits my needs best?
The pricing options vary based on user requirements and access needs. Individual users may opt for single-user licenses, while businesses requiring broader access may choose multi-user or enterprise licenses for cost-effective access to the report.
13. Are there any additional resources or data provided in the Europe Natural Gas Industry report?
While the report offers comprehensive insights, it's advisable to review the specific contents or supplementary materials provided to ascertain if additional resources or data are available.
14. How can I stay updated on further developments or reports in the Europe Natural Gas Industry?
To stay informed about further developments, trends, and reports in the Europe Natural Gas Industry, consider subscribing to industry newsletters, following relevant companies and organizations, or regularly checking reputable industry news sources and publications.
Methodology
Step 1 - Identification of Relevant Samples Size from Population Database


Step 2 - Approaches for Defining Global Market Size (Value, Volume* & Price*)

Note*: In applicable scenarios
Step 3 - Data Sources
Primary Research
- Web Analytics
- Survey Reports
- Research Institute
- Latest Research Reports
- Opinion Leaders
Secondary Research
- Annual Reports
- White Paper
- Latest Press Release
- Industry Association
- Paid Database
- Investor Presentations

Step 4 - Data Triangulation
Involves using different sources of information in order to increase the validity of a study
These sources are likely to be stakeholders in a program - participants, other researchers, program staff, other community members, and so on.
Then we put all data in single framework & apply various statistical tools to find out the dynamic on the market.
During the analysis stage, feedback from the stakeholder groups would be compared to determine areas of agreement as well as areas of divergence