
Key Insights
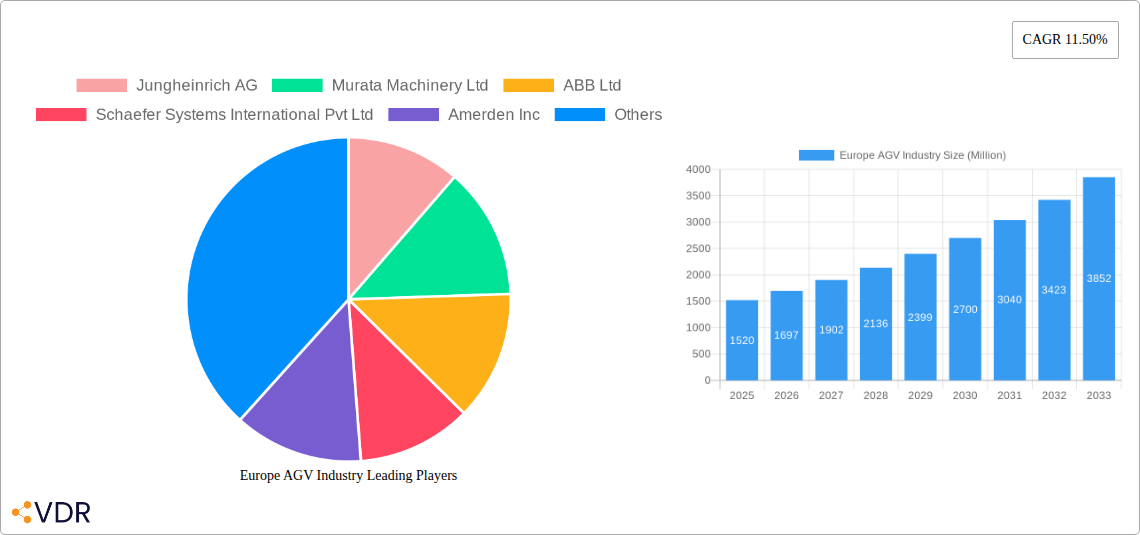
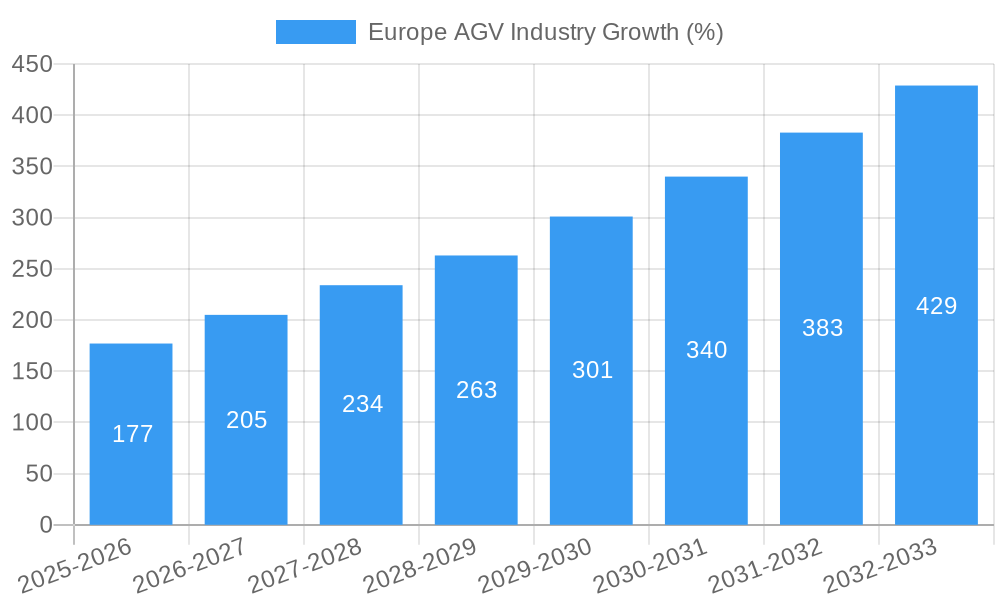
The European Automated Guided Vehicle (AGV) market, valued at €1.52 billion in 2025, is experiencing robust growth, projected to expand at a Compound Annual Growth Rate (CAGR) of 11.50% from 2025 to 2033. This significant expansion is driven by several key factors. The increasing adoption of automation in manufacturing and logistics to enhance efficiency and reduce labor costs is a primary driver. E-commerce boom and the resulting need for faster and more precise order fulfillment are further fueling demand for AGVs across various sectors, including food and beverage, automotive, and e-commerce warehousing. Furthermore, advancements in AGV technology, such as improved navigation systems (e.g., laser-guided and SLAM-based systems), increased payload capacities, and enhanced safety features, are contributing to wider adoption. Germany, France, and the United Kingdom represent the largest national markets within Europe, benefiting from established industrial bases and a proactive approach to automation. However, challenges remain, including the high initial investment costs associated with AGV implementation and the need for skilled labor to integrate and maintain these systems.
The market segmentation reveals significant opportunities. Automated forklifts and tow tractors are currently dominant product types, but the growing demand for flexibility and precision in assembly lines and specialized applications is driving growth in these segments. While the automotive and food & beverage industries are currently major end-users, the expanding e-commerce sector and increased automation in pharmaceuticals and general manufacturing are expected to create substantial future growth. Companies like Jungheinrich AG, Dematic Corp, and Swisslog Holding AG are leading players, competing on the basis of technology, service offerings, and geographical reach. The ongoing expansion of e-commerce logistics and the increasing adoption of Industry 4.0 principles across various industries suggest that the European AGV market will continue its upward trajectory throughout the forecast period, offering attractive opportunities for both established players and emerging innovators.
Europe AGV Industry Market Report: 2019-2033
This comprehensive report provides a detailed analysis of the European Automated Guided Vehicle (AGV) industry, covering market dynamics, growth trends, key players, and future outlook. With a focus on both parent and child markets, this report is an essential resource for industry professionals, investors, and strategic decision-makers. The study period spans 2019-2033, with 2025 as the base and estimated year.
Study Period: 2019-2033 Base Year: 2025 Estimated Year: 2025 Forecast Period: 2025-2033 Historical Period: 2019-2024
Europe AGV Industry Market Dynamics & Structure
The European AGV market is characterized by moderate concentration, with several major players vying for market share. Technological innovation, driven by advancements in AI, robotics, and sensor technologies, is a key driver. Stringent safety regulations and environmental concerns are shaping the industry landscape, influencing product development and adoption. Competitive substitutes, such as conveyor systems and manual handling, continue to pose challenges. End-user demographics, particularly within the automotive and e-commerce sectors, significantly influence demand. M&A activity has been relatively modest in recent years, with approximately xx deals annually, averaging xx Million in value.
- Market Concentration: Moderately concentrated, with top 5 players holding approximately xx% market share.
- Technological Innovation: Key drivers include AI, improved sensor technology, and enhanced navigation systems.
- Regulatory Framework: Stringent safety and emission regulations influence product development and market access.
- Competitive Substitutes: Conveyor systems and manual handling pose competition.
- End-User Demographics: Automotive, e-commerce, and food & beverage sectors are key drivers of growth.
- M&A Trends: Moderate M&A activity, with an average of xx deals per year valued at xx Million.
Europe AGV Industry Growth Trends & Insights
The European AGV market experienced significant growth during the historical period (2019-2024), with a CAGR of xx%. This growth is attributed to increasing automation in various industries, rising labor costs, and the need for enhanced efficiency and productivity. The market is expected to maintain its growth trajectory during the forecast period (2025-2033), driven by factors such as the increasing adoption of Industry 4.0 technologies, rising e-commerce penetration, and government initiatives promoting automation. Technological disruptions, such as the introduction of autonomous mobile robots (AMRs) and advancements in battery technology, are reshaping market dynamics. Consumer behavior shifts toward greater efficiency and supply chain optimization are also playing a crucial role. Market penetration is expected to reach xx% by 2033.
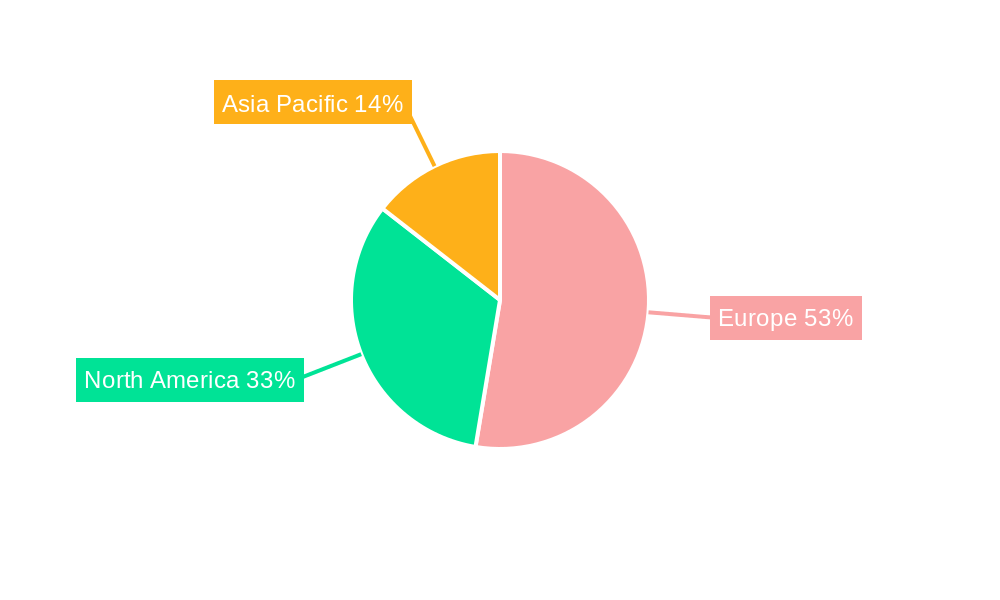
Dominant Regions, Countries, or Segments in Europe AGV Industry
Germany and the United Kingdom are currently the dominant markets within Europe, accounting for a combined xx% of the total market share. The automotive and food & beverage sectors are the leading end-user industries, driven by high demand for material handling automation. Within product types, automated forklifts and automated tow/tractor/tugs hold the largest market share.
- Leading Regions: Germany and the United Kingdom.
- Leading End-User Industries: Automotive and Food & Beverage.
- Leading Product Types: Automated Forklifts and Automated Tow/Tractor/Tugs.
- Key Drivers: Strong industrial base, government support for automation, and high labor costs.
Europe AGV Industry Product Landscape
The AGV market offers diverse product types, including automated forklifts, tow tractors, unit load vehicles, assembly line AGVs, and special-purpose vehicles. Recent innovations focus on increased payload capacity, enhanced navigation capabilities, and improved safety features. Unique selling propositions often center around ease of integration, flexible deployment options, and enhanced ROI through increased efficiency and reduced labor costs. Advancements in battery technology, AI-powered navigation, and improved sensor technologies are driving product performance and expanding application possibilities.
Key Drivers, Barriers & Challenges in Europe AGV Industry
Key Drivers:
- Rising labor costs and labor shortages.
- Increased demand for efficient logistics and warehouse operations.
- Government initiatives promoting automation and Industry 4.0 adoption.
- Technological advancements in robotics, AI, and sensor technologies.
Key Barriers & Challenges:
- High initial investment costs.
- Integration complexities with existing infrastructure.
- Safety concerns and regulatory compliance issues.
- Skilled labor shortage for AGV implementation and maintenance. This results in an estimated xx% increase in implementation costs.
Emerging Opportunities in Europe AGV Industry
Emerging opportunities lie in the expansion into untapped markets such as smaller and medium-sized enterprises (SMEs), the development of AGVs for specialized applications (e.g., healthcare, agriculture), and the integration of AGVs with other Industry 4.0 technologies. The growing demand for sustainable logistics solutions is also presenting opportunities for the development of eco-friendly AGVs.
Growth Accelerators in the Europe AGV Industry
Technological breakthroughs in AI, robotics, and battery technology are key growth catalysts. Strategic partnerships between AGV manufacturers and system integrators are expanding market reach. Market expansion strategies focused on emerging markets and new applications will further accelerate growth.
Key Players Shaping the Europe AGV Industry Market
- Jungheinrich AG
- Murata Machinery Ltd
- ABB Ltd
- Schaefer Systems International Pvt Ltd
- Amerden Inc
- KUKA AG
- Dematic Corp
- Transbotics Corporation
- Toyota Material Handling International AB
- John Bean Technologies (JBT) Corporation
- Swisslog Holding AG
- Seegrid Corporation
Notable Milestones in Europe AGV Industry Sector
- June 2022: ek robotics partners with BMW to provide a turnkey AGV solution for its Swindon plant.
- March 2022: GAUSSIN launches the world's first hydrogen-powered AGV for seaports.
In-Depth Europe AGV Industry Market Outlook
The European AGV market is poised for sustained growth driven by ongoing technological advancements, increased automation across various industries, and the growing demand for efficient and sustainable logistics solutions. Strategic partnerships, product diversification, and market expansion into new sectors will be crucial for capturing future market potential. The market is expected to reach xx Million units by 2033.
Europe AGV Industry Segmentation
-
1. Product Type
- 1.1. Automated Fork Lift
- 1.2. Automated Tow/Tractor/Tugs
- 1.3. Unit Load
- 1.4. Assembly Line
- 1.5. Special Purpose
-
2. End-User Industry
- 2.1. Food & Beverage
- 2.2. Automotive
- 2.3. Retail
- 2.4. Electronics & Electrical
- 2.5. General Manufacturing
- 2.6. Pharmaceuticals
- 2.7. Other End-user Industries
Europe AGV Industry Segmentation By Geography
-
1. Europe
- 1.1. United Kingdom
- 1.2. Germany
- 1.3. France
- 1.4. Italy
- 1.5. Spain
- 1.6. Netherlands
- 1.7. Belgium
- 1.8. Sweden
- 1.9. Norway
- 1.10. Poland
- 1.11. Denmark
Europe AGV Industry REPORT HIGHLIGHTS
| Aspects | Details |
|---|---|
| Study Period | 2019-2033 |
| Base Year | 2024 |
| Estimated Year | 2025 |
| Forecast Period | 2025-2033 |
| Historical Period | 2019-2024 |
| Growth Rate | CAGR of 11.50% from 2019-2033 |
| Segmentation |
|
Table of Contents
- 1. Introduction
- 1.1. Research Scope
- 1.2. Market Segmentation
- 1.3. Research Methodology
- 1.4. Definitions and Assumptions
- 2. Executive Summary
- 2.1. Introduction
- 3. Market Dynamics
- 3.1. Introduction
- 3.2. Market Drivers
- 3.2.1. Rapid Growth of the E-commerce Industry; Need for Automation in Maritime Applications for Improvement in Terminal Efficiency
- 3.3. Market Restrains
- 3.3.1. Limitation of Real-time Wireless Control Due to Communication Delays
- 3.4. Market Trends
- 3.4.1. Food and Beverages is Expected to Witness Significant Growth
- 4. Market Factor Analysis
- 4.1. Porters Five Forces
- 4.2. Supply/Value Chain
- 4.3. PESTEL analysis
- 4.4. Market Entropy
- 4.5. Patent/Trademark Analysis
- 5. Europe AGV Industry Analysis, Insights and Forecast, 2019-2031
- 5.1. Market Analysis, Insights and Forecast - by Product Type
- 5.1.1. Automated Fork Lift
- 5.1.2. Automated Tow/Tractor/Tugs
- 5.1.3. Unit Load
- 5.1.4. Assembly Line
- 5.1.5. Special Purpose
- 5.2. Market Analysis, Insights and Forecast - by End-User Industry
- 5.2.1. Food & Beverage
- 5.2.2. Automotive
- 5.2.3. Retail
- 5.2.4. Electronics & Electrical
- 5.2.5. General Manufacturing
- 5.2.6. Pharmaceuticals
- 5.2.7. Other End-user Industries
- 5.3. Market Analysis, Insights and Forecast - by Region
- 5.3.1. Europe
- 5.1. Market Analysis, Insights and Forecast - by Product Type
- 6. Germany Europe AGV Industry Analysis, Insights and Forecast, 2019-2031
- 7. France Europe AGV Industry Analysis, Insights and Forecast, 2019-2031
- 8. Italy Europe AGV Industry Analysis, Insights and Forecast, 2019-2031
- 9. United Kingdom Europe AGV Industry Analysis, Insights and Forecast, 2019-2031
- 10. Netherlands Europe AGV Industry Analysis, Insights and Forecast, 2019-2031
- 11. Sweden Europe AGV Industry Analysis, Insights and Forecast, 2019-2031
- 12. Rest of Europe Europe AGV Industry Analysis, Insights and Forecast, 2019-2031
- 13. Competitive Analysis
- 13.1. Market Share Analysis 2024
- 13.2. Company Profiles
- 13.2.1 Jungheinrich AG
- 13.2.1.1. Overview
- 13.2.1.2. Products
- 13.2.1.3. SWOT Analysis
- 13.2.1.4. Recent Developments
- 13.2.1.5. Financials (Based on Availability)
- 13.2.2 Murata Machinery Ltd
- 13.2.2.1. Overview
- 13.2.2.2. Products
- 13.2.2.3. SWOT Analysis
- 13.2.2.4. Recent Developments
- 13.2.2.5. Financials (Based on Availability)
- 13.2.3 ABB Ltd
- 13.2.3.1. Overview
- 13.2.3.2. Products
- 13.2.3.3. SWOT Analysis
- 13.2.3.4. Recent Developments
- 13.2.3.5. Financials (Based on Availability)
- 13.2.4 Schaefer Systems International Pvt Ltd
- 13.2.4.1. Overview
- 13.2.4.2. Products
- 13.2.4.3. SWOT Analysis
- 13.2.4.4. Recent Developments
- 13.2.4.5. Financials (Based on Availability)
- 13.2.5 Amerden Inc
- 13.2.5.1. Overview
- 13.2.5.2. Products
- 13.2.5.3. SWOT Analysis
- 13.2.5.4. Recent Developments
- 13.2.5.5. Financials (Based on Availability)
- 13.2.6 KUKA AG
- 13.2.6.1. Overview
- 13.2.6.2. Products
- 13.2.6.3. SWOT Analysis
- 13.2.6.4. Recent Developments
- 13.2.6.5. Financials (Based on Availability)
- 13.2.7 Dematic Corp
- 13.2.7.1. Overview
- 13.2.7.2. Products
- 13.2.7.3. SWOT Analysis
- 13.2.7.4. Recent Developments
- 13.2.7.5. Financials (Based on Availability)
- 13.2.8 Transbotics Corporation
- 13.2.8.1. Overview
- 13.2.8.2. Products
- 13.2.8.3. SWOT Analysis
- 13.2.8.4. Recent Developments
- 13.2.8.5. Financials (Based on Availability)
- 13.2.9 Toyota Material Handling International AB
- 13.2.9.1. Overview
- 13.2.9.2. Products
- 13.2.9.3. SWOT Analysis
- 13.2.9.4. Recent Developments
- 13.2.9.5. Financials (Based on Availability)
- 13.2.10 John Bean Technologies (JBT) Corporation
- 13.2.10.1. Overview
- 13.2.10.2. Products
- 13.2.10.3. SWOT Analysis
- 13.2.10.4. Recent Developments
- 13.2.10.5. Financials (Based on Availability)
- 13.2.11 Swisslog Holding AG
- 13.2.11.1. Overview
- 13.2.11.2. Products
- 13.2.11.3. SWOT Analysis
- 13.2.11.4. Recent Developments
- 13.2.11.5. Financials (Based on Availability)
- 13.2.12 Seegrid Corporation
- 13.2.12.1. Overview
- 13.2.12.2. Products
- 13.2.12.3. SWOT Analysis
- 13.2.12.4. Recent Developments
- 13.2.12.5. Financials (Based on Availability)
- 13.2.1 Jungheinrich AG
List of Figures
- Figure 1: Europe AGV Industry Revenue Breakdown (Million, %) by Product 2024 & 2032
- Figure 2: Europe AGV Industry Share (%) by Company 2024
List of Tables
- Table 1: Europe AGV Industry Revenue Million Forecast, by Region 2019 & 2032
- Table 2: Europe AGV Industry Volume K Unit Forecast, by Region 2019 & 2032
- Table 3: Europe AGV Industry Revenue Million Forecast, by Product Type 2019 & 2032
- Table 4: Europe AGV Industry Volume K Unit Forecast, by Product Type 2019 & 2032
- Table 5: Europe AGV Industry Revenue Million Forecast, by End-User Industry 2019 & 2032
- Table 6: Europe AGV Industry Volume K Unit Forecast, by End-User Industry 2019 & 2032
- Table 7: Europe AGV Industry Revenue Million Forecast, by Region 2019 & 2032
- Table 8: Europe AGV Industry Volume K Unit Forecast, by Region 2019 & 2032
- Table 9: Europe AGV Industry Revenue Million Forecast, by Country 2019 & 2032
- Table 10: Europe AGV Industry Volume K Unit Forecast, by Country 2019 & 2032
- Table 11: Germany Europe AGV Industry Revenue (Million) Forecast, by Application 2019 & 2032
- Table 12: Germany Europe AGV Industry Volume (K Unit) Forecast, by Application 2019 & 2032
- Table 13: France Europe AGV Industry Revenue (Million) Forecast, by Application 2019 & 2032
- Table 14: France Europe AGV Industry Volume (K Unit) Forecast, by Application 2019 & 2032
- Table 15: Italy Europe AGV Industry Revenue (Million) Forecast, by Application 2019 & 2032
- Table 16: Italy Europe AGV Industry Volume (K Unit) Forecast, by Application 2019 & 2032
- Table 17: United Kingdom Europe AGV Industry Revenue (Million) Forecast, by Application 2019 & 2032
- Table 18: United Kingdom Europe AGV Industry Volume (K Unit) Forecast, by Application 2019 & 2032
- Table 19: Netherlands Europe AGV Industry Revenue (Million) Forecast, by Application 2019 & 2032
- Table 20: Netherlands Europe AGV Industry Volume (K Unit) Forecast, by Application 2019 & 2032
- Table 21: Sweden Europe AGV Industry Revenue (Million) Forecast, by Application 2019 & 2032
- Table 22: Sweden Europe AGV Industry Volume (K Unit) Forecast, by Application 2019 & 2032
- Table 23: Rest of Europe Europe AGV Industry Revenue (Million) Forecast, by Application 2019 & 2032
- Table 24: Rest of Europe Europe AGV Industry Volume (K Unit) Forecast, by Application 2019 & 2032
- Table 25: Europe AGV Industry Revenue Million Forecast, by Product Type 2019 & 2032
- Table 26: Europe AGV Industry Volume K Unit Forecast, by Product Type 2019 & 2032
- Table 27: Europe AGV Industry Revenue Million Forecast, by End-User Industry 2019 & 2032
- Table 28: Europe AGV Industry Volume K Unit Forecast, by End-User Industry 2019 & 2032
- Table 29: Europe AGV Industry Revenue Million Forecast, by Country 2019 & 2032
- Table 30: Europe AGV Industry Volume K Unit Forecast, by Country 2019 & 2032
- Table 31: United Kingdom Europe AGV Industry Revenue (Million) Forecast, by Application 2019 & 2032
- Table 32: United Kingdom Europe AGV Industry Volume (K Unit) Forecast, by Application 2019 & 2032
- Table 33: Germany Europe AGV Industry Revenue (Million) Forecast, by Application 2019 & 2032
- Table 34: Germany Europe AGV Industry Volume (K Unit) Forecast, by Application 2019 & 2032
- Table 35: France Europe AGV Industry Revenue (Million) Forecast, by Application 2019 & 2032
- Table 36: France Europe AGV Industry Volume (K Unit) Forecast, by Application 2019 & 2032
- Table 37: Italy Europe AGV Industry Revenue (Million) Forecast, by Application 2019 & 2032
- Table 38: Italy Europe AGV Industry Volume (K Unit) Forecast, by Application 2019 & 2032
- Table 39: Spain Europe AGV Industry Revenue (Million) Forecast, by Application 2019 & 2032
- Table 40: Spain Europe AGV Industry Volume (K Unit) Forecast, by Application 2019 & 2032
- Table 41: Netherlands Europe AGV Industry Revenue (Million) Forecast, by Application 2019 & 2032
- Table 42: Netherlands Europe AGV Industry Volume (K Unit) Forecast, by Application 2019 & 2032
- Table 43: Belgium Europe AGV Industry Revenue (Million) Forecast, by Application 2019 & 2032
- Table 44: Belgium Europe AGV Industry Volume (K Unit) Forecast, by Application 2019 & 2032
- Table 45: Sweden Europe AGV Industry Revenue (Million) Forecast, by Application 2019 & 2032
- Table 46: Sweden Europe AGV Industry Volume (K Unit) Forecast, by Application 2019 & 2032
- Table 47: Norway Europe AGV Industry Revenue (Million) Forecast, by Application 2019 & 2032
- Table 48: Norway Europe AGV Industry Volume (K Unit) Forecast, by Application 2019 & 2032
- Table 49: Poland Europe AGV Industry Revenue (Million) Forecast, by Application 2019 & 2032
- Table 50: Poland Europe AGV Industry Volume (K Unit) Forecast, by Application 2019 & 2032
- Table 51: Denmark Europe AGV Industry Revenue (Million) Forecast, by Application 2019 & 2032
- Table 52: Denmark Europe AGV Industry Volume (K Unit) Forecast, by Application 2019 & 2032
Frequently Asked Questions
1. What is the projected Compound Annual Growth Rate (CAGR) of the Europe AGV Industry?
The projected CAGR is approximately 11.50%.
2. Which companies are prominent players in the Europe AGV Industry?
Key companies in the market include Jungheinrich AG, Murata Machinery Ltd, ABB Ltd, Schaefer Systems International Pvt Ltd, Amerden Inc, KUKA AG, Dematic Corp, Transbotics Corporation, Toyota Material Handling International AB, John Bean Technologies (JBT) Corporation, Swisslog Holding AG, Seegrid Corporation.
3. What are the main segments of the Europe AGV Industry?
The market segments include Product Type, End-User Industry.
4. Can you provide details about the market size?
The market size is estimated to be USD 1.52 Million as of 2022.
5. What are some drivers contributing to market growth?
Rapid Growth of the E-commerce Industry; Need for Automation in Maritime Applications for Improvement in Terminal Efficiency.
6. What are the notable trends driving market growth?
Food and Beverages is Expected to Witness Significant Growth.
7. Are there any restraints impacting market growth?
Limitation of Real-time Wireless Control Due to Communication Delays.
8. Can you provide examples of recent developments in the market?
June 2022 - ek robotics entered in a partnership with BMW to provide a complete turnkey automated guided vehicle (AGV) solution. The ek robotics' massive custom-move AVG solution would enable BMW to optimize its manufacturing and warehouse activities. The equipment includes the Custom Move, Vario Move, and Very Narrow Aisle (VNA) AGVs. The AGV solution was delivered and implemented at BMW's PGA Press Plant in Swindon, England.
9. What pricing options are available for accessing the report?
Pricing options include single-user, multi-user, and enterprise licenses priced at USD 4750, USD 4950, and USD 6800 respectively.
10. Is the market size provided in terms of value or volume?
The market size is provided in terms of value, measured in Million and volume, measured in K Unit.
11. Are there any specific market keywords associated with the report?
Yes, the market keyword associated with the report is "Europe AGV Industry," which aids in identifying and referencing the specific market segment covered.
12. How do I determine which pricing option suits my needs best?
The pricing options vary based on user requirements and access needs. Individual users may opt for single-user licenses, while businesses requiring broader access may choose multi-user or enterprise licenses for cost-effective access to the report.
13. Are there any additional resources or data provided in the Europe AGV Industry report?
While the report offers comprehensive insights, it's advisable to review the specific contents or supplementary materials provided to ascertain if additional resources or data are available.
14. How can I stay updated on further developments or reports in the Europe AGV Industry?
To stay informed about further developments, trends, and reports in the Europe AGV Industry, consider subscribing to industry newsletters, following relevant companies and organizations, or regularly checking reputable industry news sources and publications.
Methodology
Step 1 - Identification of Relevant Samples Size from Population Database


Step 2 - Approaches for Defining Global Market Size (Value, Volume* & Price*)

Note*: In applicable scenarios
Step 3 - Data Sources
Primary Research
- Web Analytics
- Survey Reports
- Research Institute
- Latest Research Reports
- Opinion Leaders
Secondary Research
- Annual Reports
- White Paper
- Latest Press Release
- Industry Association
- Paid Database
- Investor Presentations

Step 4 - Data Triangulation
Involves using different sources of information in order to increase the validity of a study
These sources are likely to be stakeholders in a program - participants, other researchers, program staff, other community members, and so on.
Then we put all data in single framework & apply various statistical tools to find out the dynamic on the market.
During the analysis stage, feedback from the stakeholder groups would be compared to determine areas of agreement as well as areas of divergence


