
Key Insights
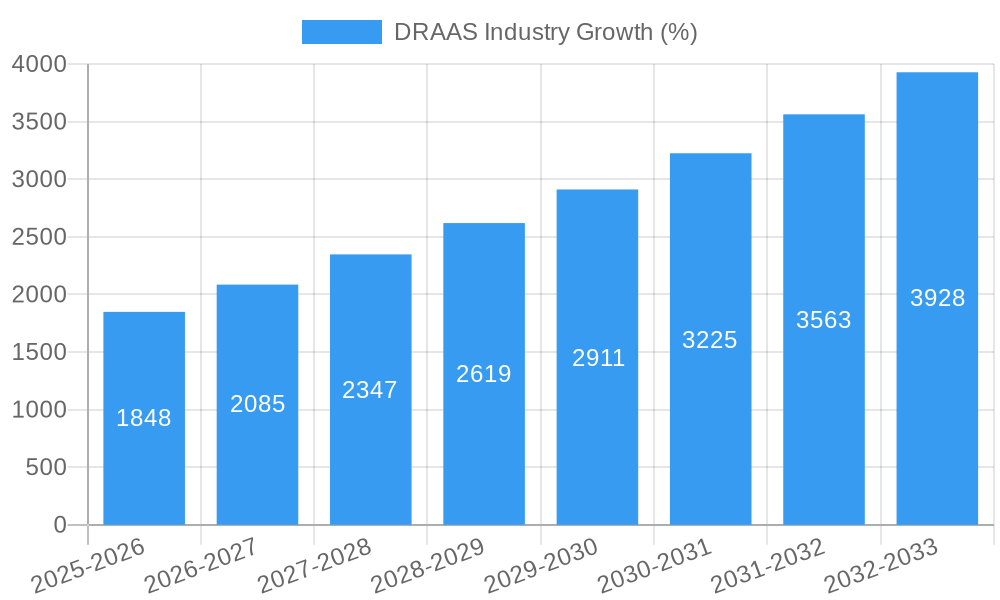
The Disaster Recovery as a Service (DRAAS) market is experiencing robust growth, fueled by increasing reliance on cloud computing and the escalating need for robust business continuity and disaster recovery (BC/DR) solutions. The market's Compound Annual Growth Rate (CAGR) of 12.32% from 2019-2024 suggests a significant expansion, projected to continue throughout the forecast period (2025-2033). Key drivers include rising cyber threats, stringent regulatory compliance mandates, and the growing adoption of hybrid and multi-cloud environments. Businesses across various sectors, particularly BFSI (Banking, Financial Services, and Insurance), IT, and Government, are increasingly adopting DRAAS to minimize downtime, reduce recovery time objectives (RTOs), and improve overall operational resilience. The increasing complexity of IT infrastructure and the associated costs of maintaining in-house DR solutions are further bolstering the adoption of cost-effective and scalable DRAAS offerings.
The market segmentation reveals a strong presence of established players like IBM, Microsoft, and smaller specialized providers. Competitive dynamics are characterized by ongoing innovation, including advancements in automation, orchestration, and AI-powered DR solutions. While North America currently dominates the market due to high cloud adoption rates and a strong technological ecosystem, regions like Asia-Pacific are experiencing rapid growth, driven by increasing digitalization and infrastructure development. However, factors such as the high initial investment cost associated with DRAAS implementation and concerns about data security and vendor lock-in could potentially restrain market growth to some extent. Nonetheless, the long-term outlook for the DRAAS market remains positive, given the ever-increasing need for resilient and dependable IT infrastructure in an increasingly interconnected world. The strategic focus on improving service level agreements (SLAs), enhanced security features, and the adoption of innovative DR technologies are likely to be crucial factors in shaping the future of the DRAAS market.
This comprehensive report provides an in-depth analysis of the Disaster Recovery as a Service (DRaaS) industry, encompassing market dynamics, growth trends, key players, and future outlook. With a focus on the parent market of Cloud Computing and the child market of Disaster Recovery Solutions, this report offers invaluable insights for industry professionals, investors, and strategic decision-makers. The study period covers 2019-2033, with 2025 as the base and estimated year.
DRAAS Industry Market Dynamics & Structure
The DRaaS market is characterized by moderate concentration, with key players vying for market share. Technological innovation, particularly in areas like automation and AI-driven recovery, is a major driver. Regulatory frameworks like GDPR and HIPAA significantly influence data protection strategies and DRaaS adoption. Competitive substitutes include on-premise disaster recovery solutions, but DRaaS offers scalability and cost advantages. End-user demographics are diverse, spanning BFSI, IT, Government, Healthcare, and other verticals. M&A activity has been significant, consolidating the market and driving innovation.
- Market Concentration: Moderately concentrated, with top 5 players holding approximately xx% market share in 2024.
- Technological Innovation: Focus on automation, AI-powered recovery, and integration with cloud platforms.
- Regulatory Frameworks: GDPR, HIPAA, and other regional regulations drive demand for compliant DRaaS solutions.
- M&A Activity: xx deals closed in the historical period (2019-2024), resulting in market consolidation and expanded service offerings.
- Innovation Barriers: High initial investment costs for infrastructure and specialized expertise can hinder smaller players.
DRAAS Industry Growth Trends & Insights
The DRaaS market witnessed robust growth during the historical period (2019-2024), driven by increasing digital transformation, growing data volumes, and rising cybersecurity threats. The market size reached xx Million units in 2024 and is projected to expand at a CAGR of xx% during the forecast period (2025-2033), reaching xx Million units by 2033. Adoption rates are accelerating, particularly among enterprises seeking business continuity and enhanced disaster recovery capabilities. Technological disruptions, including the rise of cloud-native DRaaS and advancements in AI/ML, are reshaping the competitive landscape. Consumer behavior is shifting towards cloud-based solutions, favoring scalability, pay-as-you-go models, and integrated security features.
Dominant Regions, Countries, or Segments in DRAAS Industry
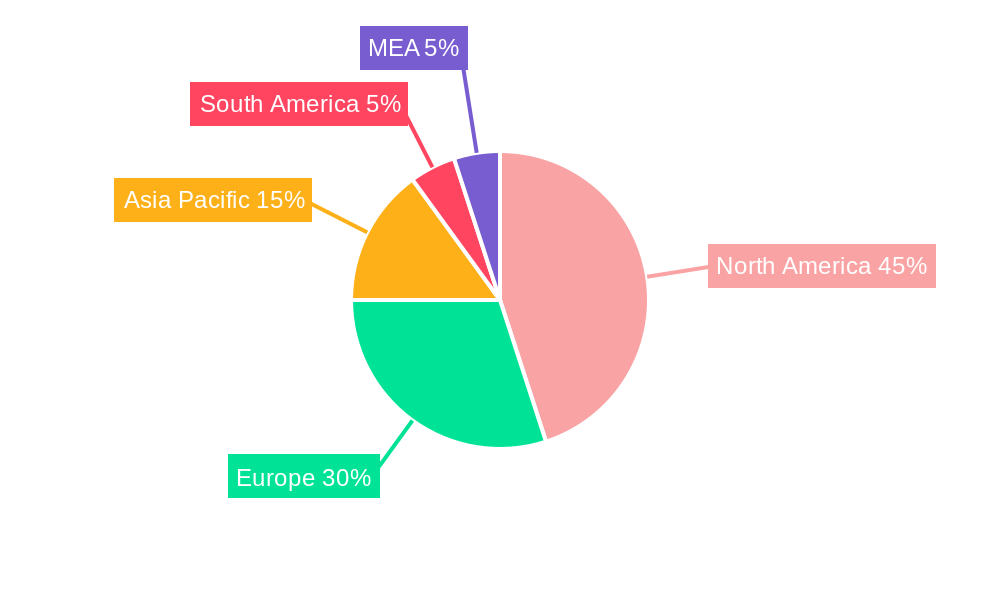
North America currently dominates the DRaaS market, driven by high cloud adoption rates, robust IT infrastructure, and stringent data protection regulations. Within North America, the US holds the largest market share due to its mature technology ecosystem and high concentration of large enterprises. The BFSI and IT sectors are leading adopters, prioritizing data security and business continuity. Europe is showing significant growth potential, fueled by increasing GDPR compliance requirements. Asia Pacific is experiencing rapid expansion, driven by increasing digitalization and rising government investments in IT infrastructure.
- North America (US): High cloud adoption, stringent regulations, mature IT infrastructure, large enterprise concentration.
- Europe: Growing adoption driven by GDPR compliance, robust IT spending.
- Asia Pacific: Rapid growth fueled by increasing digitalization, government investments.
- BFSI & IT Verticals: Highest adoption rates due to critical data and stringent compliance requirements.
DRAAS Industry Product Landscape
DRaaS solutions are evolving beyond basic data backup and recovery. Modern offerings leverage automation, orchestration, and AI/ML to enhance recovery time objectives (RTOs) and recovery point objectives (RPOs). Unique selling propositions include integration with various cloud platforms, advanced security features, and tailored service level agreements (SLAs). Technological advancements like serverless computing and containerization are improving scalability and efficiency. The market is also witnessing a trend toward integrated DRaaS and backup-as-a-service (BaaS) offerings.
Key Drivers, Barriers & Challenges in DRAaaS Industry
Key Drivers:
- Increasing cloud adoption.
- Growing data volumes and complexity.
- Rising cybersecurity threats.
- Stringent data protection regulations.
Challenges:
- High initial investment costs.
- Complexity of integration with existing IT infrastructure.
- Security concerns related to data storage and transmission in the cloud.
- Competition from established players and new entrants. This leads to pressure on pricing and margins, with a potential impact of xx% on average revenue per user (ARPU) by 2033.
Emerging Opportunities in DRAAS Industry
Untapped markets in developing economies present significant opportunities. The integration of DRaaS with IoT and edge computing is a rapidly developing area. Specialized DRaaS solutions for specific industries (e.g., healthcare, manufacturing) are gaining traction. Demand for advanced security features, such as encryption and threat detection, is creating new opportunities. The shift towards serverless architectures and containerized applications is presenting new challenges and opportunities for DRaaS providers.
Growth Accelerators in the DRAAS Industry
Technological breakthroughs, such as advancements in AI-powered recovery and automation, will accelerate market growth. Strategic partnerships between DRaaS providers and cloud platform vendors will expand market reach and enhance service offerings. Market expansion into emerging economies with growing digitalization will drive demand. The adoption of hybrid cloud strategies provides a significant growth opportunity, allowing businesses to utilize both on-premises and cloud-based DRaaS solutions.
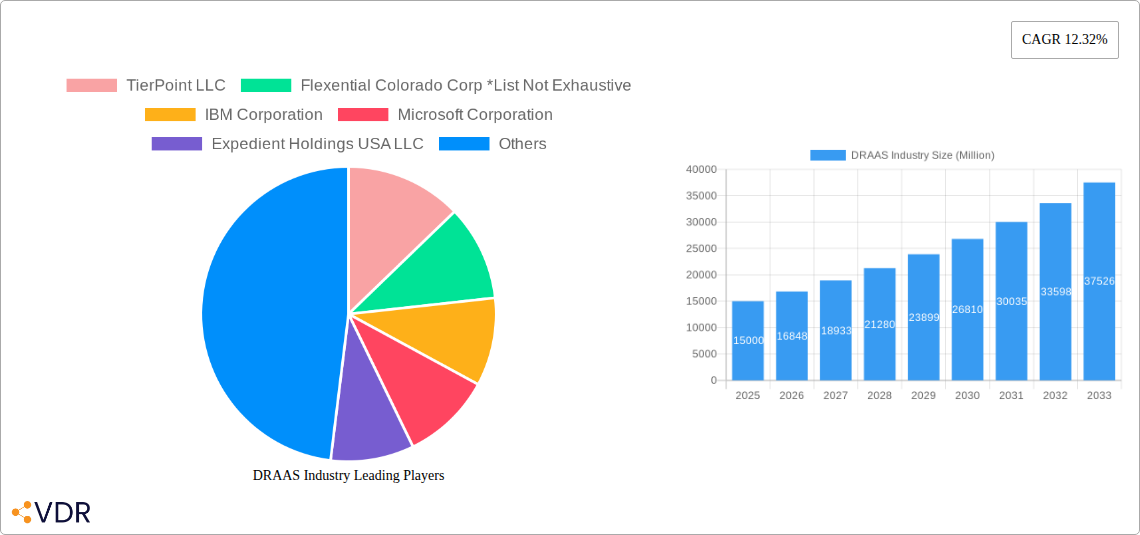
Key Players Shaping the DRAAS Industry Market
- TierPoint LLC
- Flexential Colorado Corp
- IBM Corporation
- Microsoft Corporation
- Expedient Holdings USA LLC
- Cloudhpt
- Recovery Point Systems Inc
- Phoenixnap LLC
- C and W Business Ltd
- Intervision Systems LLC
- Evolve IP LLC
- iLand Internet Solutions Corporation
- Sungard Availability Services LP
Notable Milestones in DRAAS Industry Sector
- November 2022: CyberFortress launched 24/7 live support for its managed DRaaS powered by Veeam.
- February 2022: Otava's VMware-validated cloud-based DRaaS solution was certified, offering RPOs as low as five minutes.
- February 2022: Global Data Vault, a DRaaS provider, was acquired by MSP Dataprise.
In-Depth DRAAS Industry Market Outlook
The DRaaS market is poised for sustained growth, driven by technological innovation, increasing digital transformation, and heightened cybersecurity concerns. Strategic opportunities lie in expanding into underserved markets, developing specialized solutions for niche industries, and leveraging partnerships to broaden market reach. The focus on automation, AI, and enhanced security features will be crucial for success. The market's future potential is significant, promising substantial returns for investors and stakeholders who capitalize on emerging trends and strategic opportunities.
DRAAS Industry Segmentation
-
1. End-user Vertical
- 1.1. BFSI
- 1.2. IT
- 1.3. Government
- 1.4. Healthcare
- 1.5. Other End-user Verticals
DRAAS Industry Segmentation By Geography
- 1. North America
- 2. Europe
- 3. Asia Pacific
- 4. Rest of the World
DRAAS Industry REPORT HIGHLIGHTS
| Aspects | Details |
|---|---|
| Study Period | 2019-2033 |
| Base Year | 2024 |
| Estimated Year | 2025 |
| Forecast Period | 2025-2033 |
| Historical Period | 2019-2024 |
| Growth Rate | CAGR of 12.32% from 2019-2033 |
| Segmentation |
|
Table of Contents
- 1. Introduction
- 1.1. Research Scope
- 1.2. Market Segmentation
- 1.3. Research Methodology
- 1.4. Definitions and Assumptions
- 2. Executive Summary
- 2.1. Introduction
- 3. Market Dynamics
- 3.1. Introduction
- 3.2. Market Drivers
- 3.2.1. Increasing Data Breach and Ransomware Attacks Creating a Need For Robust Data Protection Solutions; Reducing Operational Cost of DRaaS Solutions Compared to Traditional Solutions
- 3.3. Market Restrains
- 3.3.1. Complexity of Deployment and Setting Terms
- 3.4. Market Trends
- 3.4.1. The BFSI Sector is Driving the Market
- 4. Market Factor Analysis
- 4.1. Porters Five Forces
- 4.2. Supply/Value Chain
- 4.3. PESTEL analysis
- 4.4. Market Entropy
- 4.5. Patent/Trademark Analysis
- 5. Global DRAAS Industry Analysis, Insights and Forecast, 2019-2031
- 5.1. Market Analysis, Insights and Forecast - by End-user Vertical
- 5.1.1. BFSI
- 5.1.2. IT
- 5.1.3. Government
- 5.1.4. Healthcare
- 5.1.5. Other End-user Verticals
- 5.2. Market Analysis, Insights and Forecast - by Region
- 5.2.1. North America
- 5.2.2. Europe
- 5.2.3. Asia Pacific
- 5.2.4. Rest of the World
- 5.1. Market Analysis, Insights and Forecast - by End-user Vertical
- 6. North America DRAAS Industry Analysis, Insights and Forecast, 2019-2031
- 6.1. Market Analysis, Insights and Forecast - by End-user Vertical
- 6.1.1. BFSI
- 6.1.2. IT
- 6.1.3. Government
- 6.1.4. Healthcare
- 6.1.5. Other End-user Verticals
- 6.1. Market Analysis, Insights and Forecast - by End-user Vertical
- 7. Europe DRAAS Industry Analysis, Insights and Forecast, 2019-2031
- 7.1. Market Analysis, Insights and Forecast - by End-user Vertical
- 7.1.1. BFSI
- 7.1.2. IT
- 7.1.3. Government
- 7.1.4. Healthcare
- 7.1.5. Other End-user Verticals
- 7.1. Market Analysis, Insights and Forecast - by End-user Vertical
- 8. Asia Pacific DRAAS Industry Analysis, Insights and Forecast, 2019-2031
- 8.1. Market Analysis, Insights and Forecast - by End-user Vertical
- 8.1.1. BFSI
- 8.1.2. IT
- 8.1.3. Government
- 8.1.4. Healthcare
- 8.1.5. Other End-user Verticals
- 8.1. Market Analysis, Insights and Forecast - by End-user Vertical
- 9. Rest of the World DRAAS Industry Analysis, Insights and Forecast, 2019-2031
- 9.1. Market Analysis, Insights and Forecast - by End-user Vertical
- 9.1.1. BFSI
- 9.1.2. IT
- 9.1.3. Government
- 9.1.4. Healthcare
- 9.1.5. Other End-user Verticals
- 9.1. Market Analysis, Insights and Forecast - by End-user Vertical
- 10. North America DRAAS Industry Analysis, Insights and Forecast, 2019-2031
- 10.1. Market Analysis, Insights and Forecast - By Country/Sub-region
- 10.1.1 United States
- 10.1.2 Canada
- 10.1.3 Mexico
- 11. Europe DRAAS Industry Analysis, Insights and Forecast, 2019-2031
- 11.1. Market Analysis, Insights and Forecast - By Country/Sub-region
- 11.1.1 Germany
- 11.1.2 United Kingdom
- 11.1.3 France
- 11.1.4 Spain
- 11.1.5 Italy
- 11.1.6 Spain
- 11.1.7 Belgium
- 11.1.8 Netherland
- 11.1.9 Nordics
- 11.1.10 Rest of Europe
- 12. Asia Pacific DRAAS Industry Analysis, Insights and Forecast, 2019-2031
- 12.1. Market Analysis, Insights and Forecast - By Country/Sub-region
- 12.1.1 China
- 12.1.2 Japan
- 12.1.3 India
- 12.1.4 South Korea
- 12.1.5 Southeast Asia
- 12.1.6 Australia
- 12.1.7 Indonesia
- 12.1.8 Phillipes
- 12.1.9 Singapore
- 12.1.10 Thailandc
- 12.1.11 Rest of Asia Pacific
- 13. South America DRAAS Industry Analysis, Insights and Forecast, 2019-2031
- 13.1. Market Analysis, Insights and Forecast - By Country/Sub-region
- 13.1.1 Brazil
- 13.1.2 Argentina
- 13.1.3 Peru
- 13.1.4 Chile
- 13.1.5 Colombia
- 13.1.6 Ecuador
- 13.1.7 Venezuela
- 13.1.8 Rest of South America
- 14. North America DRAAS Industry Analysis, Insights and Forecast, 2019-2031
- 14.1. Market Analysis, Insights and Forecast - By Country/Sub-region
- 14.1.1 United States
- 14.1.2 Canada
- 14.1.3 Mexico
- 15. MEA DRAAS Industry Analysis, Insights and Forecast, 2019-2031
- 15.1. Market Analysis, Insights and Forecast - By Country/Sub-region
- 15.1.1 United Arab Emirates
- 15.1.2 Saudi Arabia
- 15.1.3 South Africa
- 15.1.4 Rest of Middle East and Africa
- 16. Competitive Analysis
- 16.1. Global Market Share Analysis 2024
- 16.2. Company Profiles
- 16.2.1 TierPoint LLC
- 16.2.1.1. Overview
- 16.2.1.2. Products
- 16.2.1.3. SWOT Analysis
- 16.2.1.4. Recent Developments
- 16.2.1.5. Financials (Based on Availability)
- 16.2.2 Flexential Colorado Corp *List Not Exhaustive
- 16.2.2.1. Overview
- 16.2.2.2. Products
- 16.2.2.3. SWOT Analysis
- 16.2.2.4. Recent Developments
- 16.2.2.5. Financials (Based on Availability)
- 16.2.3 IBM Corporation
- 16.2.3.1. Overview
- 16.2.3.2. Products
- 16.2.3.3. SWOT Analysis
- 16.2.3.4. Recent Developments
- 16.2.3.5. Financials (Based on Availability)
- 16.2.4 Microsoft Corporation
- 16.2.4.1. Overview
- 16.2.4.2. Products
- 16.2.4.3. SWOT Analysis
- 16.2.4.4. Recent Developments
- 16.2.4.5. Financials (Based on Availability)
- 16.2.5 Expedient Holdings USA LLC
- 16.2.5.1. Overview
- 16.2.5.2. Products
- 16.2.5.3. SWOT Analysis
- 16.2.5.4. Recent Developments
- 16.2.5.5. Financials (Based on Availability)
- 16.2.6 Cloudhpt
- 16.2.6.1. Overview
- 16.2.6.2. Products
- 16.2.6.3. SWOT Analysis
- 16.2.6.4. Recent Developments
- 16.2.6.5. Financials (Based on Availability)
- 16.2.7 Recovery Point Systems Inc
- 16.2.7.1. Overview
- 16.2.7.2. Products
- 16.2.7.3. SWOT Analysis
- 16.2.7.4. Recent Developments
- 16.2.7.5. Financials (Based on Availability)
- 16.2.8 Phoenixnap LLC
- 16.2.8.1. Overview
- 16.2.8.2. Products
- 16.2.8.3. SWOT Analysis
- 16.2.8.4. Recent Developments
- 16.2.8.5. Financials (Based on Availability)
- 16.2.9 C and W Business Ltd
- 16.2.9.1. Overview
- 16.2.9.2. Products
- 16.2.9.3. SWOT Analysis
- 16.2.9.4. Recent Developments
- 16.2.9.5. Financials (Based on Availability)
- 16.2.10 Intervision Systems LLC
- 16.2.10.1. Overview
- 16.2.10.2. Products
- 16.2.10.3. SWOT Analysis
- 16.2.10.4. Recent Developments
- 16.2.10.5. Financials (Based on Availability)
- 16.2.11 Evolve IP LLC
- 16.2.11.1. Overview
- 16.2.11.2. Products
- 16.2.11.3. SWOT Analysis
- 16.2.11.4. Recent Developments
- 16.2.11.5. Financials (Based on Availability)
- 16.2.12 iLand Internet Solutions Corporation
- 16.2.12.1. Overview
- 16.2.12.2. Products
- 16.2.12.3. SWOT Analysis
- 16.2.12.4. Recent Developments
- 16.2.12.5. Financials (Based on Availability)
- 16.2.13 Sungard Availability Services LP
- 16.2.13.1. Overview
- 16.2.13.2. Products
- 16.2.13.3. SWOT Analysis
- 16.2.13.4. Recent Developments
- 16.2.13.5. Financials (Based on Availability)
- 16.2.1 TierPoint LLC
List of Figures
- Figure 1: Global DRAAS Industry Revenue Breakdown (Million, %) by Region 2024 & 2032
- Figure 2: North America DRAAS Industry Revenue (Million), by Country 2024 & 2032
- Figure 3: North America DRAAS Industry Revenue Share (%), by Country 2024 & 2032
- Figure 4: Europe DRAAS Industry Revenue (Million), by Country 2024 & 2032
- Figure 5: Europe DRAAS Industry Revenue Share (%), by Country 2024 & 2032
- Figure 6: Asia Pacific DRAAS Industry Revenue (Million), by Country 2024 & 2032
- Figure 7: Asia Pacific DRAAS Industry Revenue Share (%), by Country 2024 & 2032
- Figure 8: South America DRAAS Industry Revenue (Million), by Country 2024 & 2032
- Figure 9: South America DRAAS Industry Revenue Share (%), by Country 2024 & 2032
- Figure 10: North America DRAAS Industry Revenue (Million), by Country 2024 & 2032
- Figure 11: North America DRAAS Industry Revenue Share (%), by Country 2024 & 2032
- Figure 12: MEA DRAAS Industry Revenue (Million), by Country 2024 & 2032
- Figure 13: MEA DRAAS Industry Revenue Share (%), by Country 2024 & 2032
- Figure 14: North America DRAAS Industry Revenue (Million), by End-user Vertical 2024 & 2032
- Figure 15: North America DRAAS Industry Revenue Share (%), by End-user Vertical 2024 & 2032
- Figure 16: North America DRAAS Industry Revenue (Million), by Country 2024 & 2032
- Figure 17: North America DRAAS Industry Revenue Share (%), by Country 2024 & 2032
- Figure 18: Europe DRAAS Industry Revenue (Million), by End-user Vertical 2024 & 2032
- Figure 19: Europe DRAAS Industry Revenue Share (%), by End-user Vertical 2024 & 2032
- Figure 20: Europe DRAAS Industry Revenue (Million), by Country 2024 & 2032
- Figure 21: Europe DRAAS Industry Revenue Share (%), by Country 2024 & 2032
- Figure 22: Asia Pacific DRAAS Industry Revenue (Million), by End-user Vertical 2024 & 2032
- Figure 23: Asia Pacific DRAAS Industry Revenue Share (%), by End-user Vertical 2024 & 2032
- Figure 24: Asia Pacific DRAAS Industry Revenue (Million), by Country 2024 & 2032
- Figure 25: Asia Pacific DRAAS Industry Revenue Share (%), by Country 2024 & 2032
- Figure 26: Rest of the World DRAAS Industry Revenue (Million), by End-user Vertical 2024 & 2032
- Figure 27: Rest of the World DRAAS Industry Revenue Share (%), by End-user Vertical 2024 & 2032
- Figure 28: Rest of the World DRAAS Industry Revenue (Million), by Country 2024 & 2032
- Figure 29: Rest of the World DRAAS Industry Revenue Share (%), by Country 2024 & 2032
List of Tables
- Table 1: Global DRAAS Industry Revenue Million Forecast, by Region 2019 & 2032
- Table 2: Global DRAAS Industry Revenue Million Forecast, by End-user Vertical 2019 & 2032
- Table 3: Global DRAAS Industry Revenue Million Forecast, by Region 2019 & 2032
- Table 4: Global DRAAS Industry Revenue Million Forecast, by Country 2019 & 2032
- Table 5: United States DRAAS Industry Revenue (Million) Forecast, by Application 2019 & 2032
- Table 6: Canada DRAAS Industry Revenue (Million) Forecast, by Application 2019 & 2032
- Table 7: Mexico DRAAS Industry Revenue (Million) Forecast, by Application 2019 & 2032
- Table 8: Global DRAAS Industry Revenue Million Forecast, by Country 2019 & 2032
- Table 9: Germany DRAAS Industry Revenue (Million) Forecast, by Application 2019 & 2032
- Table 10: United Kingdom DRAAS Industry Revenue (Million) Forecast, by Application 2019 & 2032
- Table 11: France DRAAS Industry Revenue (Million) Forecast, by Application 2019 & 2032
- Table 12: Spain DRAAS Industry Revenue (Million) Forecast, by Application 2019 & 2032
- Table 13: Italy DRAAS Industry Revenue (Million) Forecast, by Application 2019 & 2032
- Table 14: Spain DRAAS Industry Revenue (Million) Forecast, by Application 2019 & 2032
- Table 15: Belgium DRAAS Industry Revenue (Million) Forecast, by Application 2019 & 2032
- Table 16: Netherland DRAAS Industry Revenue (Million) Forecast, by Application 2019 & 2032
- Table 17: Nordics DRAAS Industry Revenue (Million) Forecast, by Application 2019 & 2032
- Table 18: Rest of Europe DRAAS Industry Revenue (Million) Forecast, by Application 2019 & 2032
- Table 19: Global DRAAS Industry Revenue Million Forecast, by Country 2019 & 2032
- Table 20: China DRAAS Industry Revenue (Million) Forecast, by Application 2019 & 2032
- Table 21: Japan DRAAS Industry Revenue (Million) Forecast, by Application 2019 & 2032
- Table 22: India DRAAS Industry Revenue (Million) Forecast, by Application 2019 & 2032
- Table 23: South Korea DRAAS Industry Revenue (Million) Forecast, by Application 2019 & 2032
- Table 24: Southeast Asia DRAAS Industry Revenue (Million) Forecast, by Application 2019 & 2032
- Table 25: Australia DRAAS Industry Revenue (Million) Forecast, by Application 2019 & 2032
- Table 26: Indonesia DRAAS Industry Revenue (Million) Forecast, by Application 2019 & 2032
- Table 27: Phillipes DRAAS Industry Revenue (Million) Forecast, by Application 2019 & 2032
- Table 28: Singapore DRAAS Industry Revenue (Million) Forecast, by Application 2019 & 2032
- Table 29: Thailandc DRAAS Industry Revenue (Million) Forecast, by Application 2019 & 2032
- Table 30: Rest of Asia Pacific DRAAS Industry Revenue (Million) Forecast, by Application 2019 & 2032
- Table 31: Global DRAAS Industry Revenue Million Forecast, by Country 2019 & 2032
- Table 32: Brazil DRAAS Industry Revenue (Million) Forecast, by Application 2019 & 2032
- Table 33: Argentina DRAAS Industry Revenue (Million) Forecast, by Application 2019 & 2032
- Table 34: Peru DRAAS Industry Revenue (Million) Forecast, by Application 2019 & 2032
- Table 35: Chile DRAAS Industry Revenue (Million) Forecast, by Application 2019 & 2032
- Table 36: Colombia DRAAS Industry Revenue (Million) Forecast, by Application 2019 & 2032
- Table 37: Ecuador DRAAS Industry Revenue (Million) Forecast, by Application 2019 & 2032
- Table 38: Venezuela DRAAS Industry Revenue (Million) Forecast, by Application 2019 & 2032
- Table 39: Rest of South America DRAAS Industry Revenue (Million) Forecast, by Application 2019 & 2032
- Table 40: Global DRAAS Industry Revenue Million Forecast, by Country 2019 & 2032
- Table 41: United States DRAAS Industry Revenue (Million) Forecast, by Application 2019 & 2032
- Table 42: Canada DRAAS Industry Revenue (Million) Forecast, by Application 2019 & 2032
- Table 43: Mexico DRAAS Industry Revenue (Million) Forecast, by Application 2019 & 2032
- Table 44: Global DRAAS Industry Revenue Million Forecast, by Country 2019 & 2032
- Table 45: United Arab Emirates DRAAS Industry Revenue (Million) Forecast, by Application 2019 & 2032
- Table 46: Saudi Arabia DRAAS Industry Revenue (Million) Forecast, by Application 2019 & 2032
- Table 47: South Africa DRAAS Industry Revenue (Million) Forecast, by Application 2019 & 2032
- Table 48: Rest of Middle East and Africa DRAAS Industry Revenue (Million) Forecast, by Application 2019 & 2032
- Table 49: Global DRAAS Industry Revenue Million Forecast, by End-user Vertical 2019 & 2032
- Table 50: Global DRAAS Industry Revenue Million Forecast, by Country 2019 & 2032
- Table 51: Global DRAAS Industry Revenue Million Forecast, by End-user Vertical 2019 & 2032
- Table 52: Global DRAAS Industry Revenue Million Forecast, by Country 2019 & 2032
- Table 53: Global DRAAS Industry Revenue Million Forecast, by End-user Vertical 2019 & 2032
- Table 54: Global DRAAS Industry Revenue Million Forecast, by Country 2019 & 2032
- Table 55: Global DRAAS Industry Revenue Million Forecast, by End-user Vertical 2019 & 2032
- Table 56: Global DRAAS Industry Revenue Million Forecast, by Country 2019 & 2032
Frequently Asked Questions
1. What is the projected Compound Annual Growth Rate (CAGR) of the DRAAS Industry?
The projected CAGR is approximately 12.32%.
2. Which companies are prominent players in the DRAAS Industry?
Key companies in the market include TierPoint LLC, Flexential Colorado Corp *List Not Exhaustive, IBM Corporation, Microsoft Corporation, Expedient Holdings USA LLC, Cloudhpt, Recovery Point Systems Inc, Phoenixnap LLC, C and W Business Ltd, Intervision Systems LLC, Evolve IP LLC, iLand Internet Solutions Corporation, Sungard Availability Services LP.
3. What are the main segments of the DRAAS Industry?
The market segments include End-user Vertical.
4. Can you provide details about the market size?
The market size is estimated to be USD XX Million as of 2022.
5. What are some drivers contributing to market growth?
Increasing Data Breach and Ransomware Attacks Creating a Need For Robust Data Protection Solutions; Reducing Operational Cost of DRaaS Solutions Compared to Traditional Solutions.
6. What are the notable trends driving market growth?
The BFSI Sector is Driving the Market.
7. Are there any restraints impacting market growth?
Complexity of Deployment and Setting Terms.
8. Can you provide examples of recent developments in the market?
November 2022: CyberFortress, a managed data backup built to prevent business disruption through a rapid recovery provider, announced the launch of the company's 247 live support for all backup and recovery products and services. The company provides a complete suite of solutions and services, including Managed DRaaS powered by Veeam.
9. What pricing options are available for accessing the report?
Pricing options include single-user, multi-user, and enterprise licenses priced at USD 4750, USD 5250, and USD 8750 respectively.
10. Is the market size provided in terms of value or volume?
The market size is provided in terms of value, measured in Million.
11. Are there any specific market keywords associated with the report?
Yes, the market keyword associated with the report is "DRAAS Industry," which aids in identifying and referencing the specific market segment covered.
12. How do I determine which pricing option suits my needs best?
The pricing options vary based on user requirements and access needs. Individual users may opt for single-user licenses, while businesses requiring broader access may choose multi-user or enterprise licenses for cost-effective access to the report.
13. Are there any additional resources or data provided in the DRAAS Industry report?
While the report offers comprehensive insights, it's advisable to review the specific contents or supplementary materials provided to ascertain if additional resources or data are available.
14. How can I stay updated on further developments or reports in the DRAAS Industry?
To stay informed about further developments, trends, and reports in the DRAAS Industry, consider subscribing to industry newsletters, following relevant companies and organizations, or regularly checking reputable industry news sources and publications.
Methodology
Step 1 - Identification of Relevant Samples Size from Population Database


Step 2 - Approaches for Defining Global Market Size (Value, Volume* & Price*)

Note*: In applicable scenarios
Step 3 - Data Sources
Primary Research
- Web Analytics
- Survey Reports
- Research Institute
- Latest Research Reports
- Opinion Leaders
Secondary Research
- Annual Reports
- White Paper
- Latest Press Release
- Industry Association
- Paid Database
- Investor Presentations

Step 4 - Data Triangulation
Involves using different sources of information in order to increase the validity of a study
These sources are likely to be stakeholders in a program - participants, other researchers, program staff, other community members, and so on.
Then we put all data in single framework & apply various statistical tools to find out the dynamic on the market.
During the analysis stage, feedback from the stakeholder groups would be compared to determine areas of agreement as well as areas of divergence


