
Key Insights
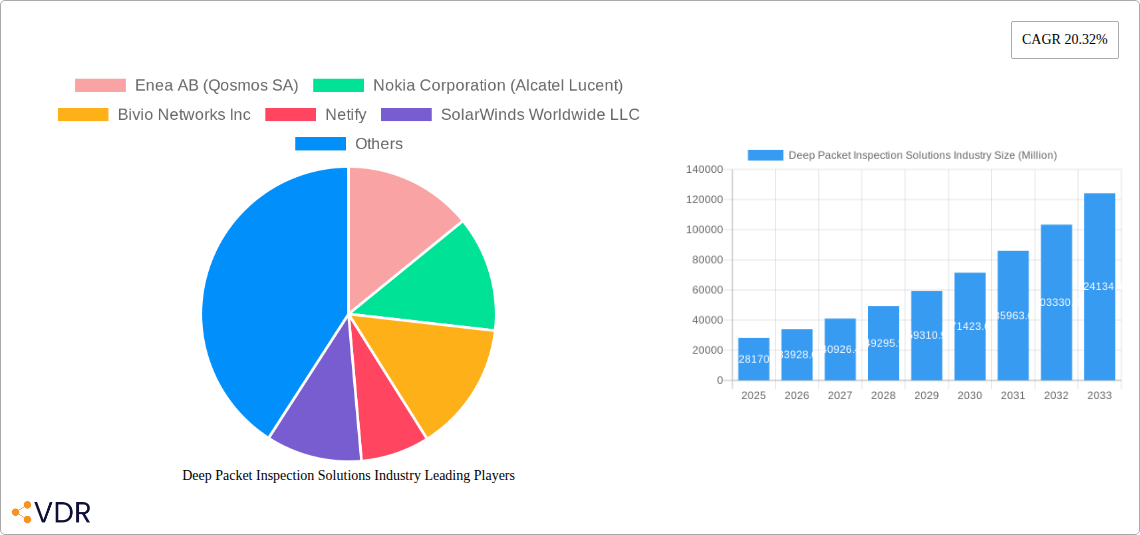
The Deep Packet Inspection (DPI) solutions market is experiencing robust growth, projected to reach a market size of $28.17 billion by 2025, exhibiting a Compound Annual Growth Rate (CAGR) of 20.32%. This expansion is fueled by several key factors. The increasing adoption of cloud computing and the subsequent rise in cyber threats necessitate robust network security solutions. DPI, with its ability to analyze network traffic at a granular level, plays a crucial role in identifying and mitigating these threats, including malware, data breaches, and denial-of-service attacks. Furthermore, the burgeoning demand for advanced network management and optimization tools, particularly within the telecom and IT sectors, is driving DPI adoption. Government regulations mandating enhanced network security and data privacy compliance also contribute significantly to market growth. The market is segmented by deployment (on-premise and cloud), end-user (telecom and IT, BFSI, healthcare, retail, and others), and solution (hardware and software). The cloud deployment model is witnessing faster growth due to its scalability, cost-effectiveness, and ease of management. North America and Europe currently hold significant market shares, but the Asia-Pacific region is poised for substantial growth due to increasing digitalization and infrastructure development. Competitive landscape is marked by both established players like Cisco and Nokia, and emerging technology providers, leading to innovation and diverse solution offerings.
The forecast period from 2025 to 2033 anticipates continued expansion, driven by the convergence of 5G networks, the Internet of Things (IoT), and the growing adoption of artificial intelligence (AI) for network security. These technologies increase network complexity and data volume, thereby intensifying the need for advanced DPI solutions. While the market faces some restraints, such as high implementation costs and concerns about network latency, the overall growth trajectory remains positive, driven by the critical role DPI plays in ensuring network security, compliance, and performance optimization across diverse industries. The market's future hinges on the ongoing development of innovative DPI technologies, including AI-powered solutions, capable of handling increasingly complex network environments and evolving cyber threats.
Deep Packet Inspection Solutions Industry Market Report: 2019-2033
This comprehensive report provides a detailed analysis of the Deep Packet Inspection (DPI) Solutions market, encompassing market dynamics, growth trends, regional segmentation, product landscape, key players, and future outlook. The study period covers 2019-2033, with a base year of 2025 and a forecast period of 2025-2033. This report is invaluable for industry professionals, investors, and strategic decision-makers seeking a deep understanding of this rapidly evolving market.
Deep Packet Inspection Solutions Industry Market Dynamics & Structure
The Deep Packet Inspection Solutions market is characterized by moderate concentration, with a few major players holding significant market share. Technological innovation, particularly in areas like AI-powered DPI and encrypted traffic analysis, is a key driver. Regulatory frameworks concerning data privacy and cybersecurity significantly influence market growth and adoption. Competitive substitutes include traditional network monitoring tools, but DPI solutions offer superior granularity and threat detection capabilities. End-user demographics are diverse, spanning telecom, IT, BFSI, healthcare, and retail, each with unique DPI needs. M&A activity in the sector has been relatively steady, with approximately xx deals recorded between 2019 and 2024, contributing to market consolidation.
- Market Concentration: Moderately concentrated, with top 5 players holding approximately xx% market share in 2024.
- Technological Innovation: AI/ML integration, encrypted traffic analysis, and improved scalability are major drivers.
- Regulatory Landscape: GDPR, CCPA, and other data privacy regulations impact DPI deployment and data usage.
- Competitive Substitutes: Traditional network monitoring tools offer limited functionality compared to DPI solutions.
- M&A Activity: Approximately xx M&A deals between 2019 and 2024, leading to increased market consolidation.
- End-User Demographics: Telecom and IT sectors dominate, followed by BFSI and Healthcare.
Deep Packet Inspection Solutions Industry Growth Trends & Insights
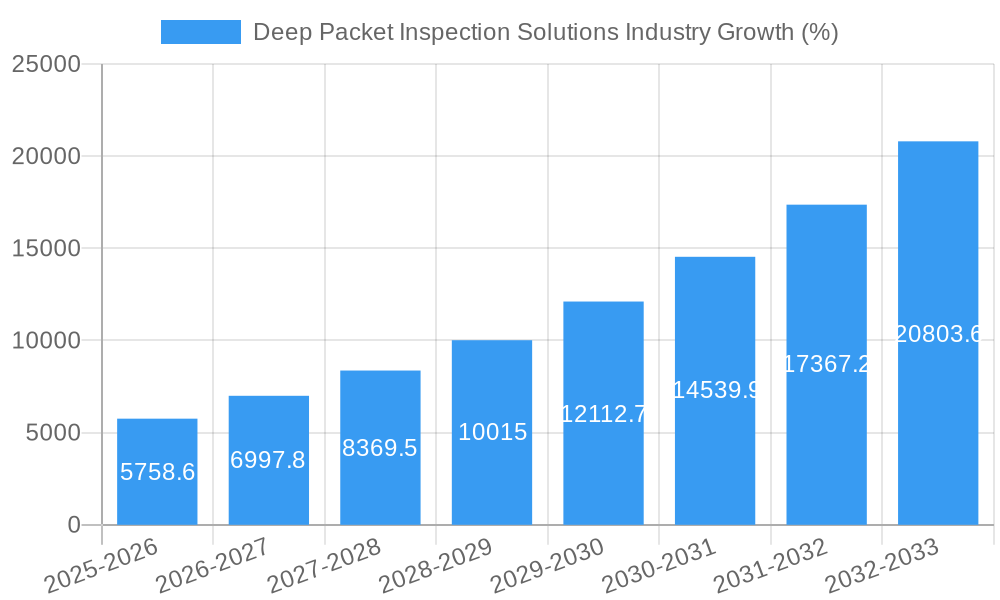
The Deep Packet Inspection Solutions market experienced a Compound Annual Growth Rate (CAGR) of xx% during the historical period (2019-2024), reaching a market size of $xx Million in 2024. This growth is fueled by increasing network traffic, heightened cybersecurity concerns, and the rising adoption of cloud-based solutions. Technological disruptions, such as the shift towards 5G and the Internet of Things (IoT), are creating new opportunities for DPI solutions. Consumer behavior shifts towards increased online activities and digital transactions are further driving market demand. The market is expected to maintain a healthy CAGR of xx% during the forecast period (2025-2033), reaching a projected size of $xx Million by 2033. Market penetration in key sectors like Telecom and IT remains relatively high, while growth opportunities exist in other sectors, especially Healthcare and Retail.
Dominant Regions, Countries, or Segments in Deep Packet Inspection Solutions Industry
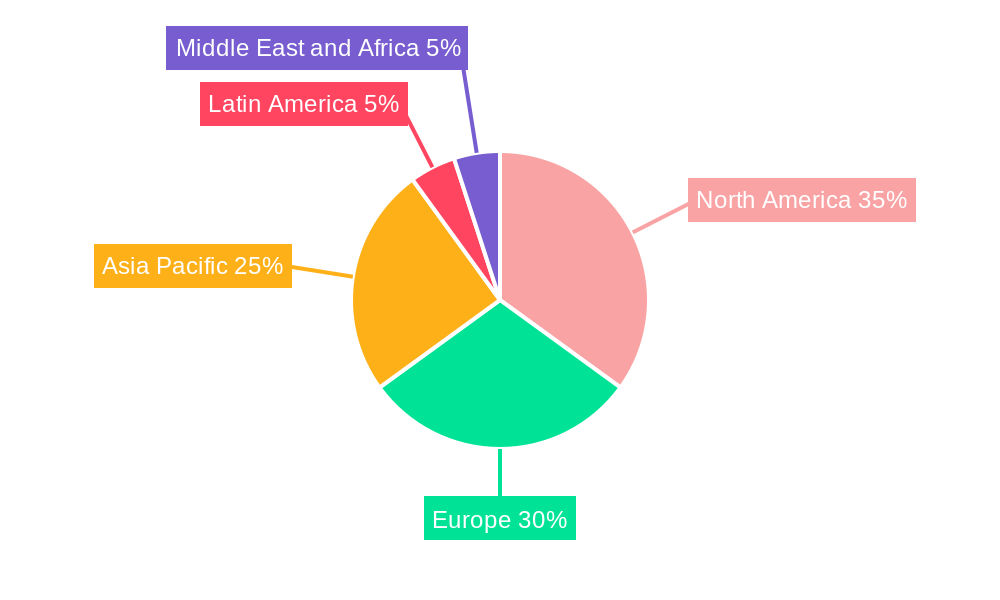
North America currently holds the largest market share in the DPI Solutions market, driven by robust IT infrastructure, high adoption of cloud computing, and stringent cybersecurity regulations. Europe follows closely, with strong growth driven by GDPR compliance and increasing investments in digital infrastructure. Asia-Pacific is emerging as a high-growth region, fueled by rapid technological advancements and economic growth.
Leading Segments:
- Deployment: Cloud deployments are experiencing faster growth than on-premise due to scalability and cost-effectiveness. The Cloud segment is projected to hold xx% of the market share by 2033.
- End-User: The Telecom and IT sectors are dominant, with a combined market share of approximately xx% in 2024. However, the BFSI and Healthcare sectors show significant growth potential due to increasing data security needs.
- Solution: Software-based DPI solutions are gaining traction due to flexibility and cost-effectiveness compared to hardware solutions. The Software segment is projected to hold xx% of the market by 2033.
Deep Packet Inspection Solutions Industry Product Landscape
DPI solutions are constantly evolving, with advancements focusing on improved performance, enhanced accuracy, and expanded functionality. Next-generation DPI solutions leverage AI and machine learning algorithms for advanced threat detection and anomaly identification. Key features include real-time traffic analysis, encrypted traffic inspection, and application identification. Unique selling propositions include the ability to identify and mitigate advanced threats, provide granular visibility into network traffic, and streamline security operations.
Key Drivers, Barriers & Challenges in Deep Packet Inspection Solutions Industry
Key Drivers:
- Increased network traffic and cyber threats
- Growing adoption of cloud-based services
- Stringent data privacy and security regulations
Key Challenges:
- High implementation costs
- Complexity of DPI technology
- Concerns about data privacy and compliance
Emerging Opportunities in Deep Packet Inspection Solutions Industry
Emerging opportunities include the growing adoption of 5G and IoT, leading to increased demand for efficient DPI solutions. Expansion into untapped markets like the Industrial IoT (IIoT) and the automotive sector presents significant growth potential. The development of DPI solutions tailored to specific industry needs (e.g., healthcare, finance) will drive further market expansion.
Growth Accelerators in the Deep Packet Inspection Solutions Industry
Technological advancements in AI and machine learning, coupled with strategic partnerships between DPI solution providers and network equipment manufacturers, are accelerating market growth. Expanding into emerging markets and adopting innovative go-to-market strategies, such as cloud-based service delivery models, will drive further market expansion.
Key Players Shaping the Deep Packet Inspection Solutions Industry Market
- Enea AB (Qosmos SA)
- Nokia Corporation (Alcatel Lucent)
- Bivio Networks Inc
- Netify
- SolarWinds Worldwide LLC
- Cisco Systems Inc
- NetFort Technologies Limited (Rapid, Allot Ltd, ipoque GmbH)
- WiseSpot Company Limited
- Huawei Technologies Co Ltd
- ManageEngine (Zoho Corporation)
- AppNeta Inc
Notable Milestones in Deep Packet Inspection Solutions Industry Sector
- February 2024: ipoque showcased its DPI and ETI solutions at MWC Barcelona 2024.
- May 2023: ipoque showcased its OEM network analytics solutions suite at Cisco Live 2023.
In-Depth Deep Packet Inspection Solutions Industry Market Outlook
The Deep Packet Inspection Solutions market is poised for sustained growth, driven by increasing digitalization, rising cybersecurity threats, and the adoption of advanced technologies like AI and 5G. Strategic partnerships, innovative product development, and expansion into new markets will further propel market growth. The market's long-term potential is significant, with opportunities for both established players and new entrants.
Deep Packet Inspection Solutions Industry Segmentation
-
1. Solution
- 1.1. Hardware
- 1.2. Software
-
2. Deployment
- 2.1. On-Premise
- 2.2. Cloud
-
3. End-User
- 3.1. Telecom and IT
- 3.2. BFSI
- 3.3. Healthcare
- 3.4. Retail
- 3.5. Other End-Users
Deep Packet Inspection Solutions Industry Segmentation By Geography
-
1. North America
- 1.1. United States
- 1.2. Canada
-
2. Europe
- 2.1. Germany
- 2.2. United Kingdom
- 2.3. France
- 2.4. Rest of Europe
-
3. Asia Pacific
- 3.1. China
- 3.2. Japan
- 3.3. Australia
- 3.4. Rest of Asia Pacific
- 4. Latin America
- 5. Middle East and Africa
Deep Packet Inspection Solutions Industry REPORT HIGHLIGHTS
| Aspects | Details |
|---|---|
| Study Period | 2019-2033 |
| Base Year | 2024 |
| Estimated Year | 2025 |
| Forecast Period | 2025-2033 |
| Historical Period | 2019-2024 |
| Growth Rate | CAGR of 20.32% from 2019-2033 |
| Segmentation |
|
Table of Contents
- 1. Introduction
- 1.1. Research Scope
- 1.2. Market Segmentation
- 1.3. Research Methodology
- 1.4. Definitions and Assumptions
- 2. Executive Summary
- 2.1. Introduction
- 3. Market Dynamics
- 3.1. Introduction
- 3.2. Market Drivers
- 3.2.1. Increasing Adoption of Regulatory and Data Protection Laws; High Adoption of Cloud Based Security Technologies
- 3.3. Market Restrains
- 3.3.1. DPI Adds to the Complexity and Unwieldy Nature of Existing Firewalls and Other Security-Related Software
- 3.4. Market Trends
- 3.4.1. Software Solution to Witness Significant Growth With Increasing Enterprise Internet Traffic
- 4. Market Factor Analysis
- 4.1. Porters Five Forces
- 4.2. Supply/Value Chain
- 4.3. PESTEL analysis
- 4.4. Market Entropy
- 4.5. Patent/Trademark Analysis
- 5. Global Deep Packet Inspection Solutions Industry Analysis, Insights and Forecast, 2019-2031
- 5.1. Market Analysis, Insights and Forecast - by Solution
- 5.1.1. Hardware
- 5.1.2. Software
- 5.2. Market Analysis, Insights and Forecast - by Deployment
- 5.2.1. On-Premise
- 5.2.2. Cloud
- 5.3. Market Analysis, Insights and Forecast - by End-User
- 5.3.1. Telecom and IT
- 5.3.2. BFSI
- 5.3.3. Healthcare
- 5.3.4. Retail
- 5.3.5. Other End-Users
- 5.4. Market Analysis, Insights and Forecast - by Region
- 5.4.1. North America
- 5.4.2. Europe
- 5.4.3. Asia Pacific
- 5.4.4. Latin America
- 5.4.5. Middle East and Africa
- 5.1. Market Analysis, Insights and Forecast - by Solution
- 6. North America Deep Packet Inspection Solutions Industry Analysis, Insights and Forecast, 2019-2031
- 6.1. Market Analysis, Insights and Forecast - by Solution
- 6.1.1. Hardware
- 6.1.2. Software
- 6.2. Market Analysis, Insights and Forecast - by Deployment
- 6.2.1. On-Premise
- 6.2.2. Cloud
- 6.3. Market Analysis, Insights and Forecast - by End-User
- 6.3.1. Telecom and IT
- 6.3.2. BFSI
- 6.3.3. Healthcare
- 6.3.4. Retail
- 6.3.5. Other End-Users
- 6.1. Market Analysis, Insights and Forecast - by Solution
- 7. Europe Deep Packet Inspection Solutions Industry Analysis, Insights and Forecast, 2019-2031
- 7.1. Market Analysis, Insights and Forecast - by Solution
- 7.1.1. Hardware
- 7.1.2. Software
- 7.2. Market Analysis, Insights and Forecast - by Deployment
- 7.2.1. On-Premise
- 7.2.2. Cloud
- 7.3. Market Analysis, Insights and Forecast - by End-User
- 7.3.1. Telecom and IT
- 7.3.2. BFSI
- 7.3.3. Healthcare
- 7.3.4. Retail
- 7.3.5. Other End-Users
- 7.1. Market Analysis, Insights and Forecast - by Solution
- 8. Asia Pacific Deep Packet Inspection Solutions Industry Analysis, Insights and Forecast, 2019-2031
- 8.1. Market Analysis, Insights and Forecast - by Solution
- 8.1.1. Hardware
- 8.1.2. Software
- 8.2. Market Analysis, Insights and Forecast - by Deployment
- 8.2.1. On-Premise
- 8.2.2. Cloud
- 8.3. Market Analysis, Insights and Forecast - by End-User
- 8.3.1. Telecom and IT
- 8.3.2. BFSI
- 8.3.3. Healthcare
- 8.3.4. Retail
- 8.3.5. Other End-Users
- 8.1. Market Analysis, Insights and Forecast - by Solution
- 9. Latin America Deep Packet Inspection Solutions Industry Analysis, Insights and Forecast, 2019-2031
- 9.1. Market Analysis, Insights and Forecast - by Solution
- 9.1.1. Hardware
- 9.1.2. Software
- 9.2. Market Analysis, Insights and Forecast - by Deployment
- 9.2.1. On-Premise
- 9.2.2. Cloud
- 9.3. Market Analysis, Insights and Forecast - by End-User
- 9.3.1. Telecom and IT
- 9.3.2. BFSI
- 9.3.3. Healthcare
- 9.3.4. Retail
- 9.3.5. Other End-Users
- 9.1. Market Analysis, Insights and Forecast - by Solution
- 10. Middle East and Africa Deep Packet Inspection Solutions Industry Analysis, Insights and Forecast, 2019-2031
- 10.1. Market Analysis, Insights and Forecast - by Solution
- 10.1.1. Hardware
- 10.1.2. Software
- 10.2. Market Analysis, Insights and Forecast - by Deployment
- 10.2.1. On-Premise
- 10.2.2. Cloud
- 10.3. Market Analysis, Insights and Forecast - by End-User
- 10.3.1. Telecom and IT
- 10.3.2. BFSI
- 10.3.3. Healthcare
- 10.3.4. Retail
- 10.3.5. Other End-Users
- 10.1. Market Analysis, Insights and Forecast - by Solution
- 11. North America Deep Packet Inspection Solutions Industry Analysis, Insights and Forecast, 2019-2031
- 11.1. Market Analysis, Insights and Forecast - By Country/Sub-region
- 11.1.1 United States
- 11.1.2 Canada
- 12. Europe Deep Packet Inspection Solutions Industry Analysis, Insights and Forecast, 2019-2031
- 12.1. Market Analysis, Insights and Forecast - By Country/Sub-region
- 12.1.1 Germany
- 12.1.2 United Kingdom
- 12.1.3 France
- 12.1.4 Rest of Europe
- 13. Asia Pacific Deep Packet Inspection Solutions Industry Analysis, Insights and Forecast, 2019-2031
- 13.1. Market Analysis, Insights and Forecast - By Country/Sub-region
- 13.1.1 China
- 13.1.2 Japan
- 13.1.3 Australia
- 13.1.4 Rest of Asia Pacific
- 14. Latin America Deep Packet Inspection Solutions Industry Analysis, Insights and Forecast, 2019-2031
- 14.1. Market Analysis, Insights and Forecast - By Country/Sub-region
- 14.1.1.
- 15. Middle East and Africa Deep Packet Inspection Solutions Industry Analysis, Insights and Forecast, 2019-2031
- 15.1. Market Analysis, Insights and Forecast - By Country/Sub-region
- 15.1.1.
- 16. Competitive Analysis
- 16.1. Global Market Share Analysis 2024
- 16.2. Company Profiles
- 16.2.1 Enea AB (Qosmos SA)
- 16.2.1.1. Overview
- 16.2.1.2. Products
- 16.2.1.3. SWOT Analysis
- 16.2.1.4. Recent Developments
- 16.2.1.5. Financials (Based on Availability)
- 16.2.2 Nokia Corporation (Alcatel Lucent)
- 16.2.2.1. Overview
- 16.2.2.2. Products
- 16.2.2.3. SWOT Analysis
- 16.2.2.4. Recent Developments
- 16.2.2.5. Financials (Based on Availability)
- 16.2.3 Bivio Networks Inc
- 16.2.3.1. Overview
- 16.2.3.2. Products
- 16.2.3.3. SWOT Analysis
- 16.2.3.4. Recent Developments
- 16.2.3.5. Financials (Based on Availability)
- 16.2.4 Netify
- 16.2.4.1. Overview
- 16.2.4.2. Products
- 16.2.4.3. SWOT Analysis
- 16.2.4.4. Recent Developments
- 16.2.4.5. Financials (Based on Availability)
- 16.2.5 SolarWinds Worldwide LLC
- 16.2.5.1. Overview
- 16.2.5.2. Products
- 16.2.5.3. SWOT Analysis
- 16.2.5.4. Recent Developments
- 16.2.5.5. Financials (Based on Availability)
- 16.2.6 Cisco Systems Inc
- 16.2.6.1. Overview
- 16.2.6.2. Products
- 16.2.6.3. SWOT Analysis
- 16.2.6.4. Recent Developments
- 16.2.6.5. Financials (Based on Availability)
- 16.2.7 NetFort Technologies Limited (Rapid
- 16.2.7.1. Overview
- 16.2.7.2. Products
- 16.2.7.3. SWOT Analysis
- 16.2.7.4. Recent Developments
- 16.2.7.5. Financials (Based on Availability)
- 16.2.8 Allot Ltd
- 16.2.8.1. Overview
- 16.2.8.2. Products
- 16.2.8.3. SWOT Analysis
- 16.2.8.4. Recent Developments
- 16.2.8.5. Financials (Based on Availability)
- 16.2.9 ipoque GmbH*List Not Exhaustive
- 16.2.9.1. Overview
- 16.2.9.2. Products
- 16.2.9.3. SWOT Analysis
- 16.2.9.4. Recent Developments
- 16.2.9.5. Financials (Based on Availability)
- 16.2.10 WiseSpot Company Limited
- 16.2.10.1. Overview
- 16.2.10.2. Products
- 16.2.10.3. SWOT Analysis
- 16.2.10.4. Recent Developments
- 16.2.10.5. Financials (Based on Availability)
- 16.2.11 Huawei Technologies Co Ltd
- 16.2.11.1. Overview
- 16.2.11.2. Products
- 16.2.11.3. SWOT Analysis
- 16.2.11.4. Recent Developments
- 16.2.11.5. Financials (Based on Availability)
- 16.2.12 ManageEngine (Zoho Corporation)
- 16.2.12.1. Overview
- 16.2.12.2. Products
- 16.2.12.3. SWOT Analysis
- 16.2.12.4. Recent Developments
- 16.2.12.5. Financials (Based on Availability)
- 16.2.13 AppNeta Inc
- 16.2.13.1. Overview
- 16.2.13.2. Products
- 16.2.13.3. SWOT Analysis
- 16.2.13.4. Recent Developments
- 16.2.13.5. Financials (Based on Availability)
- 16.2.1 Enea AB (Qosmos SA)
List of Figures
- Figure 1: Global Deep Packet Inspection Solutions Industry Revenue Breakdown (Million, %) by Region 2024 & 2032
- Figure 2: North America Deep Packet Inspection Solutions Industry Revenue (Million), by Country 2024 & 2032
- Figure 3: North America Deep Packet Inspection Solutions Industry Revenue Share (%), by Country 2024 & 2032
- Figure 4: Europe Deep Packet Inspection Solutions Industry Revenue (Million), by Country 2024 & 2032
- Figure 5: Europe Deep Packet Inspection Solutions Industry Revenue Share (%), by Country 2024 & 2032
- Figure 6: Asia Pacific Deep Packet Inspection Solutions Industry Revenue (Million), by Country 2024 & 2032
- Figure 7: Asia Pacific Deep Packet Inspection Solutions Industry Revenue Share (%), by Country 2024 & 2032
- Figure 8: Latin America Deep Packet Inspection Solutions Industry Revenue (Million), by Country 2024 & 2032
- Figure 9: Latin America Deep Packet Inspection Solutions Industry Revenue Share (%), by Country 2024 & 2032
- Figure 10: Middle East and Africa Deep Packet Inspection Solutions Industry Revenue (Million), by Country 2024 & 2032
- Figure 11: Middle East and Africa Deep Packet Inspection Solutions Industry Revenue Share (%), by Country 2024 & 2032
- Figure 12: North America Deep Packet Inspection Solutions Industry Revenue (Million), by Solution 2024 & 2032
- Figure 13: North America Deep Packet Inspection Solutions Industry Revenue Share (%), by Solution 2024 & 2032
- Figure 14: North America Deep Packet Inspection Solutions Industry Revenue (Million), by Deployment 2024 & 2032
- Figure 15: North America Deep Packet Inspection Solutions Industry Revenue Share (%), by Deployment 2024 & 2032
- Figure 16: North America Deep Packet Inspection Solutions Industry Revenue (Million), by End-User 2024 & 2032
- Figure 17: North America Deep Packet Inspection Solutions Industry Revenue Share (%), by End-User 2024 & 2032
- Figure 18: North America Deep Packet Inspection Solutions Industry Revenue (Million), by Country 2024 & 2032
- Figure 19: North America Deep Packet Inspection Solutions Industry Revenue Share (%), by Country 2024 & 2032
- Figure 20: Europe Deep Packet Inspection Solutions Industry Revenue (Million), by Solution 2024 & 2032
- Figure 21: Europe Deep Packet Inspection Solutions Industry Revenue Share (%), by Solution 2024 & 2032
- Figure 22: Europe Deep Packet Inspection Solutions Industry Revenue (Million), by Deployment 2024 & 2032
- Figure 23: Europe Deep Packet Inspection Solutions Industry Revenue Share (%), by Deployment 2024 & 2032
- Figure 24: Europe Deep Packet Inspection Solutions Industry Revenue (Million), by End-User 2024 & 2032
- Figure 25: Europe Deep Packet Inspection Solutions Industry Revenue Share (%), by End-User 2024 & 2032
- Figure 26: Europe Deep Packet Inspection Solutions Industry Revenue (Million), by Country 2024 & 2032
- Figure 27: Europe Deep Packet Inspection Solutions Industry Revenue Share (%), by Country 2024 & 2032
- Figure 28: Asia Pacific Deep Packet Inspection Solutions Industry Revenue (Million), by Solution 2024 & 2032
- Figure 29: Asia Pacific Deep Packet Inspection Solutions Industry Revenue Share (%), by Solution 2024 & 2032
- Figure 30: Asia Pacific Deep Packet Inspection Solutions Industry Revenue (Million), by Deployment 2024 & 2032
- Figure 31: Asia Pacific Deep Packet Inspection Solutions Industry Revenue Share (%), by Deployment 2024 & 2032
- Figure 32: Asia Pacific Deep Packet Inspection Solutions Industry Revenue (Million), by End-User 2024 & 2032
- Figure 33: Asia Pacific Deep Packet Inspection Solutions Industry Revenue Share (%), by End-User 2024 & 2032
- Figure 34: Asia Pacific Deep Packet Inspection Solutions Industry Revenue (Million), by Country 2024 & 2032
- Figure 35: Asia Pacific Deep Packet Inspection Solutions Industry Revenue Share (%), by Country 2024 & 2032
- Figure 36: Latin America Deep Packet Inspection Solutions Industry Revenue (Million), by Solution 2024 & 2032
- Figure 37: Latin America Deep Packet Inspection Solutions Industry Revenue Share (%), by Solution 2024 & 2032
- Figure 38: Latin America Deep Packet Inspection Solutions Industry Revenue (Million), by Deployment 2024 & 2032
- Figure 39: Latin America Deep Packet Inspection Solutions Industry Revenue Share (%), by Deployment 2024 & 2032
- Figure 40: Latin America Deep Packet Inspection Solutions Industry Revenue (Million), by End-User 2024 & 2032
- Figure 41: Latin America Deep Packet Inspection Solutions Industry Revenue Share (%), by End-User 2024 & 2032
- Figure 42: Latin America Deep Packet Inspection Solutions Industry Revenue (Million), by Country 2024 & 2032
- Figure 43: Latin America Deep Packet Inspection Solutions Industry Revenue Share (%), by Country 2024 & 2032
- Figure 44: Middle East and Africa Deep Packet Inspection Solutions Industry Revenue (Million), by Solution 2024 & 2032
- Figure 45: Middle East and Africa Deep Packet Inspection Solutions Industry Revenue Share (%), by Solution 2024 & 2032
- Figure 46: Middle East and Africa Deep Packet Inspection Solutions Industry Revenue (Million), by Deployment 2024 & 2032
- Figure 47: Middle East and Africa Deep Packet Inspection Solutions Industry Revenue Share (%), by Deployment 2024 & 2032
- Figure 48: Middle East and Africa Deep Packet Inspection Solutions Industry Revenue (Million), by End-User 2024 & 2032
- Figure 49: Middle East and Africa Deep Packet Inspection Solutions Industry Revenue Share (%), by End-User 2024 & 2032
- Figure 50: Middle East and Africa Deep Packet Inspection Solutions Industry Revenue (Million), by Country 2024 & 2032
- Figure 51: Middle East and Africa Deep Packet Inspection Solutions Industry Revenue Share (%), by Country 2024 & 2032
List of Tables
- Table 1: Global Deep Packet Inspection Solutions Industry Revenue Million Forecast, by Region 2019 & 2032
- Table 2: Global Deep Packet Inspection Solutions Industry Revenue Million Forecast, by Solution 2019 & 2032
- Table 3: Global Deep Packet Inspection Solutions Industry Revenue Million Forecast, by Deployment 2019 & 2032
- Table 4: Global Deep Packet Inspection Solutions Industry Revenue Million Forecast, by End-User 2019 & 2032
- Table 5: Global Deep Packet Inspection Solutions Industry Revenue Million Forecast, by Region 2019 & 2032
- Table 6: Global Deep Packet Inspection Solutions Industry Revenue Million Forecast, by Country 2019 & 2032
- Table 7: United States Deep Packet Inspection Solutions Industry Revenue (Million) Forecast, by Application 2019 & 2032
- Table 8: Canada Deep Packet Inspection Solutions Industry Revenue (Million) Forecast, by Application 2019 & 2032
- Table 9: Global Deep Packet Inspection Solutions Industry Revenue Million Forecast, by Country 2019 & 2032
- Table 10: Germany Deep Packet Inspection Solutions Industry Revenue (Million) Forecast, by Application 2019 & 2032
- Table 11: United Kingdom Deep Packet Inspection Solutions Industry Revenue (Million) Forecast, by Application 2019 & 2032
- Table 12: France Deep Packet Inspection Solutions Industry Revenue (Million) Forecast, by Application 2019 & 2032
- Table 13: Rest of Europe Deep Packet Inspection Solutions Industry Revenue (Million) Forecast, by Application 2019 & 2032
- Table 14: Global Deep Packet Inspection Solutions Industry Revenue Million Forecast, by Country 2019 & 2032
- Table 15: China Deep Packet Inspection Solutions Industry Revenue (Million) Forecast, by Application 2019 & 2032
- Table 16: Japan Deep Packet Inspection Solutions Industry Revenue (Million) Forecast, by Application 2019 & 2032
- Table 17: Australia Deep Packet Inspection Solutions Industry Revenue (Million) Forecast, by Application 2019 & 2032
- Table 18: Rest of Asia Pacific Deep Packet Inspection Solutions Industry Revenue (Million) Forecast, by Application 2019 & 2032
- Table 19: Global Deep Packet Inspection Solutions Industry Revenue Million Forecast, by Country 2019 & 2032
- Table 20: Deep Packet Inspection Solutions Industry Revenue (Million) Forecast, by Application 2019 & 2032
- Table 21: Global Deep Packet Inspection Solutions Industry Revenue Million Forecast, by Country 2019 & 2032
- Table 22: Deep Packet Inspection Solutions Industry Revenue (Million) Forecast, by Application 2019 & 2032
- Table 23: Global Deep Packet Inspection Solutions Industry Revenue Million Forecast, by Solution 2019 & 2032
- Table 24: Global Deep Packet Inspection Solutions Industry Revenue Million Forecast, by Deployment 2019 & 2032
- Table 25: Global Deep Packet Inspection Solutions Industry Revenue Million Forecast, by End-User 2019 & 2032
- Table 26: Global Deep Packet Inspection Solutions Industry Revenue Million Forecast, by Country 2019 & 2032
- Table 27: United States Deep Packet Inspection Solutions Industry Revenue (Million) Forecast, by Application 2019 & 2032
- Table 28: Canada Deep Packet Inspection Solutions Industry Revenue (Million) Forecast, by Application 2019 & 2032
- Table 29: Global Deep Packet Inspection Solutions Industry Revenue Million Forecast, by Solution 2019 & 2032
- Table 30: Global Deep Packet Inspection Solutions Industry Revenue Million Forecast, by Deployment 2019 & 2032
- Table 31: Global Deep Packet Inspection Solutions Industry Revenue Million Forecast, by End-User 2019 & 2032
- Table 32: Global Deep Packet Inspection Solutions Industry Revenue Million Forecast, by Country 2019 & 2032
- Table 33: Germany Deep Packet Inspection Solutions Industry Revenue (Million) Forecast, by Application 2019 & 2032
- Table 34: United Kingdom Deep Packet Inspection Solutions Industry Revenue (Million) Forecast, by Application 2019 & 2032
- Table 35: France Deep Packet Inspection Solutions Industry Revenue (Million) Forecast, by Application 2019 & 2032
- Table 36: Rest of Europe Deep Packet Inspection Solutions Industry Revenue (Million) Forecast, by Application 2019 & 2032
- Table 37: Global Deep Packet Inspection Solutions Industry Revenue Million Forecast, by Solution 2019 & 2032
- Table 38: Global Deep Packet Inspection Solutions Industry Revenue Million Forecast, by Deployment 2019 & 2032
- Table 39: Global Deep Packet Inspection Solutions Industry Revenue Million Forecast, by End-User 2019 & 2032
- Table 40: Global Deep Packet Inspection Solutions Industry Revenue Million Forecast, by Country 2019 & 2032
- Table 41: China Deep Packet Inspection Solutions Industry Revenue (Million) Forecast, by Application 2019 & 2032
- Table 42: Japan Deep Packet Inspection Solutions Industry Revenue (Million) Forecast, by Application 2019 & 2032
- Table 43: Australia Deep Packet Inspection Solutions Industry Revenue (Million) Forecast, by Application 2019 & 2032
- Table 44: Rest of Asia Pacific Deep Packet Inspection Solutions Industry Revenue (Million) Forecast, by Application 2019 & 2032
- Table 45: Global Deep Packet Inspection Solutions Industry Revenue Million Forecast, by Solution 2019 & 2032
- Table 46: Global Deep Packet Inspection Solutions Industry Revenue Million Forecast, by Deployment 2019 & 2032
- Table 47: Global Deep Packet Inspection Solutions Industry Revenue Million Forecast, by End-User 2019 & 2032
- Table 48: Global Deep Packet Inspection Solutions Industry Revenue Million Forecast, by Country 2019 & 2032
- Table 49: Global Deep Packet Inspection Solutions Industry Revenue Million Forecast, by Solution 2019 & 2032
- Table 50: Global Deep Packet Inspection Solutions Industry Revenue Million Forecast, by Deployment 2019 & 2032
- Table 51: Global Deep Packet Inspection Solutions Industry Revenue Million Forecast, by End-User 2019 & 2032
- Table 52: Global Deep Packet Inspection Solutions Industry Revenue Million Forecast, by Country 2019 & 2032
Frequently Asked Questions
1. What is the projected Compound Annual Growth Rate (CAGR) of the Deep Packet Inspection Solutions Industry?
The projected CAGR is approximately 20.32%.
2. Which companies are prominent players in the Deep Packet Inspection Solutions Industry?
Key companies in the market include Enea AB (Qosmos SA), Nokia Corporation (Alcatel Lucent), Bivio Networks Inc, Netify, SolarWinds Worldwide LLC, Cisco Systems Inc, NetFort Technologies Limited (Rapid, Allot Ltd, ipoque GmbH*List Not Exhaustive, WiseSpot Company Limited, Huawei Technologies Co Ltd, ManageEngine (Zoho Corporation), AppNeta Inc.
3. What are the main segments of the Deep Packet Inspection Solutions Industry?
The market segments include Solution, Deployment, End-User.
4. Can you provide details about the market size?
The market size is estimated to be USD 28.17 Million as of 2022.
5. What are some drivers contributing to market growth?
Increasing Adoption of Regulatory and Data Protection Laws; High Adoption of Cloud Based Security Technologies.
6. What are the notable trends driving market growth?
Software Solution to Witness Significant Growth With Increasing Enterprise Internet Traffic.
7. Are there any restraints impacting market growth?
DPI Adds to the Complexity and Unwieldy Nature of Existing Firewalls and Other Security-Related Software.
8. Can you provide examples of recent developments in the market?
February 2024 - ipoque, a Rohde & Schwarz company leading provider of next-gen deep packet inspection (DPI) software, will demonstrate its revolutionary DPI and encrypted traffic intelligence (ETI) solutions at MWC Barcelona 2024.
9. What pricing options are available for accessing the report?
Pricing options include single-user, multi-user, and enterprise licenses priced at USD 4750, USD 5250, and USD 8750 respectively.
10. Is the market size provided in terms of value or volume?
The market size is provided in terms of value, measured in Million.
11. Are there any specific market keywords associated with the report?
Yes, the market keyword associated with the report is "Deep Packet Inspection Solutions Industry," which aids in identifying and referencing the specific market segment covered.
12. How do I determine which pricing option suits my needs best?
The pricing options vary based on user requirements and access needs. Individual users may opt for single-user licenses, while businesses requiring broader access may choose multi-user or enterprise licenses for cost-effective access to the report.
13. Are there any additional resources or data provided in the Deep Packet Inspection Solutions Industry report?
While the report offers comprehensive insights, it's advisable to review the specific contents or supplementary materials provided to ascertain if additional resources or data are available.
14. How can I stay updated on further developments or reports in the Deep Packet Inspection Solutions Industry?
To stay informed about further developments, trends, and reports in the Deep Packet Inspection Solutions Industry, consider subscribing to industry newsletters, following relevant companies and organizations, or regularly checking reputable industry news sources and publications.
Methodology
Step 1 - Identification of Relevant Samples Size from Population Database


Step 2 - Approaches for Defining Global Market Size (Value, Volume* & Price*)

Note*: In applicable scenarios
Step 3 - Data Sources
Primary Research
- Web Analytics
- Survey Reports
- Research Institute
- Latest Research Reports
- Opinion Leaders
Secondary Research
- Annual Reports
- White Paper
- Latest Press Release
- Industry Association
- Paid Database
- Investor Presentations

Step 4 - Data Triangulation
Involves using different sources of information in order to increase the validity of a study
These sources are likely to be stakeholders in a program - participants, other researchers, program staff, other community members, and so on.
Then we put all data in single framework & apply various statistical tools to find out the dynamic on the market.
During the analysis stage, feedback from the stakeholder groups would be compared to determine areas of agreement as well as areas of divergence


