
Key Insights
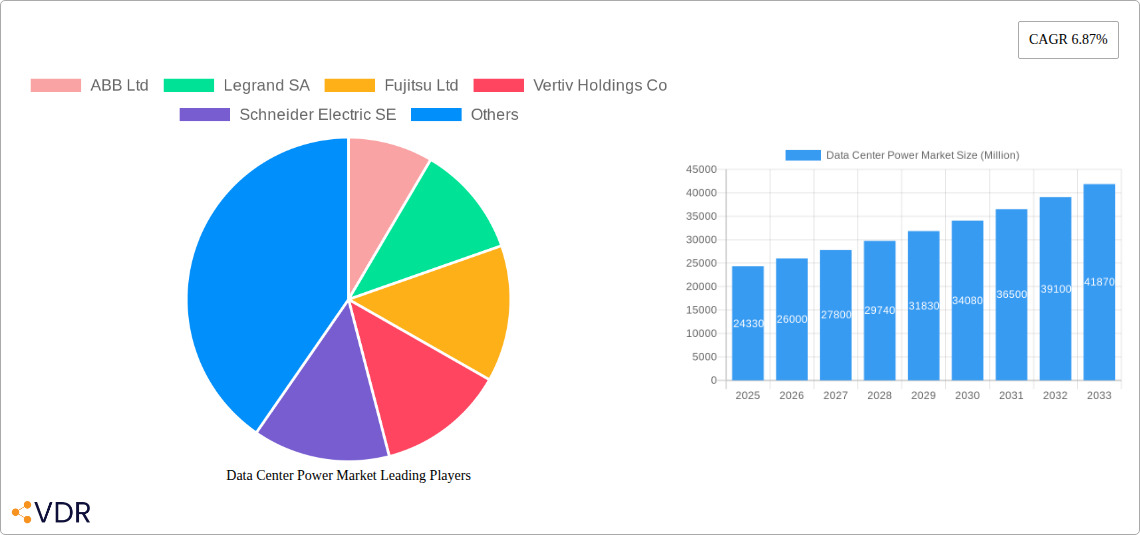
The Data Center Power market, valued at $24.33 billion in 2025, is projected to experience robust growth, driven by the escalating demand for data centers globally. This surge is fueled by the rapid expansion of cloud computing, big data analytics, and the Internet of Things (IoT), all of which necessitate substantial power infrastructure. The market is segmented by type (solutions and services), end-user application (information technology, manufacturing, BFSI, government, telecom, and others), and data center size (small and medium, and large). The increasing adoption of energy-efficient power solutions, such as UPS systems and power distribution units (PDUs), alongside a rising focus on sustainability within the data center industry, are key growth drivers. Geographic expansion, particularly in rapidly developing economies in Asia-Pacific, is expected to contribute significantly to market expansion. However, challenges remain, including the high initial investment costs associated with data center power infrastructure and the increasing complexity of managing power distribution in large-scale facilities. Competitive landscape analysis reveals key players like ABB Ltd, Legrand SA, and Schneider Electric SE vying for market share through technological innovation and strategic partnerships.
The projected Compound Annual Growth Rate (CAGR) of 6.87% from 2025 to 2033 indicates a substantial increase in market value over the forecast period. This growth is expected to be relatively consistent across different segments and regions, although specific growth rates may vary due to regional economic conditions and infrastructure development. The market's evolution will be significantly influenced by advancements in power management technologies, including artificial intelligence (AI)-powered predictive maintenance and the integration of renewable energy sources to enhance sustainability and reduce operational costs. Furthermore, government initiatives promoting digital infrastructure development will play a crucial role in shaping the future of the Data Center Power market.
Data Center Power Market: A Comprehensive Market Report (2019-2033)
This comprehensive report provides an in-depth analysis of the Data Center Power Market, encompassing market dynamics, growth trends, regional dominance, product landscape, key players, and future outlook. The study period spans from 2019 to 2033, with 2025 as the base and estimated year. This report is crucial for industry professionals, investors, and strategists seeking to navigate this rapidly evolving market. The report analyzes the parent market of Data Center Infrastructure and the child market of Data Center Power solutions.
Data Center Power Market Dynamics & Structure
The Data Center Power market is characterized by a moderately concentrated landscape, with key players such as Schneider Electric SE, Vertiv Holdings Co, and ABB Ltd holding significant market share. The market size in 2024 was estimated at $XX Million. Technological innovation, particularly in areas like energy efficiency and renewable energy integration, is a major driver. Stringent regulatory frameworks related to energy consumption and carbon emissions are shaping market trends. The market also faces competition from alternative power solutions, and the rise of edge computing is influencing demand patterns. M&A activity has been relatively consistent, with approximately XX deals recorded in the past five years, averaging a value of $XX Million per deal.
- Market Concentration: Moderately concentrated, with top 5 players holding approximately XX% market share in 2024.
- Technological Innovation: Focus on energy efficiency, renewable integration, and AI-powered management systems.
- Regulatory Landscape: Stringent regulations on energy consumption and sustainability are driving innovation.
- Competitive Substitutes: Alternative power sources and energy storage solutions pose competitive pressure.
- End-User Demographics: Growth driven by increased data consumption across diverse sectors.
- M&A Activity: XX deals in the last 5 years, with an average deal value of $XX Million.
Data Center Power Market Growth Trends & Insights
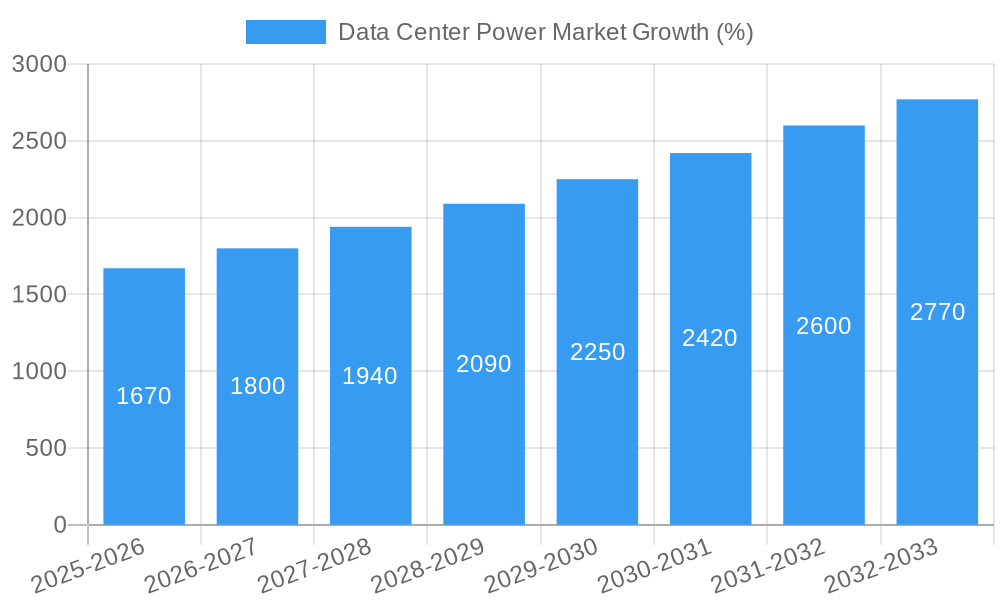
The Data Center Power market witnessed robust growth during the historical period (2019-2024), with a CAGR of XX%. This growth is attributed to the expanding digital economy, the proliferation of data centers, and increasing demand for reliable and efficient power solutions. The market is expected to maintain a strong growth trajectory during the forecast period (2025-2033), with a projected CAGR of XX%, reaching a market size of $XX Million by 2033. This growth is fueled by the increasing adoption of cloud computing, the rise of big data analytics, and the growing need for high-performance computing across various industries. Technological disruptions, such as the adoption of AI-driven power management systems and the integration of renewable energy sources, are further driving market expansion. Consumer behavior shifts toward environmentally conscious solutions are also influencing market dynamics. Market penetration in key regions like North America and Europe is expected to increase to approximately XX% by 2033.
Dominant Regions, Countries, or Segments in Data Center Power Market
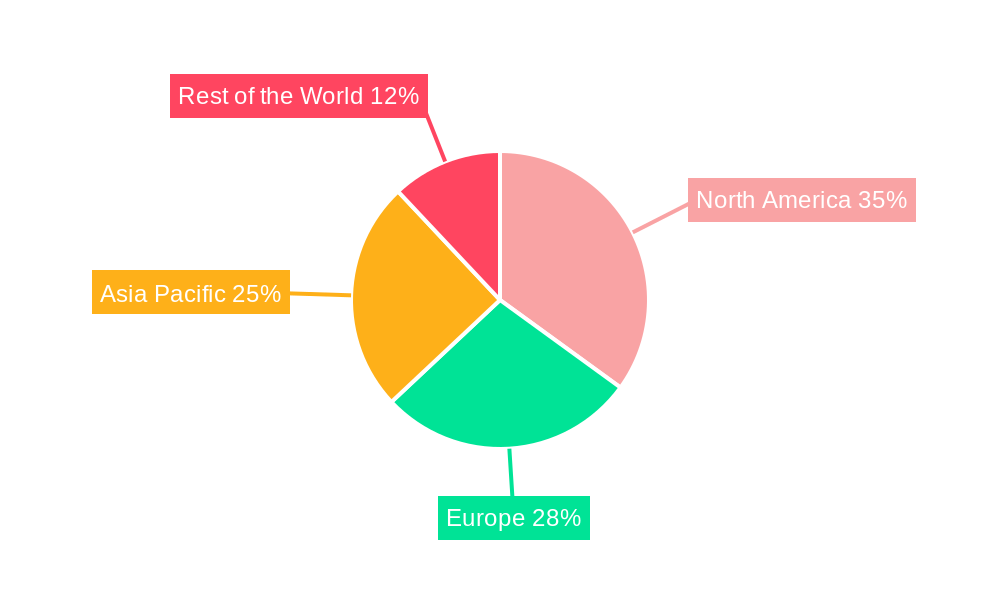
North America currently dominates the Data Center Power market, driven by high IT infrastructure investments and strong adoption of advanced technologies. Europe and Asia-Pacific are also significant markets with robust growth potential.
By Type: The Solutions segment holds the largest market share, followed by Services. The Services segment is projected to witness the highest CAGR due to increased demand for managed services and maintenance contracts.
By End-user Application: The Information Technology sector accounts for the largest share, followed by BFSI and Manufacturing. Government and Telecom sectors are also significant contributors, exhibiting substantial growth potential.
By Data Center Size: The Large Data Center segment dominates the market, driven by high power requirements. However, the Small and Medium Data Center segment is experiencing faster growth due to the proliferation of edge data centers.
- North America: High IT infrastructure investments and strong adoption of advanced technologies.
- Europe: Growing demand for data centers and focus on energy-efficient solutions.
- Asia-Pacific: Rapid economic growth and increasing digitalization driving market expansion.
- Solutions Segment: High market share due to demand for advanced power management systems.
- Services Segment: Highest CAGR due to increasing demand for managed services.
- Information Technology: Largest market share, driven by cloud computing and big data analytics.
Data Center Power Market Product Landscape
The Data Center Power market offers a diverse range of products, including uninterruptible power supplies (UPS), power distribution units (PDU), power monitoring systems, and energy management solutions. Recent innovations focus on improving energy efficiency, enhancing reliability, and providing greater scalability. Products are increasingly incorporating AI and machine learning capabilities for predictive maintenance and optimized energy consumption. Unique selling propositions include improved modularity, remote monitoring capabilities, and integration with renewable energy sources.
Key Drivers, Barriers & Challenges in Data Center Power Market
Key Drivers:
- Increasing demand for data center capacity driven by digital transformation.
- Growing adoption of cloud computing and big data analytics.
- Focus on improving energy efficiency and reducing carbon footprint.
- Advancements in power management technologies.
Key Challenges:
- High initial investment costs for advanced power solutions.
- Complexity in integrating renewable energy sources into data centers.
- Supply chain disruptions impacting the availability of key components.
- Regulatory hurdles and compliance requirements. The cost of compliance is estimated to increase by XX% by 2030, impacting profitability.
Emerging Opportunities in Data Center Power Market
- Growth of edge computing and the need for localized power solutions.
- Increasing demand for energy-efficient and sustainable power systems.
- Opportunities in developing markets with expanding data center infrastructure.
- Adoption of innovative financing models to reduce upfront investment costs.
Growth Accelerators in the Data Center Power Market Industry
Technological breakthroughs, such as the development of more efficient power conversion technologies and the integration of renewable energy sources, are key drivers of long-term growth. Strategic partnerships between technology providers and data center operators are also fostering market expansion. Furthermore, government initiatives promoting digital infrastructure development and supporting the adoption of sustainable technologies are further accelerating growth.
Key Players Shaping the Data Center Power Market Market
- ABB Ltd
- Legrand SA
- Fujitsu Ltd
- Vertiv Holdings Co
- Schneider Electric SE
- Rittal GmbH & Co KG
- Schleifenbauer Products BV
- Cisco Technology Inc
- Black Box Corporatio
- PDU Experts UK Ltd
- Eaton Corporation
Notable Milestones in Data Center Power Market Sector
- November 2023: Vertiv launched Vertiv SmartMod Max CW, a prefabricated modular data center supporting up to 200kW IT load. This significantly impacts the small-scale data center market.
- October 2023: ABB introduced the ABB TruFit power distribution unit, addressing the need for faster data center project timelines with high configurability and safety features. This directly responds to industry demands for faster deployments.
In-Depth Data Center Power Market Market Outlook
The Data Center Power market is poised for sustained growth, driven by continued digital transformation and the increasing demand for reliable and efficient power solutions. Strategic partnerships, technological advancements, and government support will play crucial roles in shaping future market dynamics. Opportunities exist in developing markets and specialized segments like edge computing. The market's long-term potential is significant, presenting substantial opportunities for established players and new entrants alike.
Data Center Power Market Segmentation
-
1. Type
-
1.1. Solutions
- 1.1.1. Power Distribution Unit
- 1.1.2. UPS
- 1.1.3. Busway
- 1.1.4. Other Solutions
-
1.2. Services
- 1.2.1. Consulting
- 1.2.2. System Integration
- 1.2.3. Professional Services
-
1.1. Solutions
-
2. End-user Application
- 2.1. Information Technology
- 2.2. Manufacturing
- 2.3. BFSI
- 2.4. Government
- 2.5. Telecom
- 2.6. Other End-user Applications
-
3. Data Center Size
- 3.1. Small and Medium
- 3.2. Large
Data Center Power Market Segmentation By Geography
- 1. North America
- 2. Europe
- 3. Asia
- 4. Australia and New Zealand
- 5. Latin America
- 6. Middle East and Africa
Data Center Power Market REPORT HIGHLIGHTS
| Aspects | Details |
|---|---|
| Study Period | 2019-2033 |
| Base Year | 2024 |
| Estimated Year | 2025 |
| Forecast Period | 2025-2033 |
| Historical Period | 2019-2024 |
| Growth Rate | CAGR of 6.87% from 2019-2033 |
| Segmentation |
|
Table of Contents
- 1. Introduction
- 1.1. Research Scope
- 1.2. Market Segmentation
- 1.3. Research Methodology
- 1.4. Definitions and Assumptions
- 2. Executive Summary
- 2.1. Introduction
- 3. Market Dynamics
- 3.1. Introduction
- 3.2. Market Drivers
- 3.2.1. Rising Adoption of Mega Data Centers and Cloud Computing; Increasing Demand to Reduce Operational Costs
- 3.3. Market Restrains
- 3.3.1. High Cost of Installation and Maintenance
- 3.4. Market Trends
- 3.4.1. UPS to be the Fastest Growing Solution Type
- 4. Market Factor Analysis
- 4.1. Porters Five Forces
- 4.2. Supply/Value Chain
- 4.3. PESTEL analysis
- 4.4. Market Entropy
- 4.5. Patent/Trademark Analysis
- 5. Global Data Center Power Market Analysis, Insights and Forecast, 2019-2031
- 5.1. Market Analysis, Insights and Forecast - by Type
- 5.1.1. Solutions
- 5.1.1.1. Power Distribution Unit
- 5.1.1.2. UPS
- 5.1.1.3. Busway
- 5.1.1.4. Other Solutions
- 5.1.2. Services
- 5.1.2.1. Consulting
- 5.1.2.2. System Integration
- 5.1.2.3. Professional Services
- 5.1.1. Solutions
- 5.2. Market Analysis, Insights and Forecast - by End-user Application
- 5.2.1. Information Technology
- 5.2.2. Manufacturing
- 5.2.3. BFSI
- 5.2.4. Government
- 5.2.5. Telecom
- 5.2.6. Other End-user Applications
- 5.3. Market Analysis, Insights and Forecast - by Data Center Size
- 5.3.1. Small and Medium
- 5.3.2. Large
- 5.4. Market Analysis, Insights and Forecast - by Region
- 5.4.1. North America
- 5.4.2. Europe
- 5.4.3. Asia
- 5.4.4. Australia and New Zealand
- 5.4.5. Latin America
- 5.4.6. Middle East and Africa
- 5.1. Market Analysis, Insights and Forecast - by Type
- 6. North America Data Center Power Market Analysis, Insights and Forecast, 2019-2031
- 6.1. Market Analysis, Insights and Forecast - by Type
- 6.1.1. Solutions
- 6.1.1.1. Power Distribution Unit
- 6.1.1.2. UPS
- 6.1.1.3. Busway
- 6.1.1.4. Other Solutions
- 6.1.2. Services
- 6.1.2.1. Consulting
- 6.1.2.2. System Integration
- 6.1.2.3. Professional Services
- 6.1.1. Solutions
- 6.2. Market Analysis, Insights and Forecast - by End-user Application
- 6.2.1. Information Technology
- 6.2.2. Manufacturing
- 6.2.3. BFSI
- 6.2.4. Government
- 6.2.5. Telecom
- 6.2.6. Other End-user Applications
- 6.3. Market Analysis, Insights and Forecast - by Data Center Size
- 6.3.1. Small and Medium
- 6.3.2. Large
- 6.1. Market Analysis, Insights and Forecast - by Type
- 7. Europe Data Center Power Market Analysis, Insights and Forecast, 2019-2031
- 7.1. Market Analysis, Insights and Forecast - by Type
- 7.1.1. Solutions
- 7.1.1.1. Power Distribution Unit
- 7.1.1.2. UPS
- 7.1.1.3. Busway
- 7.1.1.4. Other Solutions
- 7.1.2. Services
- 7.1.2.1. Consulting
- 7.1.2.2. System Integration
- 7.1.2.3. Professional Services
- 7.1.1. Solutions
- 7.2. Market Analysis, Insights and Forecast - by End-user Application
- 7.2.1. Information Technology
- 7.2.2. Manufacturing
- 7.2.3. BFSI
- 7.2.4. Government
- 7.2.5. Telecom
- 7.2.6. Other End-user Applications
- 7.3. Market Analysis, Insights and Forecast - by Data Center Size
- 7.3.1. Small and Medium
- 7.3.2. Large
- 7.1. Market Analysis, Insights and Forecast - by Type
- 8. Asia Data Center Power Market Analysis, Insights and Forecast, 2019-2031
- 8.1. Market Analysis, Insights and Forecast - by Type
- 8.1.1. Solutions
- 8.1.1.1. Power Distribution Unit
- 8.1.1.2. UPS
- 8.1.1.3. Busway
- 8.1.1.4. Other Solutions
- 8.1.2. Services
- 8.1.2.1. Consulting
- 8.1.2.2. System Integration
- 8.1.2.3. Professional Services
- 8.1.1. Solutions
- 8.2. Market Analysis, Insights and Forecast - by End-user Application
- 8.2.1. Information Technology
- 8.2.2. Manufacturing
- 8.2.3. BFSI
- 8.2.4. Government
- 8.2.5. Telecom
- 8.2.6. Other End-user Applications
- 8.3. Market Analysis, Insights and Forecast - by Data Center Size
- 8.3.1. Small and Medium
- 8.3.2. Large
- 8.1. Market Analysis, Insights and Forecast - by Type
- 9. Australia and New Zealand Data Center Power Market Analysis, Insights and Forecast, 2019-2031
- 9.1. Market Analysis, Insights and Forecast - by Type
- 9.1.1. Solutions
- 9.1.1.1. Power Distribution Unit
- 9.1.1.2. UPS
- 9.1.1.3. Busway
- 9.1.1.4. Other Solutions
- 9.1.2. Services
- 9.1.2.1. Consulting
- 9.1.2.2. System Integration
- 9.1.2.3. Professional Services
- 9.1.1. Solutions
- 9.2. Market Analysis, Insights and Forecast - by End-user Application
- 9.2.1. Information Technology
- 9.2.2. Manufacturing
- 9.2.3. BFSI
- 9.2.4. Government
- 9.2.5. Telecom
- 9.2.6. Other End-user Applications
- 9.3. Market Analysis, Insights and Forecast - by Data Center Size
- 9.3.1. Small and Medium
- 9.3.2. Large
- 9.1. Market Analysis, Insights and Forecast - by Type
- 10. Latin America Data Center Power Market Analysis, Insights and Forecast, 2019-2031
- 10.1. Market Analysis, Insights and Forecast - by Type
- 10.1.1. Solutions
- 10.1.1.1. Power Distribution Unit
- 10.1.1.2. UPS
- 10.1.1.3. Busway
- 10.1.1.4. Other Solutions
- 10.1.2. Services
- 10.1.2.1. Consulting
- 10.1.2.2. System Integration
- 10.1.2.3. Professional Services
- 10.1.1. Solutions
- 10.2. Market Analysis, Insights and Forecast - by End-user Application
- 10.2.1. Information Technology
- 10.2.2. Manufacturing
- 10.2.3. BFSI
- 10.2.4. Government
- 10.2.5. Telecom
- 10.2.6. Other End-user Applications
- 10.3. Market Analysis, Insights and Forecast - by Data Center Size
- 10.3.1. Small and Medium
- 10.3.2. Large
- 10.1. Market Analysis, Insights and Forecast - by Type
- 11. Middle East and Africa Data Center Power Market Analysis, Insights and Forecast, 2019-2031
- 11.1. Market Analysis, Insights and Forecast - by Type
- 11.1.1. Solutions
- 11.1.1.1. Power Distribution Unit
- 11.1.1.2. UPS
- 11.1.1.3. Busway
- 11.1.1.4. Other Solutions
- 11.1.2. Services
- 11.1.2.1. Consulting
- 11.1.2.2. System Integration
- 11.1.2.3. Professional Services
- 11.1.1. Solutions
- 11.2. Market Analysis, Insights and Forecast - by End-user Application
- 11.2.1. Information Technology
- 11.2.2. Manufacturing
- 11.2.3. BFSI
- 11.2.4. Government
- 11.2.5. Telecom
- 11.2.6. Other End-user Applications
- 11.3. Market Analysis, Insights and Forecast - by Data Center Size
- 11.3.1. Small and Medium
- 11.3.2. Large
- 11.1. Market Analysis, Insights and Forecast - by Type
- 12. North America Data Center Power Market Analysis, Insights and Forecast, 2019-2031
- 12.1. Market Analysis, Insights and Forecast - By Country/Sub-region
- 12.1.1.
- 13. Europe Data Center Power Market Analysis, Insights and Forecast, 2019-2031
- 13.1. Market Analysis, Insights and Forecast - By Country/Sub-region
- 13.1.1.
- 14. Asia Pacific Data Center Power Market Analysis, Insights and Forecast, 2019-2031
- 14.1. Market Analysis, Insights and Forecast - By Country/Sub-region
- 14.1.1.
- 15. Rest of the World Data Center Power Market Analysis, Insights and Forecast, 2019-2031
- 15.1. Market Analysis, Insights and Forecast - By Country/Sub-region
- 15.1.1.
- 16. Competitive Analysis
- 16.1. Global Market Share Analysis 2024
- 16.2. Company Profiles
- 16.2.1 ABB Ltd
- 16.2.1.1. Overview
- 16.2.1.2. Products
- 16.2.1.3. SWOT Analysis
- 16.2.1.4. Recent Developments
- 16.2.1.5. Financials (Based on Availability)
- 16.2.2 Legrand SA
- 16.2.2.1. Overview
- 16.2.2.2. Products
- 16.2.2.3. SWOT Analysis
- 16.2.2.4. Recent Developments
- 16.2.2.5. Financials (Based on Availability)
- 16.2.3 Fujitsu Ltd
- 16.2.3.1. Overview
- 16.2.3.2. Products
- 16.2.3.3. SWOT Analysis
- 16.2.3.4. Recent Developments
- 16.2.3.5. Financials (Based on Availability)
- 16.2.4 Vertiv Holdings Co
- 16.2.4.1. Overview
- 16.2.4.2. Products
- 16.2.4.3. SWOT Analysis
- 16.2.4.4. Recent Developments
- 16.2.4.5. Financials (Based on Availability)
- 16.2.5 Schneider Electric SE
- 16.2.5.1. Overview
- 16.2.5.2. Products
- 16.2.5.3. SWOT Analysis
- 16.2.5.4. Recent Developments
- 16.2.5.5. Financials (Based on Availability)
- 16.2.6 Rittal GmbH & Co KG
- 16.2.6.1. Overview
- 16.2.6.2. Products
- 16.2.6.3. SWOT Analysis
- 16.2.6.4. Recent Developments
- 16.2.6.5. Financials (Based on Availability)
- 16.2.7 Schleifenbauer Products BV
- 16.2.7.1. Overview
- 16.2.7.2. Products
- 16.2.7.3. SWOT Analysis
- 16.2.7.4. Recent Developments
- 16.2.7.5. Financials (Based on Availability)
- 16.2.8 Cisco Technology Inc
- 16.2.8.1. Overview
- 16.2.8.2. Products
- 16.2.8.3. SWOT Analysis
- 16.2.8.4. Recent Developments
- 16.2.8.5. Financials (Based on Availability)
- 16.2.9 Black Box Corporatio
- 16.2.9.1. Overview
- 16.2.9.2. Products
- 16.2.9.3. SWOT Analysis
- 16.2.9.4. Recent Developments
- 16.2.9.5. Financials (Based on Availability)
- 16.2.10 PDU Experts UK Ltd
- 16.2.10.1. Overview
- 16.2.10.2. Products
- 16.2.10.3. SWOT Analysis
- 16.2.10.4. Recent Developments
- 16.2.10.5. Financials (Based on Availability)
- 16.2.11 Eaton Corporation
- 16.2.11.1. Overview
- 16.2.11.2. Products
- 16.2.11.3. SWOT Analysis
- 16.2.11.4. Recent Developments
- 16.2.11.5. Financials (Based on Availability)
- 16.2.1 ABB Ltd
List of Figures
- Figure 1: Global Data Center Power Market Revenue Breakdown (Million, %) by Region 2024 & 2032
- Figure 2: North America Data Center Power Market Revenue (Million), by Country 2024 & 2032
- Figure 3: North America Data Center Power Market Revenue Share (%), by Country 2024 & 2032
- Figure 4: Europe Data Center Power Market Revenue (Million), by Country 2024 & 2032
- Figure 5: Europe Data Center Power Market Revenue Share (%), by Country 2024 & 2032
- Figure 6: Asia Pacific Data Center Power Market Revenue (Million), by Country 2024 & 2032
- Figure 7: Asia Pacific Data Center Power Market Revenue Share (%), by Country 2024 & 2032
- Figure 8: Rest of the World Data Center Power Market Revenue (Million), by Country 2024 & 2032
- Figure 9: Rest of the World Data Center Power Market Revenue Share (%), by Country 2024 & 2032
- Figure 10: North America Data Center Power Market Revenue (Million), by Type 2024 & 2032
- Figure 11: North America Data Center Power Market Revenue Share (%), by Type 2024 & 2032
- Figure 12: North America Data Center Power Market Revenue (Million), by End-user Application 2024 & 2032
- Figure 13: North America Data Center Power Market Revenue Share (%), by End-user Application 2024 & 2032
- Figure 14: North America Data Center Power Market Revenue (Million), by Data Center Size 2024 & 2032
- Figure 15: North America Data Center Power Market Revenue Share (%), by Data Center Size 2024 & 2032
- Figure 16: North America Data Center Power Market Revenue (Million), by Country 2024 & 2032
- Figure 17: North America Data Center Power Market Revenue Share (%), by Country 2024 & 2032
- Figure 18: Europe Data Center Power Market Revenue (Million), by Type 2024 & 2032
- Figure 19: Europe Data Center Power Market Revenue Share (%), by Type 2024 & 2032
- Figure 20: Europe Data Center Power Market Revenue (Million), by End-user Application 2024 & 2032
- Figure 21: Europe Data Center Power Market Revenue Share (%), by End-user Application 2024 & 2032
- Figure 22: Europe Data Center Power Market Revenue (Million), by Data Center Size 2024 & 2032
- Figure 23: Europe Data Center Power Market Revenue Share (%), by Data Center Size 2024 & 2032
- Figure 24: Europe Data Center Power Market Revenue (Million), by Country 2024 & 2032
- Figure 25: Europe Data Center Power Market Revenue Share (%), by Country 2024 & 2032
- Figure 26: Asia Data Center Power Market Revenue (Million), by Type 2024 & 2032
- Figure 27: Asia Data Center Power Market Revenue Share (%), by Type 2024 & 2032
- Figure 28: Asia Data Center Power Market Revenue (Million), by End-user Application 2024 & 2032
- Figure 29: Asia Data Center Power Market Revenue Share (%), by End-user Application 2024 & 2032
- Figure 30: Asia Data Center Power Market Revenue (Million), by Data Center Size 2024 & 2032
- Figure 31: Asia Data Center Power Market Revenue Share (%), by Data Center Size 2024 & 2032
- Figure 32: Asia Data Center Power Market Revenue (Million), by Country 2024 & 2032
- Figure 33: Asia Data Center Power Market Revenue Share (%), by Country 2024 & 2032
- Figure 34: Australia and New Zealand Data Center Power Market Revenue (Million), by Type 2024 & 2032
- Figure 35: Australia and New Zealand Data Center Power Market Revenue Share (%), by Type 2024 & 2032
- Figure 36: Australia and New Zealand Data Center Power Market Revenue (Million), by End-user Application 2024 & 2032
- Figure 37: Australia and New Zealand Data Center Power Market Revenue Share (%), by End-user Application 2024 & 2032
- Figure 38: Australia and New Zealand Data Center Power Market Revenue (Million), by Data Center Size 2024 & 2032
- Figure 39: Australia and New Zealand Data Center Power Market Revenue Share (%), by Data Center Size 2024 & 2032
- Figure 40: Australia and New Zealand Data Center Power Market Revenue (Million), by Country 2024 & 2032
- Figure 41: Australia and New Zealand Data Center Power Market Revenue Share (%), by Country 2024 & 2032
- Figure 42: Latin America Data Center Power Market Revenue (Million), by Type 2024 & 2032
- Figure 43: Latin America Data Center Power Market Revenue Share (%), by Type 2024 & 2032
- Figure 44: Latin America Data Center Power Market Revenue (Million), by End-user Application 2024 & 2032
- Figure 45: Latin America Data Center Power Market Revenue Share (%), by End-user Application 2024 & 2032
- Figure 46: Latin America Data Center Power Market Revenue (Million), by Data Center Size 2024 & 2032
- Figure 47: Latin America Data Center Power Market Revenue Share (%), by Data Center Size 2024 & 2032
- Figure 48: Latin America Data Center Power Market Revenue (Million), by Country 2024 & 2032
- Figure 49: Latin America Data Center Power Market Revenue Share (%), by Country 2024 & 2032
- Figure 50: Middle East and Africa Data Center Power Market Revenue (Million), by Type 2024 & 2032
- Figure 51: Middle East and Africa Data Center Power Market Revenue Share (%), by Type 2024 & 2032
- Figure 52: Middle East and Africa Data Center Power Market Revenue (Million), by End-user Application 2024 & 2032
- Figure 53: Middle East and Africa Data Center Power Market Revenue Share (%), by End-user Application 2024 & 2032
- Figure 54: Middle East and Africa Data Center Power Market Revenue (Million), by Data Center Size 2024 & 2032
- Figure 55: Middle East and Africa Data Center Power Market Revenue Share (%), by Data Center Size 2024 & 2032
- Figure 56: Middle East and Africa Data Center Power Market Revenue (Million), by Country 2024 & 2032
- Figure 57: Middle East and Africa Data Center Power Market Revenue Share (%), by Country 2024 & 2032
List of Tables
- Table 1: Global Data Center Power Market Revenue Million Forecast, by Region 2019 & 2032
- Table 2: Global Data Center Power Market Revenue Million Forecast, by Type 2019 & 2032
- Table 3: Global Data Center Power Market Revenue Million Forecast, by End-user Application 2019 & 2032
- Table 4: Global Data Center Power Market Revenue Million Forecast, by Data Center Size 2019 & 2032
- Table 5: Global Data Center Power Market Revenue Million Forecast, by Region 2019 & 2032
- Table 6: Global Data Center Power Market Revenue Million Forecast, by Country 2019 & 2032
- Table 7: Data Center Power Market Revenue (Million) Forecast, by Application 2019 & 2032
- Table 8: Global Data Center Power Market Revenue Million Forecast, by Country 2019 & 2032
- Table 9: Data Center Power Market Revenue (Million) Forecast, by Application 2019 & 2032
- Table 10: Global Data Center Power Market Revenue Million Forecast, by Country 2019 & 2032
- Table 11: Data Center Power Market Revenue (Million) Forecast, by Application 2019 & 2032
- Table 12: Global Data Center Power Market Revenue Million Forecast, by Country 2019 & 2032
- Table 13: Data Center Power Market Revenue (Million) Forecast, by Application 2019 & 2032
- Table 14: Global Data Center Power Market Revenue Million Forecast, by Type 2019 & 2032
- Table 15: Global Data Center Power Market Revenue Million Forecast, by End-user Application 2019 & 2032
- Table 16: Global Data Center Power Market Revenue Million Forecast, by Data Center Size 2019 & 2032
- Table 17: Global Data Center Power Market Revenue Million Forecast, by Country 2019 & 2032
- Table 18: Global Data Center Power Market Revenue Million Forecast, by Type 2019 & 2032
- Table 19: Global Data Center Power Market Revenue Million Forecast, by End-user Application 2019 & 2032
- Table 20: Global Data Center Power Market Revenue Million Forecast, by Data Center Size 2019 & 2032
- Table 21: Global Data Center Power Market Revenue Million Forecast, by Country 2019 & 2032
- Table 22: Global Data Center Power Market Revenue Million Forecast, by Type 2019 & 2032
- Table 23: Global Data Center Power Market Revenue Million Forecast, by End-user Application 2019 & 2032
- Table 24: Global Data Center Power Market Revenue Million Forecast, by Data Center Size 2019 & 2032
- Table 25: Global Data Center Power Market Revenue Million Forecast, by Country 2019 & 2032
- Table 26: Global Data Center Power Market Revenue Million Forecast, by Type 2019 & 2032
- Table 27: Global Data Center Power Market Revenue Million Forecast, by End-user Application 2019 & 2032
- Table 28: Global Data Center Power Market Revenue Million Forecast, by Data Center Size 2019 & 2032
- Table 29: Global Data Center Power Market Revenue Million Forecast, by Country 2019 & 2032
- Table 30: Global Data Center Power Market Revenue Million Forecast, by Type 2019 & 2032
- Table 31: Global Data Center Power Market Revenue Million Forecast, by End-user Application 2019 & 2032
- Table 32: Global Data Center Power Market Revenue Million Forecast, by Data Center Size 2019 & 2032
- Table 33: Global Data Center Power Market Revenue Million Forecast, by Country 2019 & 2032
- Table 34: Global Data Center Power Market Revenue Million Forecast, by Type 2019 & 2032
- Table 35: Global Data Center Power Market Revenue Million Forecast, by End-user Application 2019 & 2032
- Table 36: Global Data Center Power Market Revenue Million Forecast, by Data Center Size 2019 & 2032
- Table 37: Global Data Center Power Market Revenue Million Forecast, by Country 2019 & 2032
Frequently Asked Questions
1. What is the projected Compound Annual Growth Rate (CAGR) of the Data Center Power Market?
The projected CAGR is approximately 6.87%.
2. Which companies are prominent players in the Data Center Power Market?
Key companies in the market include ABB Ltd, Legrand SA, Fujitsu Ltd, Vertiv Holdings Co, Schneider Electric SE, Rittal GmbH & Co KG, Schleifenbauer Products BV, Cisco Technology Inc, Black Box Corporatio, PDU Experts UK Ltd, Eaton Corporation.
3. What are the main segments of the Data Center Power Market?
The market segments include Type, End-user Application, Data Center Size.
4. Can you provide details about the market size?
The market size is estimated to be USD 24.33 Million as of 2022.
5. What are some drivers contributing to market growth?
Rising Adoption of Mega Data Centers and Cloud Computing; Increasing Demand to Reduce Operational Costs.
6. What are the notable trends driving market growth?
UPS to be the Fastest Growing Solution Type.
7. Are there any restraints impacting market growth?
High Cost of Installation and Maintenance.
8. Can you provide examples of recent developments in the market?
November 2023: Vertiv introduced Vertiv SmartMod Max CW, a prefabricated modular data center designed to address the increasing demand. The solution supports up to 200kW of total IT load in a single system. It presents a range of customization options, including power capacities, number of racks and rack sizes, and module dimensions. Vertiv SmartMod Max CW incorporates Vertiv Liebert EXM uninterruptible power supply (UPS) system in 100 kW, 150 kW, and 200 kW power ratings and thermal management units with intelligent controls, enabling small-scale operations, like edge data centers, to meet their specific requirements.
9. What pricing options are available for accessing the report?
Pricing options include single-user, multi-user, and enterprise licenses priced at USD 4750, USD 5250, and USD 8750 respectively.
10. Is the market size provided in terms of value or volume?
The market size is provided in terms of value, measured in Million.
11. Are there any specific market keywords associated with the report?
Yes, the market keyword associated with the report is "Data Center Power Market," which aids in identifying and referencing the specific market segment covered.
12. How do I determine which pricing option suits my needs best?
The pricing options vary based on user requirements and access needs. Individual users may opt for single-user licenses, while businesses requiring broader access may choose multi-user or enterprise licenses for cost-effective access to the report.
13. Are there any additional resources or data provided in the Data Center Power Market report?
While the report offers comprehensive insights, it's advisable to review the specific contents or supplementary materials provided to ascertain if additional resources or data are available.
14. How can I stay updated on further developments or reports in the Data Center Power Market?
To stay informed about further developments, trends, and reports in the Data Center Power Market, consider subscribing to industry newsletters, following relevant companies and organizations, or regularly checking reputable industry news sources and publications.
Methodology
Step 1 - Identification of Relevant Samples Size from Population Database


Step 2 - Approaches for Defining Global Market Size (Value, Volume* & Price*)

Note*: In applicable scenarios
Step 3 - Data Sources
Primary Research
- Web Analytics
- Survey Reports
- Research Institute
- Latest Research Reports
- Opinion Leaders
Secondary Research
- Annual Reports
- White Paper
- Latest Press Release
- Industry Association
- Paid Database
- Investor Presentations

Step 4 - Data Triangulation
Involves using different sources of information in order to increase the validity of a study
These sources are likely to be stakeholders in a program - participants, other researchers, program staff, other community members, and so on.
Then we put all data in single framework & apply various statistical tools to find out the dynamic on the market.
During the analysis stage, feedback from the stakeholder groups would be compared to determine areas of agreement as well as areas of divergence


