
Key Insights
The cooling tower rental market is experiencing robust growth, driven by increasing demand across commercial and industrial sectors. The market's expansion is fueled by several key factors. Firstly, the rising adoption of temporary cooling solutions for peak demand periods and emergency situations reduces upfront capital expenditure for businesses, making rental a more attractive option. Secondly, the increasing prevalence of data centers and industrial processes requiring precise temperature control is contributing significantly to market growth. Furthermore, the convenience and flexibility offered by rental services, including quick deployment and easy maintenance, are major advantages over purchasing and maintaining cooling towers. The market is segmented by cooling tower type (wet, dry, hybrid) and end-user (commercial, industrial), with the commercial sector currently dominating due to the high concentration of HVAC applications in offices and retail spaces. However, the industrial sector is projected to experience faster growth due to expanding manufacturing and process industries. Geographical growth is expected to be diverse, with North America and Europe maintaining significant market share due to established infrastructure and high industrial activity. Asia-Pacific is anticipated to show substantial growth, driven by rapid industrialization and infrastructure development in emerging economies. Competition within the market is relatively high, with both large multinational corporations and smaller specialized rental companies vying for market share. The competitive landscape is characterized by factors such as service quality, rental pricing, and geographic reach.
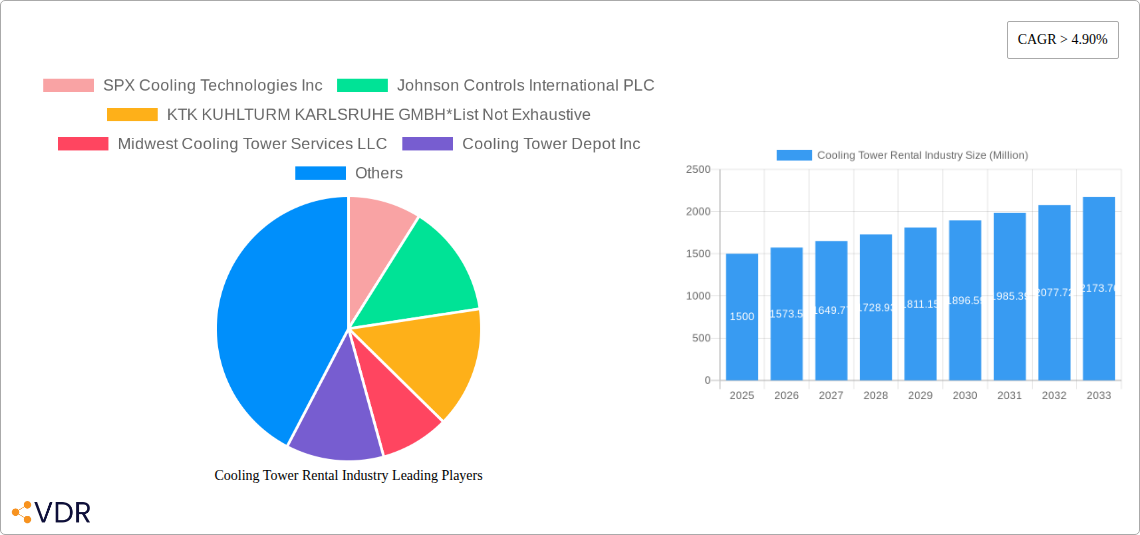
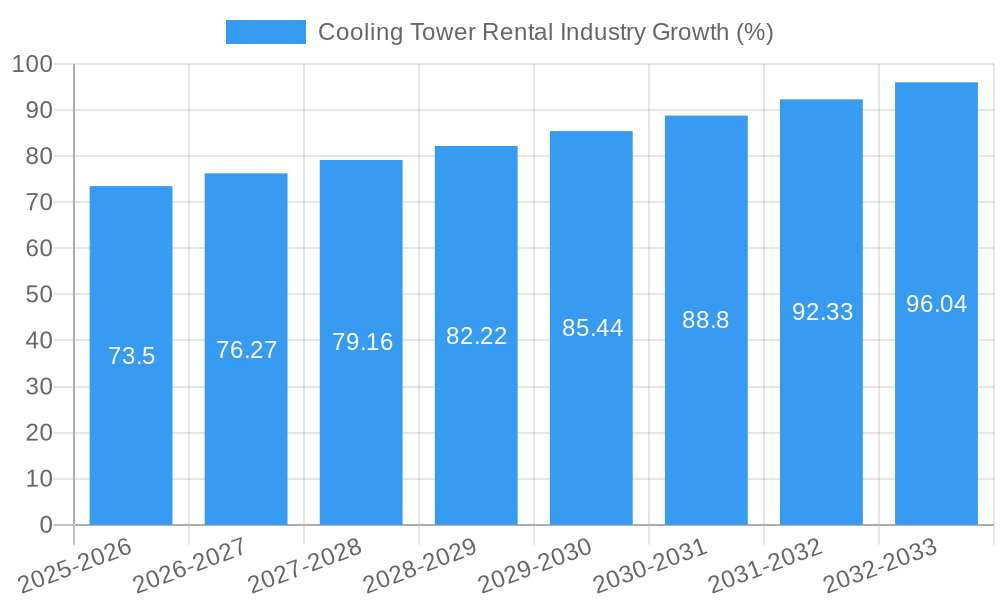
The projected Compound Annual Growth Rate (CAGR) of 4.90% indicates a steady and substantial expansion of the cooling tower rental market over the forecast period (2025-2033). This growth is expected to be further accelerated by technological advancements in cooling tower design and efficiency, increasing environmental concerns leading to adoption of more sustainable cooling solutions, and the growing need for reliable and temporary cooling infrastructure in disaster relief and emergency situations. While potential restraints such as initial rental costs and fluctuating energy prices might impact market growth, the overall positive trend in industrial and commercial development, coupled with the inherent advantages of rental solutions, is poised to drive considerable market expansion over the coming years. The market's segmentation into wet, dry, and hybrid cooling towers allows for diverse applications based on specific needs and climatic conditions.
This comprehensive report provides an in-depth analysis of the Cooling Tower Rental market, encompassing market dynamics, growth trends, regional segmentation, product landscape, key players, and future outlook. The report covers the period from 2019 to 2033, with a focus on the forecast period of 2025-2033 and a base year of 2025. The analysis considers various segments, including wet, dry, and hybrid cooling towers, across commercial and industrial end-user sectors.
Cooling Tower Rental Industry Market Dynamics & Structure
This section analyzes the competitive landscape, technological advancements, regulatory influences, and market trends within the cooling tower rental industry. The market is characterized by a mix of large multinational corporations and specialized rental service providers. Market concentration is moderate, with a few major players holding significant market share, but with ample room for smaller, regional players.
- Market Concentration: Moderate, with the top 5 players holding approximately xx% of the market share in 2024.
- Technological Innovation: Focus on energy efficiency, automation, and remote monitoring technologies. Barriers to innovation include high upfront investment costs and the need for specialized expertise.
- Regulatory Framework: Environmental regulations (e.g., water usage, emissions) significantly impact the industry, driving adoption of more efficient cooling tower designs.
- Competitive Substitutes: Air-cooled systems and other cooling technologies pose some competitive pressure.
- End-User Demographics: Significant demand from the industrial sector (e.g., power generation, refining, manufacturing), followed by the commercial sector (e.g., data centers, HVAC).
- M&A Trends: Consolidation is expected to continue, with larger players acquiring smaller regional companies to expand their geographic reach and service portfolio. An estimated xx M&A deals were recorded in the historical period (2019-2024).
Cooling Tower Rental Industry Growth Trends & Insights
The Cooling Tower Rental market experienced significant growth in the historical period (2019-2024), driven by increasing industrial activity and the demand for reliable cooling solutions. However, the COVID-19 pandemic temporarily dampened growth in 2020, impacting refinery operations and reducing demand for cooling tower rentals. The market is projected to recover and continue its growth trajectory in the forecast period (2025-2033). This growth is fueled by technological advancements, increasing industrialization, and rising demand for efficient cooling solutions. The market size is projected to reach xx million units by 2033, with a CAGR of xx% during the forecast period.
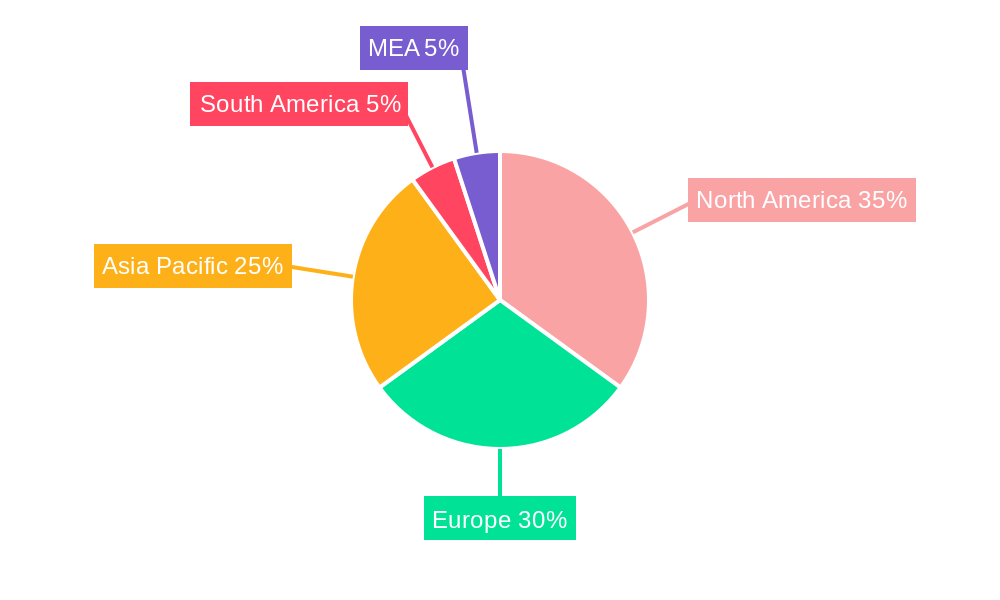
Dominant Regions, Countries, or Segments in Cooling Tower Rental Industry
North America and Europe currently dominate the cooling tower rental market, driven by established industrial bases and robust infrastructure. However, Asia-Pacific is anticipated to exhibit the highest growth rate during the forecast period due to rapid industrialization and increasing energy demand.
- Type: The wet cooling tower segment holds the largest market share due to its cost-effectiveness and widespread adoption. However, the hybrid segment is projected to experience faster growth driven by the need for water conservation.
- End-User: The industrial segment is the key driver, accounting for xx% of the market in 2024. Growth in this segment is linked to ongoing investments in manufacturing and power generation.
- Key Drivers: Increasing industrialization, urbanization, and government initiatives promoting energy efficiency. Strong economic growth in emerging economies significantly boosts demand.
Cooling Tower Rental Industry Product Landscape
Cooling tower rental offerings are becoming increasingly sophisticated, integrating advanced features such as intelligent controls, remote monitoring capabilities, and improved energy efficiency. Technological advancements, such as the use of advanced materials and improved designs, are continuously enhancing the performance and longevity of rental units. Unique selling propositions often focus on customized solutions, rapid deployment, and comprehensive maintenance packages.
Key Drivers, Barriers & Challenges in Cooling Tower Rental Industry
Key Drivers: Rising demand for reliable cooling solutions across diverse industries, increasing energy efficiency requirements, and the expansion of data centers are key drivers. Technological advancements lead to improved performance and reduced operational costs.
Key Challenges: Stringent environmental regulations, the need for skilled labor, and intense competition are key hurdles. Supply chain disruptions (e.g., material shortages) can impact availability and pricing. The COVID-19 pandemic demonstrated the vulnerability of the industry to external shocks. Estimated losses during 2020 were around xx million units.
Emerging Opportunities in Cooling Tower Rental Industry
Emerging opportunities exist in expanding into underserved markets (e.g., developing economies), focusing on sustainable cooling solutions (e.g., water-efficient designs), and providing integrated cooling management services. The increasing adoption of smart technologies presents further growth potential through the development of advanced monitoring and control systems.
Growth Accelerators in the Cooling Tower Rental Industry Industry
Long-term growth will be driven by technological innovation, strategic partnerships (e.g., collaborations between rental companies and technology providers), and expansion into new geographic markets. Government initiatives promoting energy efficiency and sustainable development will also play a crucial role.
Key Players Shaping the Cooling Tower Rental Industry Market
- SPX Cooling Technologies Inc
- Johnson Controls International PLC
- KTK KUHLTURM KARLSRUHE GMBH
- Midwest Cooling Tower Services LLC
- Cooling Tower Depot Inc
- Caterpillar Inc
- Aggreko PLC
- Baltimore Aircoil Co
- Carrier Rental Systems Inc
- United Rentals Inc
Notable Milestones in Cooling Tower Rental Industry Sector
- 2020 (Q2): Significant decline in demand due to COVID-19 lockdowns and reduced industrial activity.
- 2021 (Q3): Market recovery begins as economies reopen and industrial activity resumes.
- 2022 (Q4): Several key players announce investments in new technologies and expansion plans.
- 2023 (Ongoing): Increased focus on sustainable and energy-efficient cooling solutions.
In-Depth Cooling Tower Rental Industry Market Outlook
The Cooling Tower Rental market is poised for robust growth in the coming years, driven by several key factors. Continued industrial expansion, particularly in developing economies, will create significant demand for reliable cooling solutions. The increasing focus on sustainability and energy efficiency will drive adoption of advanced technologies and innovative designs. This presents considerable opportunities for companies that can effectively leverage technological advancements and adapt to the changing regulatory landscape. The market is expected to witness significant consolidation and expansion, creating attractive opportunities for investors and strategic players.
Cooling Tower Rental Industry Segmentation
-
1. Type
- 1.1. Wet
- 1.2. Dry
- 1.3. Hybrid
-
2. End User
- 2.1. Commercial
- 2.2. Industrial
Cooling Tower Rental Industry Segmentation By Geography
- 1. North America
- 2. Europe
- 3. Asia Pacific
- 4. Middle East and Africa
- 5. South America
Cooling Tower Rental Industry REPORT HIGHLIGHTS
| Aspects | Details |
|---|---|
| Study Period | 2019-2033 |
| Base Year | 2024 |
| Estimated Year | 2025 |
| Forecast Period | 2025-2033 |
| Historical Period | 2019-2024 |
| Growth Rate | CAGR of > 4.90% from 2019-2033 |
| Segmentation |
|
Table of Contents
- 1. Introduction
- 1.1. Research Scope
- 1.2. Market Segmentation
- 1.3. Research Methodology
- 1.4. Definitions and Assumptions
- 2. Executive Summary
- 2.1. Introduction
- 3. Market Dynamics
- 3.1. Introduction
- 3.2. Market Drivers
- 3.2.1. 4.; Favorable Government Policies
- 3.3. Market Restrains
- 3.3.1. 4.; Rising Emphasis on Other Alternative Clean Energy Sources
- 3.4. Market Trends
- 3.4.1. Industrial Segment to Dominate the Market
- 4. Market Factor Analysis
- 4.1. Porters Five Forces
- 4.2. Supply/Value Chain
- 4.3. PESTEL analysis
- 4.4. Market Entropy
- 4.5. Patent/Trademark Analysis
- 5. Global Cooling Tower Rental Industry Analysis, Insights and Forecast, 2019-2031
- 5.1. Market Analysis, Insights and Forecast - by Type
- 5.1.1. Wet
- 5.1.2. Dry
- 5.1.3. Hybrid
- 5.2. Market Analysis, Insights and Forecast - by End User
- 5.2.1. Commercial
- 5.2.2. Industrial
- 5.3. Market Analysis, Insights and Forecast - by Region
- 5.3.1. North America
- 5.3.2. Europe
- 5.3.3. Asia Pacific
- 5.3.4. Middle East and Africa
- 5.3.5. South America
- 5.1. Market Analysis, Insights and Forecast - by Type
- 6. North America Cooling Tower Rental Industry Analysis, Insights and Forecast, 2019-2031
- 6.1. Market Analysis, Insights and Forecast - by Type
- 6.1.1. Wet
- 6.1.2. Dry
- 6.1.3. Hybrid
- 6.2. Market Analysis, Insights and Forecast - by End User
- 6.2.1. Commercial
- 6.2.2. Industrial
- 6.1. Market Analysis, Insights and Forecast - by Type
- 7. Europe Cooling Tower Rental Industry Analysis, Insights and Forecast, 2019-2031
- 7.1. Market Analysis, Insights and Forecast - by Type
- 7.1.1. Wet
- 7.1.2. Dry
- 7.1.3. Hybrid
- 7.2. Market Analysis, Insights and Forecast - by End User
- 7.2.1. Commercial
- 7.2.2. Industrial
- 7.1. Market Analysis, Insights and Forecast - by Type
- 8. Asia Pacific Cooling Tower Rental Industry Analysis, Insights and Forecast, 2019-2031
- 8.1. Market Analysis, Insights and Forecast - by Type
- 8.1.1. Wet
- 8.1.2. Dry
- 8.1.3. Hybrid
- 8.2. Market Analysis, Insights and Forecast - by End User
- 8.2.1. Commercial
- 8.2.2. Industrial
- 8.1. Market Analysis, Insights and Forecast - by Type
- 9. Middle East and Africa Cooling Tower Rental Industry Analysis, Insights and Forecast, 2019-2031
- 9.1. Market Analysis, Insights and Forecast - by Type
- 9.1.1. Wet
- 9.1.2. Dry
- 9.1.3. Hybrid
- 9.2. Market Analysis, Insights and Forecast - by End User
- 9.2.1. Commercial
- 9.2.2. Industrial
- 9.1. Market Analysis, Insights and Forecast - by Type
- 10. South America Cooling Tower Rental Industry Analysis, Insights and Forecast, 2019-2031
- 10.1. Market Analysis, Insights and Forecast - by Type
- 10.1.1. Wet
- 10.1.2. Dry
- 10.1.3. Hybrid
- 10.2. Market Analysis, Insights and Forecast - by End User
- 10.2.1. Commercial
- 10.2.2. Industrial
- 10.1. Market Analysis, Insights and Forecast - by Type
- 11. North America Cooling Tower Rental Industry Analysis, Insights and Forecast, 2019-2031
- 11.1. Market Analysis, Insights and Forecast - By Country/Sub-region
- 11.1.1 United States
- 11.1.2 Canada
- 11.1.3 Mexico
- 12. Europe Cooling Tower Rental Industry Analysis, Insights and Forecast, 2019-2031
- 12.1. Market Analysis, Insights and Forecast - By Country/Sub-region
- 12.1.1 Germany
- 12.1.2 United Kingdom
- 12.1.3 France
- 12.1.4 Spain
- 12.1.5 Italy
- 12.1.6 Spain
- 12.1.7 Belgium
- 12.1.8 Netherland
- 12.1.9 Nordics
- 12.1.10 Rest of Europe
- 13. Asia Pacific Cooling Tower Rental Industry Analysis, Insights and Forecast, 2019-2031
- 13.1. Market Analysis, Insights and Forecast - By Country/Sub-region
- 13.1.1 China
- 13.1.2 Japan
- 13.1.3 India
- 13.1.4 South Korea
- 13.1.5 Southeast Asia
- 13.1.6 Australia
- 13.1.7 Indonesia
- 13.1.8 Phillipes
- 13.1.9 Singapore
- 13.1.10 Thailandc
- 13.1.11 Rest of Asia Pacific
- 14. South America Cooling Tower Rental Industry Analysis, Insights and Forecast, 2019-2031
- 14.1. Market Analysis, Insights and Forecast - By Country/Sub-region
- 14.1.1 Brazil
- 14.1.2 Argentina
- 14.1.3 Peru
- 14.1.4 Chile
- 14.1.5 Colombia
- 14.1.6 Ecuador
- 14.1.7 Venezuela
- 14.1.8 Rest of South America
- 15. North America Cooling Tower Rental Industry Analysis, Insights and Forecast, 2019-2031
- 15.1. Market Analysis, Insights and Forecast - By Country/Sub-region
- 15.1.1 United States
- 15.1.2 Canada
- 15.1.3 Mexico
- 16. MEA Cooling Tower Rental Industry Analysis, Insights and Forecast, 2019-2031
- 16.1. Market Analysis, Insights and Forecast - By Country/Sub-region
- 16.1.1 United Arab Emirates
- 16.1.2 Saudi Arabia
- 16.1.3 South Africa
- 16.1.4 Rest of Middle East and Africa
- 17. Competitive Analysis
- 17.1. Global Market Share Analysis 2024
- 17.2. Company Profiles
- 17.2.1 SPX Cooling Technologies Inc
- 17.2.1.1. Overview
- 17.2.1.2. Products
- 17.2.1.3. SWOT Analysis
- 17.2.1.4. Recent Developments
- 17.2.1.5. Financials (Based on Availability)
- 17.2.2 Johnson Controls International PLC
- 17.2.2.1. Overview
- 17.2.2.2. Products
- 17.2.2.3. SWOT Analysis
- 17.2.2.4. Recent Developments
- 17.2.2.5. Financials (Based on Availability)
- 17.2.3 KTK KUHLTURM KARLSRUHE GMBH*List Not Exhaustive
- 17.2.3.1. Overview
- 17.2.3.2. Products
- 17.2.3.3. SWOT Analysis
- 17.2.3.4. Recent Developments
- 17.2.3.5. Financials (Based on Availability)
- 17.2.4 Midwest Cooling Tower Services LLC
- 17.2.4.1. Overview
- 17.2.4.2. Products
- 17.2.4.3. SWOT Analysis
- 17.2.4.4. Recent Developments
- 17.2.4.5. Financials (Based on Availability)
- 17.2.5 Cooling Tower Depot Inc
- 17.2.5.1. Overview
- 17.2.5.2. Products
- 17.2.5.3. SWOT Analysis
- 17.2.5.4. Recent Developments
- 17.2.5.5. Financials (Based on Availability)
- 17.2.6 Caterpillar Inc
- 17.2.6.1. Overview
- 17.2.6.2. Products
- 17.2.6.3. SWOT Analysis
- 17.2.6.4. Recent Developments
- 17.2.6.5. Financials (Based on Availability)
- 17.2.7 Aggreko PLC
- 17.2.7.1. Overview
- 17.2.7.2. Products
- 17.2.7.3. SWOT Analysis
- 17.2.7.4. Recent Developments
- 17.2.7.5. Financials (Based on Availability)
- 17.2.8 Baltimore Aircoil Co
- 17.2.8.1. Overview
- 17.2.8.2. Products
- 17.2.8.3. SWOT Analysis
- 17.2.8.4. Recent Developments
- 17.2.8.5. Financials (Based on Availability)
- 17.2.9 Carrier Rental Systems Inc
- 17.2.9.1. Overview
- 17.2.9.2. Products
- 17.2.9.3. SWOT Analysis
- 17.2.9.4. Recent Developments
- 17.2.9.5. Financials (Based on Availability)
- 17.2.10 United Rentals Inc
- 17.2.10.1. Overview
- 17.2.10.2. Products
- 17.2.10.3. SWOT Analysis
- 17.2.10.4. Recent Developments
- 17.2.10.5. Financials (Based on Availability)
- 17.2.1 SPX Cooling Technologies Inc
List of Figures
- Figure 1: Global Cooling Tower Rental Industry Revenue Breakdown (Million, %) by Region 2024 & 2032
- Figure 2: North America Cooling Tower Rental Industry Revenue (Million), by Country 2024 & 2032
- Figure 3: North America Cooling Tower Rental Industry Revenue Share (%), by Country 2024 & 2032
- Figure 4: Europe Cooling Tower Rental Industry Revenue (Million), by Country 2024 & 2032
- Figure 5: Europe Cooling Tower Rental Industry Revenue Share (%), by Country 2024 & 2032
- Figure 6: Asia Pacific Cooling Tower Rental Industry Revenue (Million), by Country 2024 & 2032
- Figure 7: Asia Pacific Cooling Tower Rental Industry Revenue Share (%), by Country 2024 & 2032
- Figure 8: South America Cooling Tower Rental Industry Revenue (Million), by Country 2024 & 2032
- Figure 9: South America Cooling Tower Rental Industry Revenue Share (%), by Country 2024 & 2032
- Figure 10: North America Cooling Tower Rental Industry Revenue (Million), by Country 2024 & 2032
- Figure 11: North America Cooling Tower Rental Industry Revenue Share (%), by Country 2024 & 2032
- Figure 12: MEA Cooling Tower Rental Industry Revenue (Million), by Country 2024 & 2032
- Figure 13: MEA Cooling Tower Rental Industry Revenue Share (%), by Country 2024 & 2032
- Figure 14: North America Cooling Tower Rental Industry Revenue (Million), by Type 2024 & 2032
- Figure 15: North America Cooling Tower Rental Industry Revenue Share (%), by Type 2024 & 2032
- Figure 16: North America Cooling Tower Rental Industry Revenue (Million), by End User 2024 & 2032
- Figure 17: North America Cooling Tower Rental Industry Revenue Share (%), by End User 2024 & 2032
- Figure 18: North America Cooling Tower Rental Industry Revenue (Million), by Country 2024 & 2032
- Figure 19: North America Cooling Tower Rental Industry Revenue Share (%), by Country 2024 & 2032
- Figure 20: Europe Cooling Tower Rental Industry Revenue (Million), by Type 2024 & 2032
- Figure 21: Europe Cooling Tower Rental Industry Revenue Share (%), by Type 2024 & 2032
- Figure 22: Europe Cooling Tower Rental Industry Revenue (Million), by End User 2024 & 2032
- Figure 23: Europe Cooling Tower Rental Industry Revenue Share (%), by End User 2024 & 2032
- Figure 24: Europe Cooling Tower Rental Industry Revenue (Million), by Country 2024 & 2032
- Figure 25: Europe Cooling Tower Rental Industry Revenue Share (%), by Country 2024 & 2032
- Figure 26: Asia Pacific Cooling Tower Rental Industry Revenue (Million), by Type 2024 & 2032
- Figure 27: Asia Pacific Cooling Tower Rental Industry Revenue Share (%), by Type 2024 & 2032
- Figure 28: Asia Pacific Cooling Tower Rental Industry Revenue (Million), by End User 2024 & 2032
- Figure 29: Asia Pacific Cooling Tower Rental Industry Revenue Share (%), by End User 2024 & 2032
- Figure 30: Asia Pacific Cooling Tower Rental Industry Revenue (Million), by Country 2024 & 2032
- Figure 31: Asia Pacific Cooling Tower Rental Industry Revenue Share (%), by Country 2024 & 2032
- Figure 32: Middle East and Africa Cooling Tower Rental Industry Revenue (Million), by Type 2024 & 2032
- Figure 33: Middle East and Africa Cooling Tower Rental Industry Revenue Share (%), by Type 2024 & 2032
- Figure 34: Middle East and Africa Cooling Tower Rental Industry Revenue (Million), by End User 2024 & 2032
- Figure 35: Middle East and Africa Cooling Tower Rental Industry Revenue Share (%), by End User 2024 & 2032
- Figure 36: Middle East and Africa Cooling Tower Rental Industry Revenue (Million), by Country 2024 & 2032
- Figure 37: Middle East and Africa Cooling Tower Rental Industry Revenue Share (%), by Country 2024 & 2032
- Figure 38: South America Cooling Tower Rental Industry Revenue (Million), by Type 2024 & 2032
- Figure 39: South America Cooling Tower Rental Industry Revenue Share (%), by Type 2024 & 2032
- Figure 40: South America Cooling Tower Rental Industry Revenue (Million), by End User 2024 & 2032
- Figure 41: South America Cooling Tower Rental Industry Revenue Share (%), by End User 2024 & 2032
- Figure 42: South America Cooling Tower Rental Industry Revenue (Million), by Country 2024 & 2032
- Figure 43: South America Cooling Tower Rental Industry Revenue Share (%), by Country 2024 & 2032
List of Tables
- Table 1: Global Cooling Tower Rental Industry Revenue Million Forecast, by Region 2019 & 2032
- Table 2: Global Cooling Tower Rental Industry Revenue Million Forecast, by Type 2019 & 2032
- Table 3: Global Cooling Tower Rental Industry Revenue Million Forecast, by End User 2019 & 2032
- Table 4: Global Cooling Tower Rental Industry Revenue Million Forecast, by Region 2019 & 2032
- Table 5: Global Cooling Tower Rental Industry Revenue Million Forecast, by Country 2019 & 2032
- Table 6: United States Cooling Tower Rental Industry Revenue (Million) Forecast, by Application 2019 & 2032
- Table 7: Canada Cooling Tower Rental Industry Revenue (Million) Forecast, by Application 2019 & 2032
- Table 8: Mexico Cooling Tower Rental Industry Revenue (Million) Forecast, by Application 2019 & 2032
- Table 9: Global Cooling Tower Rental Industry Revenue Million Forecast, by Country 2019 & 2032
- Table 10: Germany Cooling Tower Rental Industry Revenue (Million) Forecast, by Application 2019 & 2032
- Table 11: United Kingdom Cooling Tower Rental Industry Revenue (Million) Forecast, by Application 2019 & 2032
- Table 12: France Cooling Tower Rental Industry Revenue (Million) Forecast, by Application 2019 & 2032
- Table 13: Spain Cooling Tower Rental Industry Revenue (Million) Forecast, by Application 2019 & 2032
- Table 14: Italy Cooling Tower Rental Industry Revenue (Million) Forecast, by Application 2019 & 2032
- Table 15: Spain Cooling Tower Rental Industry Revenue (Million) Forecast, by Application 2019 & 2032
- Table 16: Belgium Cooling Tower Rental Industry Revenue (Million) Forecast, by Application 2019 & 2032
- Table 17: Netherland Cooling Tower Rental Industry Revenue (Million) Forecast, by Application 2019 & 2032
- Table 18: Nordics Cooling Tower Rental Industry Revenue (Million) Forecast, by Application 2019 & 2032
- Table 19: Rest of Europe Cooling Tower Rental Industry Revenue (Million) Forecast, by Application 2019 & 2032
- Table 20: Global Cooling Tower Rental Industry Revenue Million Forecast, by Country 2019 & 2032
- Table 21: China Cooling Tower Rental Industry Revenue (Million) Forecast, by Application 2019 & 2032
- Table 22: Japan Cooling Tower Rental Industry Revenue (Million) Forecast, by Application 2019 & 2032
- Table 23: India Cooling Tower Rental Industry Revenue (Million) Forecast, by Application 2019 & 2032
- Table 24: South Korea Cooling Tower Rental Industry Revenue (Million) Forecast, by Application 2019 & 2032
- Table 25: Southeast Asia Cooling Tower Rental Industry Revenue (Million) Forecast, by Application 2019 & 2032
- Table 26: Australia Cooling Tower Rental Industry Revenue (Million) Forecast, by Application 2019 & 2032
- Table 27: Indonesia Cooling Tower Rental Industry Revenue (Million) Forecast, by Application 2019 & 2032
- Table 28: Phillipes Cooling Tower Rental Industry Revenue (Million) Forecast, by Application 2019 & 2032
- Table 29: Singapore Cooling Tower Rental Industry Revenue (Million) Forecast, by Application 2019 & 2032
- Table 30: Thailandc Cooling Tower Rental Industry Revenue (Million) Forecast, by Application 2019 & 2032
- Table 31: Rest of Asia Pacific Cooling Tower Rental Industry Revenue (Million) Forecast, by Application 2019 & 2032
- Table 32: Global Cooling Tower Rental Industry Revenue Million Forecast, by Country 2019 & 2032
- Table 33: Brazil Cooling Tower Rental Industry Revenue (Million) Forecast, by Application 2019 & 2032
- Table 34: Argentina Cooling Tower Rental Industry Revenue (Million) Forecast, by Application 2019 & 2032
- Table 35: Peru Cooling Tower Rental Industry Revenue (Million) Forecast, by Application 2019 & 2032
- Table 36: Chile Cooling Tower Rental Industry Revenue (Million) Forecast, by Application 2019 & 2032
- Table 37: Colombia Cooling Tower Rental Industry Revenue (Million) Forecast, by Application 2019 & 2032
- Table 38: Ecuador Cooling Tower Rental Industry Revenue (Million) Forecast, by Application 2019 & 2032
- Table 39: Venezuela Cooling Tower Rental Industry Revenue (Million) Forecast, by Application 2019 & 2032
- Table 40: Rest of South America Cooling Tower Rental Industry Revenue (Million) Forecast, by Application 2019 & 2032
- Table 41: Global Cooling Tower Rental Industry Revenue Million Forecast, by Country 2019 & 2032
- Table 42: United States Cooling Tower Rental Industry Revenue (Million) Forecast, by Application 2019 & 2032
- Table 43: Canada Cooling Tower Rental Industry Revenue (Million) Forecast, by Application 2019 & 2032
- Table 44: Mexico Cooling Tower Rental Industry Revenue (Million) Forecast, by Application 2019 & 2032
- Table 45: Global Cooling Tower Rental Industry Revenue Million Forecast, by Country 2019 & 2032
- Table 46: United Arab Emirates Cooling Tower Rental Industry Revenue (Million) Forecast, by Application 2019 & 2032
- Table 47: Saudi Arabia Cooling Tower Rental Industry Revenue (Million) Forecast, by Application 2019 & 2032
- Table 48: South Africa Cooling Tower Rental Industry Revenue (Million) Forecast, by Application 2019 & 2032
- Table 49: Rest of Middle East and Africa Cooling Tower Rental Industry Revenue (Million) Forecast, by Application 2019 & 2032
- Table 50: Global Cooling Tower Rental Industry Revenue Million Forecast, by Type 2019 & 2032
- Table 51: Global Cooling Tower Rental Industry Revenue Million Forecast, by End User 2019 & 2032
- Table 52: Global Cooling Tower Rental Industry Revenue Million Forecast, by Country 2019 & 2032
- Table 53: Global Cooling Tower Rental Industry Revenue Million Forecast, by Type 2019 & 2032
- Table 54: Global Cooling Tower Rental Industry Revenue Million Forecast, by End User 2019 & 2032
- Table 55: Global Cooling Tower Rental Industry Revenue Million Forecast, by Country 2019 & 2032
- Table 56: Global Cooling Tower Rental Industry Revenue Million Forecast, by Type 2019 & 2032
- Table 57: Global Cooling Tower Rental Industry Revenue Million Forecast, by End User 2019 & 2032
- Table 58: Global Cooling Tower Rental Industry Revenue Million Forecast, by Country 2019 & 2032
- Table 59: Global Cooling Tower Rental Industry Revenue Million Forecast, by Type 2019 & 2032
- Table 60: Global Cooling Tower Rental Industry Revenue Million Forecast, by End User 2019 & 2032
- Table 61: Global Cooling Tower Rental Industry Revenue Million Forecast, by Country 2019 & 2032
- Table 62: Global Cooling Tower Rental Industry Revenue Million Forecast, by Type 2019 & 2032
- Table 63: Global Cooling Tower Rental Industry Revenue Million Forecast, by End User 2019 & 2032
- Table 64: Global Cooling Tower Rental Industry Revenue Million Forecast, by Country 2019 & 2032
Frequently Asked Questions
1. What is the projected Compound Annual Growth Rate (CAGR) of the Cooling Tower Rental Industry?
The projected CAGR is approximately > 4.90%.
2. Which companies are prominent players in the Cooling Tower Rental Industry?
Key companies in the market include SPX Cooling Technologies Inc, Johnson Controls International PLC, KTK KUHLTURM KARLSRUHE GMBH*List Not Exhaustive, Midwest Cooling Tower Services LLC, Cooling Tower Depot Inc, Caterpillar Inc, Aggreko PLC, Baltimore Aircoil Co, Carrier Rental Systems Inc, United Rentals Inc.
3. What are the main segments of the Cooling Tower Rental Industry?
The market segments include Type, End User.
4. Can you provide details about the market size?
The market size is estimated to be USD XX Million as of 2022.
5. What are some drivers contributing to market growth?
4.; Favorable Government Policies.
6. What are the notable trends driving market growth?
Industrial Segment to Dominate the Market.
7. Are there any restraints impacting market growth?
4.; Rising Emphasis on Other Alternative Clean Energy Sources.
8. Can you provide examples of recent developments in the market?
Restrictions and impacts related to COVID-19 significantly reduced activities like air travel and commuting. This reduced the demand for fuels for transportation, and the shutdown restrictions on refineries affected the downstream sector in 2020. Since cooling towers play a major role in refinery operations, the shutdowns and reduced production rates affected the market for cooling tower rental.
9. What pricing options are available for accessing the report?
Pricing options include single-user, multi-user, and enterprise licenses priced at USD 4750, USD 5250, and USD 8750 respectively.
10. Is the market size provided in terms of value or volume?
The market size is provided in terms of value, measured in Million.
11. Are there any specific market keywords associated with the report?
Yes, the market keyword associated with the report is "Cooling Tower Rental Industry," which aids in identifying and referencing the specific market segment covered.
12. How do I determine which pricing option suits my needs best?
The pricing options vary based on user requirements and access needs. Individual users may opt for single-user licenses, while businesses requiring broader access may choose multi-user or enterprise licenses for cost-effective access to the report.
13. Are there any additional resources or data provided in the Cooling Tower Rental Industry report?
While the report offers comprehensive insights, it's advisable to review the specific contents or supplementary materials provided to ascertain if additional resources or data are available.
14. How can I stay updated on further developments or reports in the Cooling Tower Rental Industry?
To stay informed about further developments, trends, and reports in the Cooling Tower Rental Industry, consider subscribing to industry newsletters, following relevant companies and organizations, or regularly checking reputable industry news sources and publications.
Methodology
Step 1 - Identification of Relevant Samples Size from Population Database


Step 2 - Approaches for Defining Global Market Size (Value, Volume* & Price*)

Note*: In applicable scenarios
Step 3 - Data Sources
Primary Research
- Web Analytics
- Survey Reports
- Research Institute
- Latest Research Reports
- Opinion Leaders
Secondary Research
- Annual Reports
- White Paper
- Latest Press Release
- Industry Association
- Paid Database
- Investor Presentations

Step 4 - Data Triangulation
Involves using different sources of information in order to increase the validity of a study
These sources are likely to be stakeholders in a program - participants, other researchers, program staff, other community members, and so on.
Then we put all data in single framework & apply various statistical tools to find out the dynamic on the market.
During the analysis stage, feedback from the stakeholder groups would be compared to determine areas of agreement as well as areas of divergence


