
Key Insights
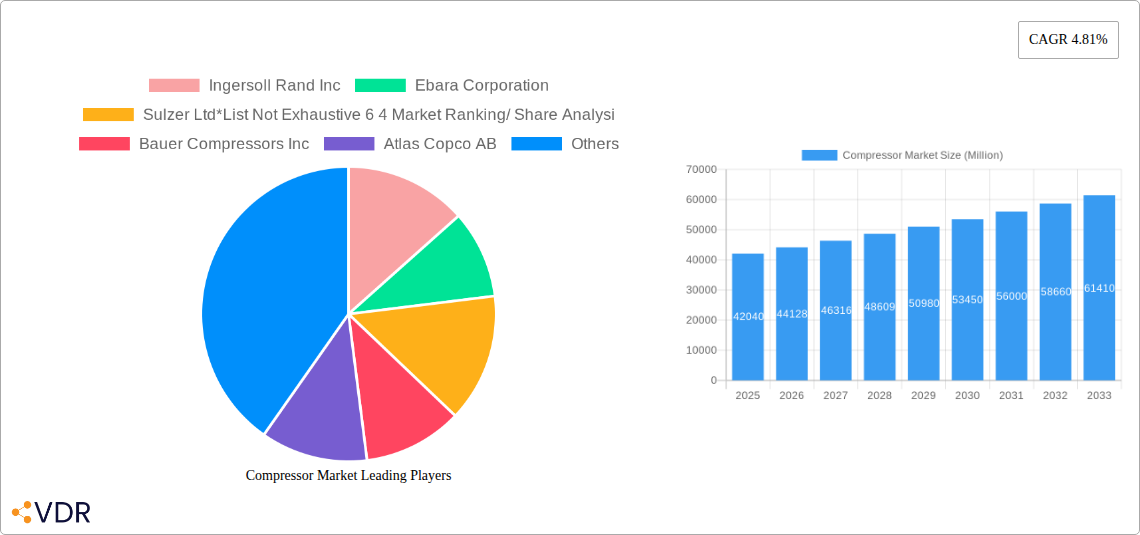
The global compressor market, valued at $42.04 billion in 2025, is projected to experience robust growth, driven by a compound annual growth rate (CAGR) of 4.81% from 2025 to 2033. This expansion is fueled by several key factors. Increased industrial activity across sectors like oil and gas, power generation, and manufacturing necessitates reliable and efficient compression technologies. The rising adoption of energy-efficient compressors, driven by environmental concerns and cost optimization strategies, further contributes to market growth. Technological advancements, such as the development of more durable and compact designs, as well as the integration of smart sensors and predictive maintenance capabilities, are also significantly impacting the market. Furthermore, the growing demand for natural gas as a cleaner energy source is stimulating compressor demand in the energy sector. While challenges such as fluctuating raw material prices and supply chain disruptions exist, the overall market outlook remains positive due to the consistent and expanding needs across diverse industrial applications.
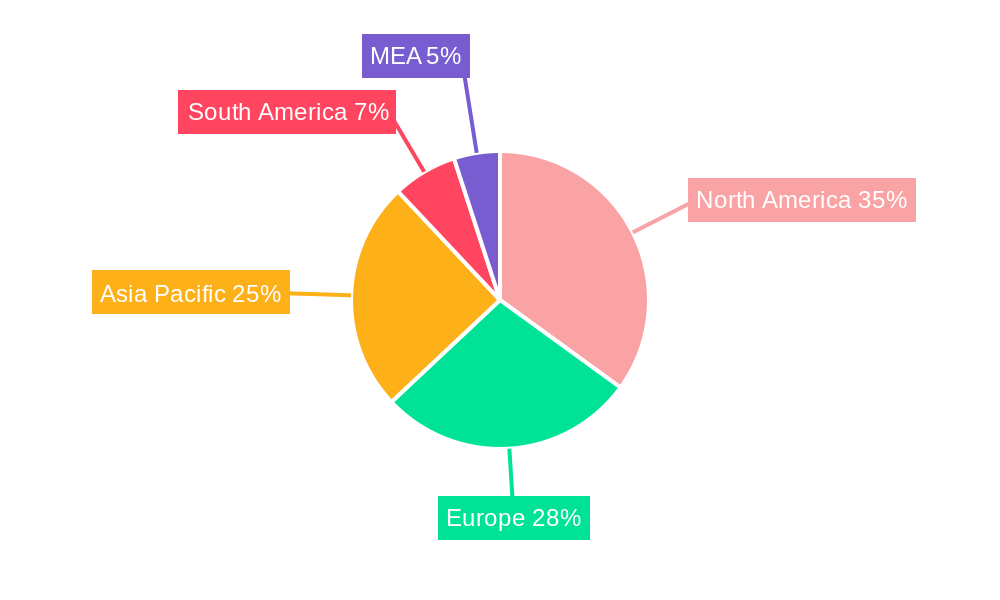
Significant regional variations exist within the compressor market. North America, with its substantial industrial base and ongoing investments in energy infrastructure, holds a leading market share. However, the Asia-Pacific region, particularly China and India, is expected to witness the fastest growth due to rapid industrialization and urbanization. Europe maintains a strong presence, driven by the focus on renewable energy and industrial automation. The Middle East and Africa region benefits from its significant oil and gas reserves and related infrastructure development. The market segmentation, encompassing positive displacement and dynamic compressors, caters to a wide range of applications and pressure requirements. The positive displacement segment, known for its high-pressure capabilities, is likely to maintain a larger market share, while the dynamic compressor segment, favored for its high-volume applications, will experience substantial growth due to advancements in its efficiency and cost-effectiveness. Key players, such as Ingersoll Rand, Atlas Copco, and Siemens Energy, are actively shaping market dynamics through innovation, acquisitions, and strategic partnerships.
Compressor Market: A Comprehensive Market Analysis (2019-2033)
This in-depth report provides a comprehensive analysis of the global compressor market, encompassing market dynamics, growth trends, regional dominance, product landscape, key players, and future outlook. The study period covers 2019-2033, with 2025 as the base and estimated year. This report is invaluable for industry professionals, investors, and strategic decision-makers seeking to navigate this dynamic market. The report segments the market by end-user (Oil and Gas Industry, Power Sector, Manufacturing Sector, Chemicals and Petrochemical Industry, Other End-Users) and by type (Positive Displacement, Dynamic).
Compressor Market Dynamics & Structure
The global compressor market is characterized by a moderately concentrated landscape, with key players holding significant market share. Technological innovation, particularly in energy efficiency and digitalization, is a primary driver, while stringent environmental regulations and the rise of renewable energy sources influence market dynamics. The market also experiences competitive pressure from substitute technologies and evolving end-user demands. M&A activity has been moderate, with a total of xx deals valued at approximately xx million USD recorded during the historical period (2019-2024).
- Market Concentration: The top 10 players account for approximately xx% of the global market share in 2025.
- Technological Innovation: Focus on energy efficiency, reduced emissions, and smart compressor technologies.
- Regulatory Framework: Stringent emission standards and safety regulations are shaping market trends.
- Competitive Substitutes: Alternative technologies such as vacuum pumps and other energy-efficient solutions pose a competitive threat.
- End-User Demographics: Growing demand from the Oil & Gas and manufacturing sectors.
- M&A Trends: Consolidation is expected to continue as companies seek to expand their market reach and product portfolios.
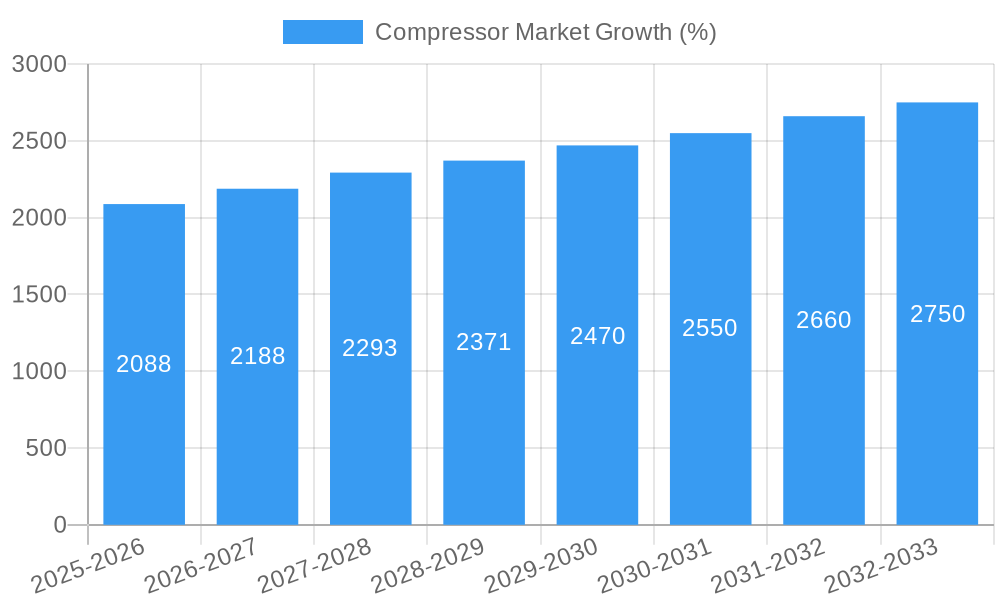
Compressor Market Growth Trends & Insights
The global compressor market is experiencing robust growth, driven by increasing industrialization, rising energy demands, and expanding infrastructure development globally. The market size is estimated at xx million units in 2025 and is projected to reach xx million units by 2033, exhibiting a CAGR of xx% during the forecast period (2025-2033). Technological advancements, such as the adoption of variable-speed drives and digital twin technology, are further accelerating market expansion. Consumer behavior shifts towards sustainability and energy efficiency are impacting product selection and market adoption rates.
Dominant Regions, Countries, or Segments in Compressor Market
The North American region currently holds the largest market share, followed by Asia-Pacific and Europe. Within end-user segments, the Oil and Gas industry represents the largest market share, driven by strong demand for high-capacity compressors in upstream and midstream operations. The Positive Displacement compressor type dominates the market due to its high efficiency and suitability for various applications.
- Key Drivers (North America): Robust Oil & Gas sector, mature manufacturing base, and supportive government policies.
- Key Drivers (Asia-Pacific): Rapid industrialization, rising energy consumption, and expanding infrastructure projects.
- Key Drivers (Oil & Gas Segment): Demand for efficient and reliable compressors for oil and gas extraction and processing.
- Key Drivers (Positive Displacement Segment): High efficiency, durability, and suitability for various applications.
Compressor Market Product Landscape
The compressor market offers a wide range of products, from reciprocating and centrifugal compressors to screw and rotary vane compressors. Recent innovations focus on enhancing energy efficiency, reducing noise pollution, and improving reliability. Products are differentiated based on capacity, pressure range, and specific application requirements. Key features include smart controls, predictive maintenance capabilities, and advanced materials for improved durability.
Key Drivers, Barriers & Challenges in Compressor Market
Key Drivers:
- Increasing industrialization and infrastructure development.
- Growing demand for energy-efficient compressors.
- Technological advancements such as IoT and digital twin technology.
Key Challenges:
- Fluctuations in raw material prices and supply chain disruptions.
- Stringent environmental regulations and emission standards.
- Intense competition from established players and new entrants. This competition is resulting in approximately xx% price pressure annually.
Emerging Opportunities in Compressor Market
- Growing adoption of renewable energy technologies, including wind and solar power.
- Increased demand for compressors in emerging markets such as Africa and Latin America.
- Development of high-efficiency compressors for data centers and other specialized applications.
Growth Accelerators in the Compressor Market Industry
Strategic partnerships, particularly between compressor manufacturers and end-users, are accelerating market growth. Technological breakthroughs in materials science and digital technologies are driving the development of next-generation compressors that offer enhanced performance and efficiency. Market expansion strategies, including the development of new sales channels and the diversification of product portfolios are also key growth catalysts.
Key Players Shaping the Compressor Market Market
- Ingersoll Rand Inc
- Ebara Corporation
- Sulzer Ltd
- Bauer Compressors Inc
- Atlas Copco AB
- Baker Hughes Co
- Ariel Corporation
- Aerzener Maschinenfabrik GmbH
- Burckhardt Compression Holding AG
- Siemens Energy AG
Notable Milestones in Compressor Market Sector
- April 2024: The Srikail gas field in Cumilla, Bangladesh, signed a contract for three wellhead compressors with a capacity of 10 million cubic feet per day, highlighting growth in the oil and gas sector in emerging markets.
- March 2023: Sapphire Gas Solutions and Bauer Compressors Inc. announced a national partnership, expanding Bauer's market reach and service capabilities across North America.
In-Depth Compressor Market Market Outlook
The future of the compressor market is promising, with continued growth driven by technological advancements, expanding industrialization, and increasing demand for energy-efficient solutions. Strategic investments in R&D, focus on sustainability, and the development of innovative business models will be crucial for players to capture market share and achieve long-term success in this competitive landscape. The market is expected to see significant expansion in emerging economies, particularly in Asia-Pacific and Africa.
Compressor Market Segmentation
-
1. End-User
- 1.1. Oil and Gas Industry
- 1.2. Power Sector
- 1.3. Manufacturing Sector
- 1.4. Chemicals and Petrochemical Industry
- 1.5. Other End-Users
-
2. Type
- 2.1. Positive Displacement
- 2.2. Dynamic
Compressor Market Segmentation By Geography
-
1. North America
- 1.1. United States
- 1.2. Canada
- 1.3. Rest of North America
-
2. Europe
- 2.1. Germany
- 2.2. France
- 2.3. United Kingdom
- 2.4. Spain
- 2.5. Norway
- 2.6. Turkey
- 2.7. Russia
- 2.8. NORDIC
- 2.9. Rest of Europe
-
3. Asia Pacific
- 3.1. China
- 3.2. India
- 3.3. Malaysia
- 3.4. Thailand
- 3.5. Australia
- 3.6. Indonesia
- 3.7. Vietnam
- 4. Rest of Asia Pacific
-
5. South America
- 5.1. Brazil
- 5.2. Argentina
- 5.3. Colombia
- 5.4. Rest of South America
-
6. Middle East and Africa
- 6.1. Saudi Arabia
- 6.2. United Arab Emirates
- 6.3. South Africa
- 6.4. Nigeria
- 6.5. Qatar
- 7. Egypt
- 8. Rest of Middle East and Africa
Compressor Market REPORT HIGHLIGHTS
| Aspects | Details |
|---|---|
| Study Period | 2019-2033 |
| Base Year | 2024 |
| Estimated Year | 2025 |
| Forecast Period | 2025-2033 |
| Historical Period | 2019-2024 |
| Growth Rate | CAGR of 4.81% from 2019-2033 |
| Segmentation |
|
Table of Contents
- 1. Introduction
- 1.1. Research Scope
- 1.2. Market Segmentation
- 1.3. Research Methodology
- 1.4. Definitions and Assumptions
- 2. Executive Summary
- 2.1. Introduction
- 3. Market Dynamics
- 3.1. Introduction
- 3.2. Market Drivers
- 3.2.1. 4.; The Growing Demand for Natural Gas4.; Rising Pipeline Infrastructure across Globe
- 3.3. Market Restrains
- 3.3.1. 4.; Increasing Adoption of Solar and Wind Energies
- 3.4. Market Trends
- 3.4.1. Oil and Gas Segment Expected to Dominate the Market
- 4. Market Factor Analysis
- 4.1. Porters Five Forces
- 4.2. Supply/Value Chain
- 4.3. PESTEL analysis
- 4.4. Market Entropy
- 4.5. Patent/Trademark Analysis
- 5. Global Compressor Market Analysis, Insights and Forecast, 2019-2031
- 5.1. Market Analysis, Insights and Forecast - by End-User
- 5.1.1. Oil and Gas Industry
- 5.1.2. Power Sector
- 5.1.3. Manufacturing Sector
- 5.1.4. Chemicals and Petrochemical Industry
- 5.1.5. Other End-Users
- 5.2. Market Analysis, Insights and Forecast - by Type
- 5.2.1. Positive Displacement
- 5.2.2. Dynamic
- 5.3. Market Analysis, Insights and Forecast - by Region
- 5.3.1. North America
- 5.3.2. Europe
- 5.3.3. Asia Pacific
- 5.3.4. Rest of Asia Pacific
- 5.3.5. South America
- 5.3.6. Middle East and Africa
- 5.3.7. Egypt
- 5.3.8. Rest of Middle East and Africa
- 5.1. Market Analysis, Insights and Forecast - by End-User
- 6. North America Compressor Market Analysis, Insights and Forecast, 2019-2031
- 6.1. Market Analysis, Insights and Forecast - by End-User
- 6.1.1. Oil and Gas Industry
- 6.1.2. Power Sector
- 6.1.3. Manufacturing Sector
- 6.1.4. Chemicals and Petrochemical Industry
- 6.1.5. Other End-Users
- 6.2. Market Analysis, Insights and Forecast - by Type
- 6.2.1. Positive Displacement
- 6.2.2. Dynamic
- 6.1. Market Analysis, Insights and Forecast - by End-User
- 7. Europe Compressor Market Analysis, Insights and Forecast, 2019-2031
- 7.1. Market Analysis, Insights and Forecast - by End-User
- 7.1.1. Oil and Gas Industry
- 7.1.2. Power Sector
- 7.1.3. Manufacturing Sector
- 7.1.4. Chemicals and Petrochemical Industry
- 7.1.5. Other End-Users
- 7.2. Market Analysis, Insights and Forecast - by Type
- 7.2.1. Positive Displacement
- 7.2.2. Dynamic
- 7.1. Market Analysis, Insights and Forecast - by End-User
- 8. Asia Pacific Compressor Market Analysis, Insights and Forecast, 2019-2031
- 8.1. Market Analysis, Insights and Forecast - by End-User
- 8.1.1. Oil and Gas Industry
- 8.1.2. Power Sector
- 8.1.3. Manufacturing Sector
- 8.1.4. Chemicals and Petrochemical Industry
- 8.1.5. Other End-Users
- 8.2. Market Analysis, Insights and Forecast - by Type
- 8.2.1. Positive Displacement
- 8.2.2. Dynamic
- 8.1. Market Analysis, Insights and Forecast - by End-User
- 9. Rest of Asia Pacific Compressor Market Analysis, Insights and Forecast, 2019-2031
- 9.1. Market Analysis, Insights and Forecast - by End-User
- 9.1.1. Oil and Gas Industry
- 9.1.2. Power Sector
- 9.1.3. Manufacturing Sector
- 9.1.4. Chemicals and Petrochemical Industry
- 9.1.5. Other End-Users
- 9.2. Market Analysis, Insights and Forecast - by Type
- 9.2.1. Positive Displacement
- 9.2.2. Dynamic
- 9.1. Market Analysis, Insights and Forecast - by End-User
- 10. South America Compressor Market Analysis, Insights and Forecast, 2019-2031
- 10.1. Market Analysis, Insights and Forecast - by End-User
- 10.1.1. Oil and Gas Industry
- 10.1.2. Power Sector
- 10.1.3. Manufacturing Sector
- 10.1.4. Chemicals and Petrochemical Industry
- 10.1.5. Other End-Users
- 10.2. Market Analysis, Insights and Forecast - by Type
- 10.2.1. Positive Displacement
- 10.2.2. Dynamic
- 10.1. Market Analysis, Insights and Forecast - by End-User
- 11. Middle East and Africa Compressor Market Analysis, Insights and Forecast, 2019-2031
- 11.1. Market Analysis, Insights and Forecast - by End-User
- 11.1.1. Oil and Gas Industry
- 11.1.2. Power Sector
- 11.1.3. Manufacturing Sector
- 11.1.4. Chemicals and Petrochemical Industry
- 11.1.5. Other End-Users
- 11.2. Market Analysis, Insights and Forecast - by Type
- 11.2.1. Positive Displacement
- 11.2.2. Dynamic
- 11.1. Market Analysis, Insights and Forecast - by End-User
- 12. Egypt Compressor Market Analysis, Insights and Forecast, 2019-2031
- 12.1. Market Analysis, Insights and Forecast - by End-User
- 12.1.1. Oil and Gas Industry
- 12.1.2. Power Sector
- 12.1.3. Manufacturing Sector
- 12.1.4. Chemicals and Petrochemical Industry
- 12.1.5. Other End-Users
- 12.2. Market Analysis, Insights and Forecast - by Type
- 12.2.1. Positive Displacement
- 12.2.2. Dynamic
- 12.1. Market Analysis, Insights and Forecast - by End-User
- 13. Rest of Middle East and Africa Compressor Market Analysis, Insights and Forecast, 2019-2031
- 13.1. Market Analysis, Insights and Forecast - by End-User
- 13.1.1. Oil and Gas Industry
- 13.1.2. Power Sector
- 13.1.3. Manufacturing Sector
- 13.1.4. Chemicals and Petrochemical Industry
- 13.1.5. Other End-Users
- 13.2. Market Analysis, Insights and Forecast - by Type
- 13.2.1. Positive Displacement
- 13.2.2. Dynamic
- 13.1. Market Analysis, Insights and Forecast - by End-User
- 14. North America Compressor Market Analysis, Insights and Forecast, 2019-2031
- 14.1. Market Analysis, Insights and Forecast - By Country/Sub-region
- 14.1.1 United States
- 14.1.2 Canada
- 14.1.3 Mexico
- 15. Europe Compressor Market Analysis, Insights and Forecast, 2019-2031
- 15.1. Market Analysis, Insights and Forecast - By Country/Sub-region
- 15.1.1 Germany
- 15.1.2 United Kingdom
- 15.1.3 France
- 15.1.4 Spain
- 15.1.5 Italy
- 15.1.6 Spain
- 15.1.7 Belgium
- 15.1.8 Netherland
- 15.1.9 Nordics
- 15.1.10 Rest of Europe
- 16. Asia Pacific Compressor Market Analysis, Insights and Forecast, 2019-2031
- 16.1. Market Analysis, Insights and Forecast - By Country/Sub-region
- 16.1.1 China
- 16.1.2 Japan
- 16.1.3 India
- 16.1.4 South Korea
- 16.1.5 Southeast Asia
- 16.1.6 Australia
- 16.1.7 Indonesia
- 16.1.8 Phillipes
- 16.1.9 Singapore
- 16.1.10 Thailandc
- 16.1.11 Rest of Asia Pacific
- 17. South America Compressor Market Analysis, Insights and Forecast, 2019-2031
- 17.1. Market Analysis, Insights and Forecast - By Country/Sub-region
- 17.1.1 Brazil
- 17.1.2 Argentina
- 17.1.3 Peru
- 17.1.4 Chile
- 17.1.5 Colombia
- 17.1.6 Ecuador
- 17.1.7 Venezuela
- 17.1.8 Rest of South America
- 18. North America Compressor Market Analysis, Insights and Forecast, 2019-2031
- 18.1. Market Analysis, Insights and Forecast - By Country/Sub-region
- 18.1.1 United States
- 18.1.2 Canada
- 18.1.3 Mexico
- 19. MEA Compressor Market Analysis, Insights and Forecast, 2019-2031
- 19.1. Market Analysis, Insights and Forecast - By Country/Sub-region
- 19.1.1 United Arab Emirates
- 19.1.2 Saudi Arabia
- 19.1.3 South Africa
- 19.1.4 Rest of Middle East and Africa
- 20. Competitive Analysis
- 20.1. Global Market Share Analysis 2024
- 20.2. Company Profiles
- 20.2.1 Ingersoll Rand Inc
- 20.2.1.1. Overview
- 20.2.1.2. Products
- 20.2.1.3. SWOT Analysis
- 20.2.1.4. Recent Developments
- 20.2.1.5. Financials (Based on Availability)
- 20.2.2 Ebara Corporation
- 20.2.2.1. Overview
- 20.2.2.2. Products
- 20.2.2.3. SWOT Analysis
- 20.2.2.4. Recent Developments
- 20.2.2.5. Financials (Based on Availability)
- 20.2.3 Sulzer Ltd*List Not Exhaustive 6 4 Market Ranking/ Share Analysi
- 20.2.3.1. Overview
- 20.2.3.2. Products
- 20.2.3.3. SWOT Analysis
- 20.2.3.4. Recent Developments
- 20.2.3.5. Financials (Based on Availability)
- 20.2.4 Bauer Compressors Inc
- 20.2.4.1. Overview
- 20.2.4.2. Products
- 20.2.4.3. SWOT Analysis
- 20.2.4.4. Recent Developments
- 20.2.4.5. Financials (Based on Availability)
- 20.2.5 Atlas Copco AB
- 20.2.5.1. Overview
- 20.2.5.2. Products
- 20.2.5.3. SWOT Analysis
- 20.2.5.4. Recent Developments
- 20.2.5.5. Financials (Based on Availability)
- 20.2.6 Baker Hughes Co
- 20.2.6.1. Overview
- 20.2.6.2. Products
- 20.2.6.3. SWOT Analysis
- 20.2.6.4. Recent Developments
- 20.2.6.5. Financials (Based on Availability)
- 20.2.7 Ariel Corporation
- 20.2.7.1. Overview
- 20.2.7.2. Products
- 20.2.7.3. SWOT Analysis
- 20.2.7.4. Recent Developments
- 20.2.7.5. Financials (Based on Availability)
- 20.2.8 Aerzener Maschinenfabrik GmbH
- 20.2.8.1. Overview
- 20.2.8.2. Products
- 20.2.8.3. SWOT Analysis
- 20.2.8.4. Recent Developments
- 20.2.8.5. Financials (Based on Availability)
- 20.2.9 Burckhardt Compression Holding AG
- 20.2.9.1. Overview
- 20.2.9.2. Products
- 20.2.9.3. SWOT Analysis
- 20.2.9.4. Recent Developments
- 20.2.9.5. Financials (Based on Availability)
- 20.2.10 Siemens Energy AG
- 20.2.10.1. Overview
- 20.2.10.2. Products
- 20.2.10.3. SWOT Analysis
- 20.2.10.4. Recent Developments
- 20.2.10.5. Financials (Based on Availability)
- 20.2.1 Ingersoll Rand Inc
List of Figures
- Figure 1: Global Compressor Market Revenue Breakdown (Million, %) by Region 2024 & 2032
- Figure 2: North America Compressor Market Revenue (Million), by Country 2024 & 2032
- Figure 3: North America Compressor Market Revenue Share (%), by Country 2024 & 2032
- Figure 4: Europe Compressor Market Revenue (Million), by Country 2024 & 2032
- Figure 5: Europe Compressor Market Revenue Share (%), by Country 2024 & 2032
- Figure 6: Asia Pacific Compressor Market Revenue (Million), by Country 2024 & 2032
- Figure 7: Asia Pacific Compressor Market Revenue Share (%), by Country 2024 & 2032
- Figure 8: South America Compressor Market Revenue (Million), by Country 2024 & 2032
- Figure 9: South America Compressor Market Revenue Share (%), by Country 2024 & 2032
- Figure 10: North America Compressor Market Revenue (Million), by Country 2024 & 2032
- Figure 11: North America Compressor Market Revenue Share (%), by Country 2024 & 2032
- Figure 12: MEA Compressor Market Revenue (Million), by Country 2024 & 2032
- Figure 13: MEA Compressor Market Revenue Share (%), by Country 2024 & 2032
- Figure 14: North America Compressor Market Revenue (Million), by End-User 2024 & 2032
- Figure 15: North America Compressor Market Revenue Share (%), by End-User 2024 & 2032
- Figure 16: North America Compressor Market Revenue (Million), by Type 2024 & 2032
- Figure 17: North America Compressor Market Revenue Share (%), by Type 2024 & 2032
- Figure 18: North America Compressor Market Revenue (Million), by Country 2024 & 2032
- Figure 19: North America Compressor Market Revenue Share (%), by Country 2024 & 2032
- Figure 20: Europe Compressor Market Revenue (Million), by End-User 2024 & 2032
- Figure 21: Europe Compressor Market Revenue Share (%), by End-User 2024 & 2032
- Figure 22: Europe Compressor Market Revenue (Million), by Type 2024 & 2032
- Figure 23: Europe Compressor Market Revenue Share (%), by Type 2024 & 2032
- Figure 24: Europe Compressor Market Revenue (Million), by Country 2024 & 2032
- Figure 25: Europe Compressor Market Revenue Share (%), by Country 2024 & 2032
- Figure 26: Asia Pacific Compressor Market Revenue (Million), by End-User 2024 & 2032
- Figure 27: Asia Pacific Compressor Market Revenue Share (%), by End-User 2024 & 2032
- Figure 28: Asia Pacific Compressor Market Revenue (Million), by Type 2024 & 2032
- Figure 29: Asia Pacific Compressor Market Revenue Share (%), by Type 2024 & 2032
- Figure 30: Asia Pacific Compressor Market Revenue (Million), by Country 2024 & 2032
- Figure 31: Asia Pacific Compressor Market Revenue Share (%), by Country 2024 & 2032
- Figure 32: Rest of Asia Pacific Compressor Market Revenue (Million), by End-User 2024 & 2032
- Figure 33: Rest of Asia Pacific Compressor Market Revenue Share (%), by End-User 2024 & 2032
- Figure 34: Rest of Asia Pacific Compressor Market Revenue (Million), by Type 2024 & 2032
- Figure 35: Rest of Asia Pacific Compressor Market Revenue Share (%), by Type 2024 & 2032
- Figure 36: Rest of Asia Pacific Compressor Market Revenue (Million), by Country 2024 & 2032
- Figure 37: Rest of Asia Pacific Compressor Market Revenue Share (%), by Country 2024 & 2032
- Figure 38: South America Compressor Market Revenue (Million), by End-User 2024 & 2032
- Figure 39: South America Compressor Market Revenue Share (%), by End-User 2024 & 2032
- Figure 40: South America Compressor Market Revenue (Million), by Type 2024 & 2032
- Figure 41: South America Compressor Market Revenue Share (%), by Type 2024 & 2032
- Figure 42: South America Compressor Market Revenue (Million), by Country 2024 & 2032
- Figure 43: South America Compressor Market Revenue Share (%), by Country 2024 & 2032
- Figure 44: Middle East and Africa Compressor Market Revenue (Million), by End-User 2024 & 2032
- Figure 45: Middle East and Africa Compressor Market Revenue Share (%), by End-User 2024 & 2032
- Figure 46: Middle East and Africa Compressor Market Revenue (Million), by Type 2024 & 2032
- Figure 47: Middle East and Africa Compressor Market Revenue Share (%), by Type 2024 & 2032
- Figure 48: Middle East and Africa Compressor Market Revenue (Million), by Country 2024 & 2032
- Figure 49: Middle East and Africa Compressor Market Revenue Share (%), by Country 2024 & 2032
- Figure 50: Egypt Compressor Market Revenue (Million), by End-User 2024 & 2032
- Figure 51: Egypt Compressor Market Revenue Share (%), by End-User 2024 & 2032
- Figure 52: Egypt Compressor Market Revenue (Million), by Type 2024 & 2032
- Figure 53: Egypt Compressor Market Revenue Share (%), by Type 2024 & 2032
- Figure 54: Egypt Compressor Market Revenue (Million), by Country 2024 & 2032
- Figure 55: Egypt Compressor Market Revenue Share (%), by Country 2024 & 2032
- Figure 56: Rest of Middle East and Africa Compressor Market Revenue (Million), by End-User 2024 & 2032
- Figure 57: Rest of Middle East and Africa Compressor Market Revenue Share (%), by End-User 2024 & 2032
- Figure 58: Rest of Middle East and Africa Compressor Market Revenue (Million), by Type 2024 & 2032
- Figure 59: Rest of Middle East and Africa Compressor Market Revenue Share (%), by Type 2024 & 2032
- Figure 60: Rest of Middle East and Africa Compressor Market Revenue (Million), by Country 2024 & 2032
- Figure 61: Rest of Middle East and Africa Compressor Market Revenue Share (%), by Country 2024 & 2032
List of Tables
- Table 1: Global Compressor Market Revenue Million Forecast, by Region 2019 & 2032
- Table 2: Global Compressor Market Revenue Million Forecast, by End-User 2019 & 2032
- Table 3: Global Compressor Market Revenue Million Forecast, by Type 2019 & 2032
- Table 4: Global Compressor Market Revenue Million Forecast, by Region 2019 & 2032
- Table 5: Global Compressor Market Revenue Million Forecast, by Country 2019 & 2032
- Table 6: United States Compressor Market Revenue (Million) Forecast, by Application 2019 & 2032
- Table 7: Canada Compressor Market Revenue (Million) Forecast, by Application 2019 & 2032
- Table 8: Mexico Compressor Market Revenue (Million) Forecast, by Application 2019 & 2032
- Table 9: Global Compressor Market Revenue Million Forecast, by Country 2019 & 2032
- Table 10: Germany Compressor Market Revenue (Million) Forecast, by Application 2019 & 2032
- Table 11: United Kingdom Compressor Market Revenue (Million) Forecast, by Application 2019 & 2032
- Table 12: France Compressor Market Revenue (Million) Forecast, by Application 2019 & 2032
- Table 13: Spain Compressor Market Revenue (Million) Forecast, by Application 2019 & 2032
- Table 14: Italy Compressor Market Revenue (Million) Forecast, by Application 2019 & 2032
- Table 15: Spain Compressor Market Revenue (Million) Forecast, by Application 2019 & 2032
- Table 16: Belgium Compressor Market Revenue (Million) Forecast, by Application 2019 & 2032
- Table 17: Netherland Compressor Market Revenue (Million) Forecast, by Application 2019 & 2032
- Table 18: Nordics Compressor Market Revenue (Million) Forecast, by Application 2019 & 2032
- Table 19: Rest of Europe Compressor Market Revenue (Million) Forecast, by Application 2019 & 2032
- Table 20: Global Compressor Market Revenue Million Forecast, by Country 2019 & 2032
- Table 21: China Compressor Market Revenue (Million) Forecast, by Application 2019 & 2032
- Table 22: Japan Compressor Market Revenue (Million) Forecast, by Application 2019 & 2032
- Table 23: India Compressor Market Revenue (Million) Forecast, by Application 2019 & 2032
- Table 24: South Korea Compressor Market Revenue (Million) Forecast, by Application 2019 & 2032
- Table 25: Southeast Asia Compressor Market Revenue (Million) Forecast, by Application 2019 & 2032
- Table 26: Australia Compressor Market Revenue (Million) Forecast, by Application 2019 & 2032
- Table 27: Indonesia Compressor Market Revenue (Million) Forecast, by Application 2019 & 2032
- Table 28: Phillipes Compressor Market Revenue (Million) Forecast, by Application 2019 & 2032
- Table 29: Singapore Compressor Market Revenue (Million) Forecast, by Application 2019 & 2032
- Table 30: Thailandc Compressor Market Revenue (Million) Forecast, by Application 2019 & 2032
- Table 31: Rest of Asia Pacific Compressor Market Revenue (Million) Forecast, by Application 2019 & 2032
- Table 32: Global Compressor Market Revenue Million Forecast, by Country 2019 & 2032
- Table 33: Brazil Compressor Market Revenue (Million) Forecast, by Application 2019 & 2032
- Table 34: Argentina Compressor Market Revenue (Million) Forecast, by Application 2019 & 2032
- Table 35: Peru Compressor Market Revenue (Million) Forecast, by Application 2019 & 2032
- Table 36: Chile Compressor Market Revenue (Million) Forecast, by Application 2019 & 2032
- Table 37: Colombia Compressor Market Revenue (Million) Forecast, by Application 2019 & 2032
- Table 38: Ecuador Compressor Market Revenue (Million) Forecast, by Application 2019 & 2032
- Table 39: Venezuela Compressor Market Revenue (Million) Forecast, by Application 2019 & 2032
- Table 40: Rest of South America Compressor Market Revenue (Million) Forecast, by Application 2019 & 2032
- Table 41: Global Compressor Market Revenue Million Forecast, by Country 2019 & 2032
- Table 42: United States Compressor Market Revenue (Million) Forecast, by Application 2019 & 2032
- Table 43: Canada Compressor Market Revenue (Million) Forecast, by Application 2019 & 2032
- Table 44: Mexico Compressor Market Revenue (Million) Forecast, by Application 2019 & 2032
- Table 45: Global Compressor Market Revenue Million Forecast, by Country 2019 & 2032
- Table 46: United Arab Emirates Compressor Market Revenue (Million) Forecast, by Application 2019 & 2032
- Table 47: Saudi Arabia Compressor Market Revenue (Million) Forecast, by Application 2019 & 2032
- Table 48: South Africa Compressor Market Revenue (Million) Forecast, by Application 2019 & 2032
- Table 49: Rest of Middle East and Africa Compressor Market Revenue (Million) Forecast, by Application 2019 & 2032
- Table 50: Global Compressor Market Revenue Million Forecast, by End-User 2019 & 2032
- Table 51: Global Compressor Market Revenue Million Forecast, by Type 2019 & 2032
- Table 52: Global Compressor Market Revenue Million Forecast, by Country 2019 & 2032
- Table 53: United States Compressor Market Revenue (Million) Forecast, by Application 2019 & 2032
- Table 54: Canada Compressor Market Revenue (Million) Forecast, by Application 2019 & 2032
- Table 55: Rest of North America Compressor Market Revenue (Million) Forecast, by Application 2019 & 2032
- Table 56: Global Compressor Market Revenue Million Forecast, by End-User 2019 & 2032
- Table 57: Global Compressor Market Revenue Million Forecast, by Type 2019 & 2032
- Table 58: Global Compressor Market Revenue Million Forecast, by Country 2019 & 2032
- Table 59: Germany Compressor Market Revenue (Million) Forecast, by Application 2019 & 2032
- Table 60: France Compressor Market Revenue (Million) Forecast, by Application 2019 & 2032
- Table 61: United Kingdom Compressor Market Revenue (Million) Forecast, by Application 2019 & 2032
- Table 62: Spain Compressor Market Revenue (Million) Forecast, by Application 2019 & 2032
- Table 63: Norway Compressor Market Revenue (Million) Forecast, by Application 2019 & 2032
- Table 64: Turkey Compressor Market Revenue (Million) Forecast, by Application 2019 & 2032
- Table 65: Russia Compressor Market Revenue (Million) Forecast, by Application 2019 & 2032
- Table 66: NORDIC Compressor Market Revenue (Million) Forecast, by Application 2019 & 2032
- Table 67: Rest of Europe Compressor Market Revenue (Million) Forecast, by Application 2019 & 2032
- Table 68: Global Compressor Market Revenue Million Forecast, by End-User 2019 & 2032
- Table 69: Global Compressor Market Revenue Million Forecast, by Type 2019 & 2032
- Table 70: Global Compressor Market Revenue Million Forecast, by Country 2019 & 2032
- Table 71: China Compressor Market Revenue (Million) Forecast, by Application 2019 & 2032
- Table 72: India Compressor Market Revenue (Million) Forecast, by Application 2019 & 2032
- Table 73: Malaysia Compressor Market Revenue (Million) Forecast, by Application 2019 & 2032
- Table 74: Thailand Compressor Market Revenue (Million) Forecast, by Application 2019 & 2032
- Table 75: Australia Compressor Market Revenue (Million) Forecast, by Application 2019 & 2032
- Table 76: Indonesia Compressor Market Revenue (Million) Forecast, by Application 2019 & 2032
- Table 77: Vietnam Compressor Market Revenue (Million) Forecast, by Application 2019 & 2032
- Table 78: Global Compressor Market Revenue Million Forecast, by End-User 2019 & 2032
- Table 79: Global Compressor Market Revenue Million Forecast, by Type 2019 & 2032
- Table 80: Global Compressor Market Revenue Million Forecast, by Country 2019 & 2032
- Table 81: Global Compressor Market Revenue Million Forecast, by End-User 2019 & 2032
- Table 82: Global Compressor Market Revenue Million Forecast, by Type 2019 & 2032
- Table 83: Global Compressor Market Revenue Million Forecast, by Country 2019 & 2032
- Table 84: Brazil Compressor Market Revenue (Million) Forecast, by Application 2019 & 2032
- Table 85: Argentina Compressor Market Revenue (Million) Forecast, by Application 2019 & 2032
- Table 86: Colombia Compressor Market Revenue (Million) Forecast, by Application 2019 & 2032
- Table 87: Rest of South America Compressor Market Revenue (Million) Forecast, by Application 2019 & 2032
- Table 88: Global Compressor Market Revenue Million Forecast, by End-User 2019 & 2032
- Table 89: Global Compressor Market Revenue Million Forecast, by Type 2019 & 2032
- Table 90: Global Compressor Market Revenue Million Forecast, by Country 2019 & 2032
- Table 91: Saudi Arabia Compressor Market Revenue (Million) Forecast, by Application 2019 & 2032
- Table 92: United Arab Emirates Compressor Market Revenue (Million) Forecast, by Application 2019 & 2032
- Table 93: South Africa Compressor Market Revenue (Million) Forecast, by Application 2019 & 2032
- Table 94: Nigeria Compressor Market Revenue (Million) Forecast, by Application 2019 & 2032
- Table 95: Qatar Compressor Market Revenue (Million) Forecast, by Application 2019 & 2032
- Table 96: Global Compressor Market Revenue Million Forecast, by End-User 2019 & 2032
- Table 97: Global Compressor Market Revenue Million Forecast, by Type 2019 & 2032
- Table 98: Global Compressor Market Revenue Million Forecast, by Country 2019 & 2032
- Table 99: Global Compressor Market Revenue Million Forecast, by End-User 2019 & 2032
- Table 100: Global Compressor Market Revenue Million Forecast, by Type 2019 & 2032
- Table 101: Global Compressor Market Revenue Million Forecast, by Country 2019 & 2032
Frequently Asked Questions
1. What is the projected Compound Annual Growth Rate (CAGR) of the Compressor Market?
The projected CAGR is approximately 4.81%.
2. Which companies are prominent players in the Compressor Market?
Key companies in the market include Ingersoll Rand Inc, Ebara Corporation, Sulzer Ltd*List Not Exhaustive 6 4 Market Ranking/ Share Analysi, Bauer Compressors Inc, Atlas Copco AB, Baker Hughes Co, Ariel Corporation, Aerzener Maschinenfabrik GmbH, Burckhardt Compression Holding AG, Siemens Energy AG.
3. What are the main segments of the Compressor Market?
The market segments include End-User, Type.
4. Can you provide details about the market size?
The market size is estimated to be USD 42.04 Million as of 2022.
5. What are some drivers contributing to market growth?
4.; The Growing Demand for Natural Gas4.; Rising Pipeline Infrastructure across Globe.
6. What are the notable trends driving market growth?
Oil and Gas Segment Expected to Dominate the Market.
7. Are there any restraints impacting market growth?
4.; Increasing Adoption of Solar and Wind Energies.
8. Can you provide examples of recent developments in the market?
April 2024: The Srikail gas field in Cumilla signed a contract to receive three wellhead compressors with a capacity of 10 million cubic feet per day, along with related infrastructure, owing to a deal inked by Bangladesh Petroleum Exploration and Production Company Ltd and SC Euro Gas Systems SRL, Romania.
9. What pricing options are available for accessing the report?
Pricing options include single-user, multi-user, and enterprise licenses priced at USD 4750, USD 5250, and USD 8750 respectively.
10. Is the market size provided in terms of value or volume?
The market size is provided in terms of value, measured in Million.
11. Are there any specific market keywords associated with the report?
Yes, the market keyword associated with the report is "Compressor Market," which aids in identifying and referencing the specific market segment covered.
12. How do I determine which pricing option suits my needs best?
The pricing options vary based on user requirements and access needs. Individual users may opt for single-user licenses, while businesses requiring broader access may choose multi-user or enterprise licenses for cost-effective access to the report.
13. Are there any additional resources or data provided in the Compressor Market report?
While the report offers comprehensive insights, it's advisable to review the specific contents or supplementary materials provided to ascertain if additional resources or data are available.
14. How can I stay updated on further developments or reports in the Compressor Market?
To stay informed about further developments, trends, and reports in the Compressor Market, consider subscribing to industry newsletters, following relevant companies and organizations, or regularly checking reputable industry news sources and publications.
Methodology
Step 1 - Identification of Relevant Samples Size from Population Database


Step 2 - Approaches for Defining Global Market Size (Value, Volume* & Price*)

Note*: In applicable scenarios
Step 3 - Data Sources
Primary Research
- Web Analytics
- Survey Reports
- Research Institute
- Latest Research Reports
- Opinion Leaders
Secondary Research
- Annual Reports
- White Paper
- Latest Press Release
- Industry Association
- Paid Database
- Investor Presentations

Step 4 - Data Triangulation
Involves using different sources of information in order to increase the validity of a study
These sources are likely to be stakeholders in a program - participants, other researchers, program staff, other community members, and so on.
Then we put all data in single framework & apply various statistical tools to find out the dynamic on the market.
During the analysis stage, feedback from the stakeholder groups would be compared to determine areas of agreement as well as areas of divergence


