
Key Insights
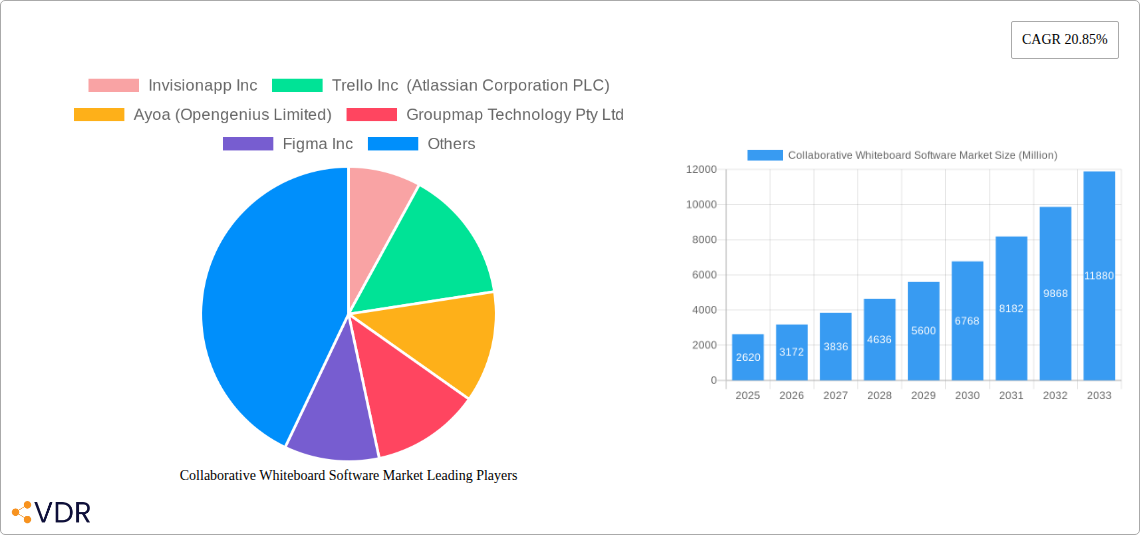
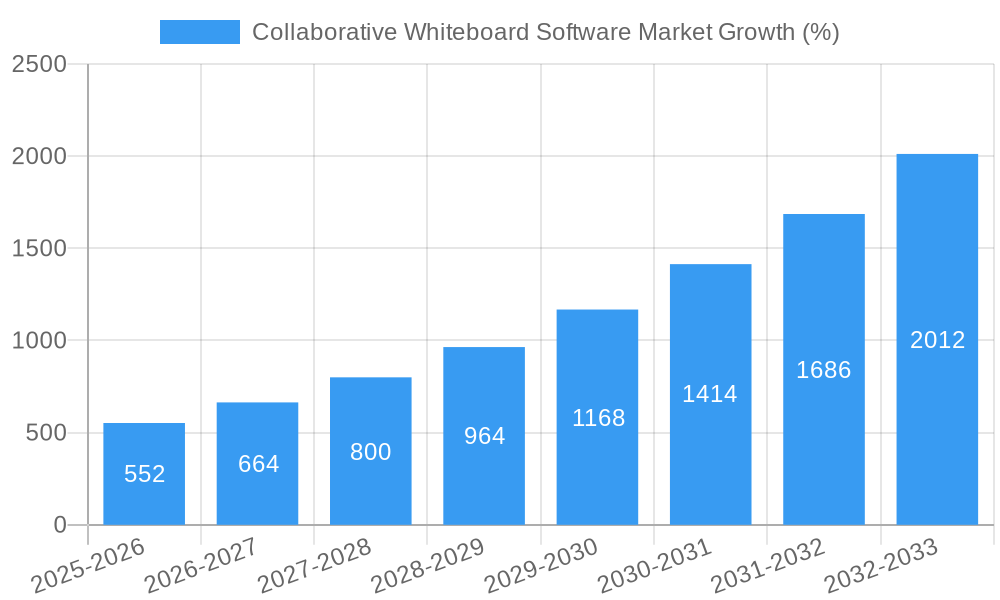
The Collaborative Whiteboard Software market is experiencing robust growth, projected to reach \$2.62 billion in 2025 and exhibiting a Compound Annual Growth Rate (CAGR) of 20.85% from 2025 to 2033. This expansion is fueled by several key drivers. The increasing adoption of remote work and hybrid work models necessitates tools for seamless team collaboration, driving demand for virtual whiteboarding solutions. Furthermore, the rising need for enhanced visual communication and real-time brainstorming in diverse industries, including BFSI (Banking, Financial Services, and Insurance), healthcare, education, and IT & telecommunications, significantly boosts market growth. Improvements in software features like integration with other productivity tools, enhanced accessibility, and advanced features like AI-powered suggestions are also contributing factors. The market is segmented by operating system (Windows & Web, iOS, Android), deployment mode (on-premise, cloud), organization size (large enterprises, SMEs), and end-user vertical. Cloud-based deployment is expected to dominate due to its scalability, cost-effectiveness, and accessibility. Large enterprises are currently the major consumers, but the SME segment is projected to witness significant growth due to increasing awareness and affordability of collaborative solutions.
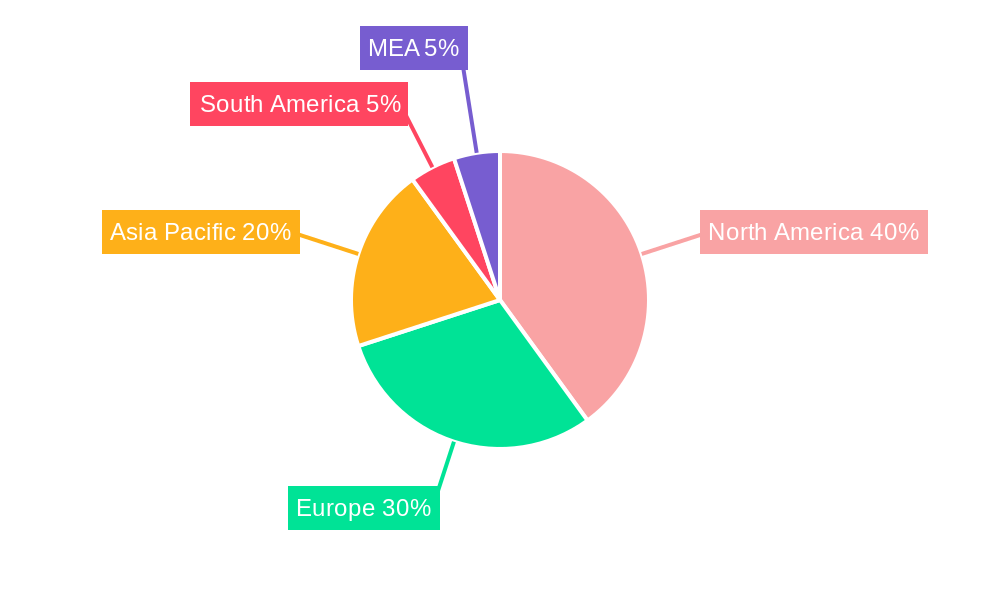
Competition in the market is intense, with established players like Microsoft, Google, and Cisco alongside specialized providers like Miro, Mural, and Figma. The competitive landscape is characterized by continuous innovation, strategic partnerships, and mergers and acquisitions. While the market faces restraints such as security concerns surrounding data privacy and the initial investment required for implementation, these challenges are being addressed through robust security measures and user-friendly interfaces, mitigating their impact on overall market growth. Geographic expansion, particularly in the Asia-Pacific region driven by its rapidly digitalizing economies, is another major growth catalyst. The North American market currently holds a significant share, reflecting high adoption rates in established markets. However, future growth is anticipated to be more pronounced in rapidly developing regions, leading to a shift in regional market share dynamics in the coming years.
Collaborative Whiteboard Software Market Report: 2019-2033
This comprehensive report provides an in-depth analysis of the Collaborative Whiteboard Software market, encompassing market dynamics, growth trends, regional segmentation, product landscape, and key players. The report covers the period from 2019 to 2033, with a focus on the forecast period of 2025-2033 and a base year of 2025. The market is segmented by operating system (Windows and Web, iOS, Android), deployment mode (on-premise, cloud), organization size (large enterprises, small and medium enterprises), and end-user vertical (BFSI, healthcare, education, IT and telecommunications, other). This report is crucial for businesses and investors looking to understand the dynamics and growth potential of this rapidly evolving market.
Collaborative Whiteboard Software Market Market Dynamics & Structure
The collaborative whiteboard software market is experiencing robust growth fueled by the increasing adoption of remote work models and the need for enhanced team collaboration. Market concentration is moderate, with several key players vying for market share. Technological innovation, particularly in areas like AI-powered features and enhanced integration with other productivity tools, is a key driver. Regulatory frameworks surrounding data privacy and security play a significant role, influencing vendor strategies. Competitive substitutes include traditional whiteboards and basic video conferencing tools, though the superior functionality and collaborative features of digital whiteboards are steadily eroding this competition. The end-user demographic is expanding across various sectors, with significant growth observed in the IT and telecommunications, education, and BFSI sectors. M&A activity has been moderate, with larger players strategically acquiring smaller companies to expand their product offerings and market reach. The market size in 2024 was estimated to be xx Million and is expected to reach xx Million by 2033.
- Market Concentration: Moderate, with a few dominant players and numerous smaller niche players. The top 5 players hold approximately xx% market share (2024).
- Technological Innovation: Focus on AI-powered features, real-time collaboration, enhanced security, and seamless integration with other tools.
- Regulatory Frameworks: Compliance with data privacy regulations (GDPR, CCPA) is crucial for vendors.
- Competitive Substitutes: Traditional whiteboards and basic video conferencing platforms.
- End-User Demographics: Significant growth across all sectors, with strong adoption in IT, education, and BFSI.
- M&A Trends: Moderate activity, with larger players strategically acquiring smaller companies to expand their product portfolio and market presence.
Collaborative Whiteboard Software Market Growth Trends & Insights
The collaborative whiteboard software market is experiencing significant growth driven by the increasing adoption of remote and hybrid work models. The market size is expanding at a Compound Annual Growth Rate (CAGR) of xx% during the forecast period (2025-2033). This growth is fueled by several factors: the rising need for efficient virtual collaboration tools, the increasing adoption of cloud-based solutions, and ongoing technological advancements that enhance user experience and functionality. The market penetration rate is increasing steadily, with a significant portion of businesses adopting digital whiteboards as a standard part of their workflow. Technological disruptions, such as the introduction of AI-powered features, are further accelerating market growth. Consumer behavior shifts towards remote collaboration and preference for user-friendly applications are contributing to the market's expansion.
- Market Size Evolution: Steady growth from xx Million in 2019 to xx Million in 2024, projected to reach xx Million by 2033.
- Adoption Rates: Increasing steadily across all sectors, driven by the shift towards remote and hybrid work.
- Technological Disruptions: AI-powered features, real-time collaboration enhancements, and improved integration with other productivity tools.
- Consumer Behavior Shifts: Increased preference for user-friendly interfaces and seamless collaboration tools.
Dominant Regions, Countries, or Segments in Collaborative Whiteboard Software Market
North America currently holds the largest market share in the collaborative whiteboard software market, driven by high technology adoption rates, a robust IT infrastructure, and a large base of enterprises. However, the Asia-Pacific region is projected to witness the fastest growth during the forecast period, fueled by the expanding IT sector, increasing internet penetration, and rising adoption of cloud-based solutions. Within segments, the cloud deployment model dominates, owing to its scalability, cost-effectiveness, and accessibility. Large enterprises are the leading adopters, given their higher budgets and need for advanced collaboration tools. The IT and telecommunications sector is a key end-user vertical, followed by the education and BFSI sectors.
- North America: High technology adoption rates, robust IT infrastructure, and large enterprise base.
- Asia-Pacific: Fastest growth potential, driven by expanding IT sector, increasing internet penetration, and cloud adoption.
- Deployment Mode: Cloud deployment is the dominant model due to scalability and cost-effectiveness.
- Organization Size: Large enterprises are the major adopters, followed by SMEs.
- End-user Verticals: IT and Telecommunications, Education, and BFSI are leading sectors.
Collaborative Whiteboard Software Market Product Landscape
The collaborative whiteboard software market offers a range of products with diverse features and functionalities. Products are characterized by their ability to support real-time collaboration, integration with other productivity tools, and provision of advanced features like screen sharing, video conferencing, and file sharing. Recent product innovations include AI-powered features, enhanced security measures, and improved user interfaces. Key performance metrics include user engagement, collaboration efficiency, and data security. Unique selling propositions often focus on ease of use, intuitive design, robust integration capabilities, and advanced features such as interactive diagrams and presentation tools.
Key Drivers, Barriers & Challenges in Collaborative Whiteboard Software Market
Key Drivers: The increasing adoption of remote work models, the growing demand for enhanced team collaboration, and the rising popularity of cloud-based solutions are major drivers. Technological advancements, such as AI integration and improved user interfaces, are also fueling market growth. Government initiatives promoting digitalization in various sectors are further contributing to the market’s expansion.
Key Challenges & Restraints: Security concerns related to data privacy and the need for robust security measures pose challenges. Integration complexities with existing IT infrastructure and the high initial investment costs for organizations can hinder adoption. Competition from established players and the emergence of new entrants creates a dynamic and competitive landscape. High dependence on reliable internet connectivity limits adoption in areas with limited infrastructure.
Emerging Opportunities in Collaborative Whiteboard Software Market
Emerging opportunities lie in untapped markets, particularly in developing economies with increasing internet penetration and a growing need for collaborative tools. The integration of augmented reality (AR) and virtual reality (VR) technologies to create immersive collaborative experiences presents a significant opportunity. The development of specialized solutions for specific industries, such as healthcare and education, also presents considerable potential for growth. Focus on providing highly customized and tailored solutions for different industry verticals may lead to increased market penetration and growth.
Growth Accelerators in the Collaborative Whiteboard Software Market Industry
Technological advancements, such as AI-powered features, real-time collaboration capabilities, and seamless integration with other productivity tools, are key growth accelerators. Strategic partnerships between collaborative whiteboard software vendors and other technology providers are also fostering market growth. Expansion into new geographic markets, particularly in developing economies, is creating significant growth opportunities. Investment in R&D to improve product features, user experience, and security is essential for maintaining a competitive edge.
Key Players Shaping the Collaborative Whiteboard Software Market Market
- Invisionapp Inc
- Trello Inc (Atlassian Corporation PLC)
- Ayoa (Opengenius Limited)
- Groupmap Technology Pty Ltd
- Figma Inc
- Stormboard
- Conceptboard
- Vizetto
- Limnu
- Collaboard
- Lucidspark
- Cisco Systems Inc
- Eztalks
- Microsoft Corporation
- Beecanvas
- Miro
- Explain Everything
- Edrawmind (Wondershare)
- Twiddla
- Ziteboard - Overview
- Bluescape
- Google Jamboard (Alphabet Inc )
- Zira Technologies Inc
- Zoom Video Communications
- Mural
Notable Milestones in Collaborative Whiteboard Software Market Sector
- Dec 2022: Apple launched Freeform, integrating it into iOS, iPadOS, and macOS, enhancing collaborative capabilities.
- Apr 2022: Launch of FreehandsOn, a tactile digital whiteboard system for hybrid and remote teams.
In-Depth Collaborative Whiteboard Software Market Market Outlook
The collaborative whiteboard software market is poised for continued robust growth, driven by ongoing technological advancements, increasing demand for seamless collaboration tools, and the expansion of remote and hybrid work models. The market presents significant opportunities for innovative vendors to develop cutting-edge solutions catering to the evolving needs of businesses and individuals across various sectors. Strategic partnerships and investments in research and development are key to capturing market share and ensuring long-term success in this dynamic market.
Collaborative Whiteboard Software Market Segmentation
-
1. Operating System
- 1.1. Windows and Web
- 1.2. iOS
- 1.3. Android
-
2. Deployment Mode
- 2.1. On-premise
- 2.2. Cloud
-
3. Organization Size
- 3.1. Large Enterprises
- 3.2. Small and Medium Enterprises
-
4. End-user Vertical
- 4.1. BFSI
- 4.2. Healthcare
- 4.3. Education
- 4.4. IT and Telecommunications
- 4.5. Other End-user Verticals
Collaborative Whiteboard Software Market Segmentation By Geography
- 1. North America
- 2. Europe
- 3. Asia Pacific
- 4. Latin America
- 5. Middle East and Africa
Collaborative Whiteboard Software Market REPORT HIGHLIGHTS
| Aspects | Details |
|---|---|
| Study Period | 2019-2033 |
| Base Year | 2024 |
| Estimated Year | 2025 |
| Forecast Period | 2025-2033 |
| Historical Period | 2019-2024 |
| Growth Rate | CAGR of 20.85% from 2019-2033 |
| Segmentation |
|
Table of Contents
- 1. Introduction
- 1.1. Research Scope
- 1.2. Market Segmentation
- 1.3. Research Methodology
- 1.4. Definitions and Assumptions
- 2. Executive Summary
- 2.1. Introduction
- 3. Market Dynamics
- 3.1. Introduction
- 3.2. Market Drivers
- 3.2.1. Increasing Remote Working and Real-time Collaboration in Organizations
- 3.3. Market Restrains
- 3.3.1. Lack of Awareness and Digital Resources in Developing Countries
- 3.4. Market Trends
- 3.4.1. Increasing Remote Working and Real-time Collaboration in Organizations
- 4. Market Factor Analysis
- 4.1. Porters Five Forces
- 4.2. Supply/Value Chain
- 4.3. PESTEL analysis
- 4.4. Market Entropy
- 4.5. Patent/Trademark Analysis
- 5. Global Collaborative Whiteboard Software Market Analysis, Insights and Forecast, 2019-2031
- 5.1. Market Analysis, Insights and Forecast - by Operating System
- 5.1.1. Windows and Web
- 5.1.2. iOS
- 5.1.3. Android
- 5.2. Market Analysis, Insights and Forecast - by Deployment Mode
- 5.2.1. On-premise
- 5.2.2. Cloud
- 5.3. Market Analysis, Insights and Forecast - by Organization Size
- 5.3.1. Large Enterprises
- 5.3.2. Small and Medium Enterprises
- 5.4. Market Analysis, Insights and Forecast - by End-user Vertical
- 5.4.1. BFSI
- 5.4.2. Healthcare
- 5.4.3. Education
- 5.4.4. IT and Telecommunications
- 5.4.5. Other End-user Verticals
- 5.5. Market Analysis, Insights and Forecast - by Region
- 5.5.1. North America
- 5.5.2. Europe
- 5.5.3. Asia Pacific
- 5.5.4. Latin America
- 5.5.5. Middle East and Africa
- 5.1. Market Analysis, Insights and Forecast - by Operating System
- 6. North America Collaborative Whiteboard Software Market Analysis, Insights and Forecast, 2019-2031
- 6.1. Market Analysis, Insights and Forecast - by Operating System
- 6.1.1. Windows and Web
- 6.1.2. iOS
- 6.1.3. Android
- 6.2. Market Analysis, Insights and Forecast - by Deployment Mode
- 6.2.1. On-premise
- 6.2.2. Cloud
- 6.3. Market Analysis, Insights and Forecast - by Organization Size
- 6.3.1. Large Enterprises
- 6.3.2. Small and Medium Enterprises
- 6.4. Market Analysis, Insights and Forecast - by End-user Vertical
- 6.4.1. BFSI
- 6.4.2. Healthcare
- 6.4.3. Education
- 6.4.4. IT and Telecommunications
- 6.4.5. Other End-user Verticals
- 6.1. Market Analysis, Insights and Forecast - by Operating System
- 7. Europe Collaborative Whiteboard Software Market Analysis, Insights and Forecast, 2019-2031
- 7.1. Market Analysis, Insights and Forecast - by Operating System
- 7.1.1. Windows and Web
- 7.1.2. iOS
- 7.1.3. Android
- 7.2. Market Analysis, Insights and Forecast - by Deployment Mode
- 7.2.1. On-premise
- 7.2.2. Cloud
- 7.3. Market Analysis, Insights and Forecast - by Organization Size
- 7.3.1. Large Enterprises
- 7.3.2. Small and Medium Enterprises
- 7.4. Market Analysis, Insights and Forecast - by End-user Vertical
- 7.4.1. BFSI
- 7.4.2. Healthcare
- 7.4.3. Education
- 7.4.4. IT and Telecommunications
- 7.4.5. Other End-user Verticals
- 7.1. Market Analysis, Insights and Forecast - by Operating System
- 8. Asia Pacific Collaborative Whiteboard Software Market Analysis, Insights and Forecast, 2019-2031
- 8.1. Market Analysis, Insights and Forecast - by Operating System
- 8.1.1. Windows and Web
- 8.1.2. iOS
- 8.1.3. Android
- 8.2. Market Analysis, Insights and Forecast - by Deployment Mode
- 8.2.1. On-premise
- 8.2.2. Cloud
- 8.3. Market Analysis, Insights and Forecast - by Organization Size
- 8.3.1. Large Enterprises
- 8.3.2. Small and Medium Enterprises
- 8.4. Market Analysis, Insights and Forecast - by End-user Vertical
- 8.4.1. BFSI
- 8.4.2. Healthcare
- 8.4.3. Education
- 8.4.4. IT and Telecommunications
- 8.4.5. Other End-user Verticals
- 8.1. Market Analysis, Insights and Forecast - by Operating System
- 9. Latin America Collaborative Whiteboard Software Market Analysis, Insights and Forecast, 2019-2031
- 9.1. Market Analysis, Insights and Forecast - by Operating System
- 9.1.1. Windows and Web
- 9.1.2. iOS
- 9.1.3. Android
- 9.2. Market Analysis, Insights and Forecast - by Deployment Mode
- 9.2.1. On-premise
- 9.2.2. Cloud
- 9.3. Market Analysis, Insights and Forecast - by Organization Size
- 9.3.1. Large Enterprises
- 9.3.2. Small and Medium Enterprises
- 9.4. Market Analysis, Insights and Forecast - by End-user Vertical
- 9.4.1. BFSI
- 9.4.2. Healthcare
- 9.4.3. Education
- 9.4.4. IT and Telecommunications
- 9.4.5. Other End-user Verticals
- 9.1. Market Analysis, Insights and Forecast - by Operating System
- 10. Middle East and Africa Collaborative Whiteboard Software Market Analysis, Insights and Forecast, 2019-2031
- 10.1. Market Analysis, Insights and Forecast - by Operating System
- 10.1.1. Windows and Web
- 10.1.2. iOS
- 10.1.3. Android
- 10.2. Market Analysis, Insights and Forecast - by Deployment Mode
- 10.2.1. On-premise
- 10.2.2. Cloud
- 10.3. Market Analysis, Insights and Forecast - by Organization Size
- 10.3.1. Large Enterprises
- 10.3.2. Small and Medium Enterprises
- 10.4. Market Analysis, Insights and Forecast - by End-user Vertical
- 10.4.1. BFSI
- 10.4.2. Healthcare
- 10.4.3. Education
- 10.4.4. IT and Telecommunications
- 10.4.5. Other End-user Verticals
- 10.1. Market Analysis, Insights and Forecast - by Operating System
- 11. North America Collaborative Whiteboard Software Market Analysis, Insights and Forecast, 2019-2031
- 11.1. Market Analysis, Insights and Forecast - By Country/Sub-region
- 11.1.1 United States
- 11.1.2 Canada
- 11.1.3 Mexico
- 12. Europe Collaborative Whiteboard Software Market Analysis, Insights and Forecast, 2019-2031
- 12.1. Market Analysis, Insights and Forecast - By Country/Sub-region
- 12.1.1 Germany
- 12.1.2 United Kingdom
- 12.1.3 France
- 12.1.4 Spain
- 12.1.5 Italy
- 12.1.6 Spain
- 12.1.7 Belgium
- 12.1.8 Netherland
- 12.1.9 Nordics
- 12.1.10 Rest of Europe
- 13. Asia Pacific Collaborative Whiteboard Software Market Analysis, Insights and Forecast, 2019-2031
- 13.1. Market Analysis, Insights and Forecast - By Country/Sub-region
- 13.1.1 China
- 13.1.2 Japan
- 13.1.3 India
- 13.1.4 South Korea
- 13.1.5 Southeast Asia
- 13.1.6 Australia
- 13.1.7 Indonesia
- 13.1.8 Phillipes
- 13.1.9 Singapore
- 13.1.10 Thailandc
- 13.1.11 Rest of Asia Pacific
- 14. South America Collaborative Whiteboard Software Market Analysis, Insights and Forecast, 2019-2031
- 14.1. Market Analysis, Insights and Forecast - By Country/Sub-region
- 14.1.1 Brazil
- 14.1.2 Argentina
- 14.1.3 Peru
- 14.1.4 Chile
- 14.1.5 Colombia
- 14.1.6 Ecuador
- 14.1.7 Venezuela
- 14.1.8 Rest of South America
- 15. North America Collaborative Whiteboard Software Market Analysis, Insights and Forecast, 2019-2031
- 15.1. Market Analysis, Insights and Forecast - By Country/Sub-region
- 15.1.1 United States
- 15.1.2 Canada
- 15.1.3 Mexico
- 16. MEA Collaborative Whiteboard Software Market Analysis, Insights and Forecast, 2019-2031
- 16.1. Market Analysis, Insights and Forecast - By Country/Sub-region
- 16.1.1 United Arab Emirates
- 16.1.2 Saudi Arabia
- 16.1.3 South Africa
- 16.1.4 Rest of Middle East and Africa
- 17. Competitive Analysis
- 17.1. Global Market Share Analysis 2024
- 17.2. Company Profiles
- 17.2.1 Invisionapp Inc
- 17.2.1.1. Overview
- 17.2.1.2. Products
- 17.2.1.3. SWOT Analysis
- 17.2.1.4. Recent Developments
- 17.2.1.5. Financials (Based on Availability)
- 17.2.2 Trello Inc (Atlassian Corporation PLC)
- 17.2.2.1. Overview
- 17.2.2.2. Products
- 17.2.2.3. SWOT Analysis
- 17.2.2.4. Recent Developments
- 17.2.2.5. Financials (Based on Availability)
- 17.2.3 Ayoa (Opengenius Limited)
- 17.2.3.1. Overview
- 17.2.3.2. Products
- 17.2.3.3. SWOT Analysis
- 17.2.3.4. Recent Developments
- 17.2.3.5. Financials (Based on Availability)
- 17.2.4 Groupmap Technology Pty Ltd
- 17.2.4.1. Overview
- 17.2.4.2. Products
- 17.2.4.3. SWOT Analysis
- 17.2.4.4. Recent Developments
- 17.2.4.5. Financials (Based on Availability)
- 17.2.5 Figma Inc
- 17.2.5.1. Overview
- 17.2.5.2. Products
- 17.2.5.3. SWOT Analysis
- 17.2.5.4. Recent Developments
- 17.2.5.5. Financials (Based on Availability)
- 17.2.6 Stormboard
- 17.2.6.1. Overview
- 17.2.6.2. Products
- 17.2.6.3. SWOT Analysis
- 17.2.6.4. Recent Developments
- 17.2.6.5. Financials (Based on Availability)
- 17.2.7 Conceptboard
- 17.2.7.1. Overview
- 17.2.7.2. Products
- 17.2.7.3. SWOT Analysis
- 17.2.7.4. Recent Developments
- 17.2.7.5. Financials (Based on Availability)
- 17.2.8 Vizetto
- 17.2.8.1. Overview
- 17.2.8.2. Products
- 17.2.8.3. SWOT Analysis
- 17.2.8.4. Recent Developments
- 17.2.8.5. Financials (Based on Availability)
- 17.2.9 Limnu
- 17.2.9.1. Overview
- 17.2.9.2. Products
- 17.2.9.3. SWOT Analysis
- 17.2.9.4. Recent Developments
- 17.2.9.5. Financials (Based on Availability)
- 17.2.10 Collaboard
- 17.2.10.1. Overview
- 17.2.10.2. Products
- 17.2.10.3. SWOT Analysis
- 17.2.10.4. Recent Developments
- 17.2.10.5. Financials (Based on Availability)
- 17.2.11 Lucidspark
- 17.2.11.1. Overview
- 17.2.11.2. Products
- 17.2.11.3. SWOT Analysis
- 17.2.11.4. Recent Developments
- 17.2.11.5. Financials (Based on Availability)
- 17.2.12 Cisco Systems Inc
- 17.2.12.1. Overview
- 17.2.12.2. Products
- 17.2.12.3. SWOT Analysis
- 17.2.12.4. Recent Developments
- 17.2.12.5. Financials (Based on Availability)
- 17.2.13 Eztalks
- 17.2.13.1. Overview
- 17.2.13.2. Products
- 17.2.13.3. SWOT Analysis
- 17.2.13.4. Recent Developments
- 17.2.13.5. Financials (Based on Availability)
- 17.2.14 Microsoft Corporation
- 17.2.14.1. Overview
- 17.2.14.2. Products
- 17.2.14.3. SWOT Analysis
- 17.2.14.4. Recent Developments
- 17.2.14.5. Financials (Based on Availability)
- 17.2.15 Beecanvas
- 17.2.15.1. Overview
- 17.2.15.2. Products
- 17.2.15.3. SWOT Analysis
- 17.2.15.4. Recent Developments
- 17.2.15.5. Financials (Based on Availability)
- 17.2.16 Miro
- 17.2.16.1. Overview
- 17.2.16.2. Products
- 17.2.16.3. SWOT Analysis
- 17.2.16.4. Recent Developments
- 17.2.16.5. Financials (Based on Availability)
- 17.2.17 Explain Everything
- 17.2.17.1. Overview
- 17.2.17.2. Products
- 17.2.17.3. SWOT Analysis
- 17.2.17.4. Recent Developments
- 17.2.17.5. Financials (Based on Availability)
- 17.2.18 Edrawmind (Wondershare)
- 17.2.18.1. Overview
- 17.2.18.2. Products
- 17.2.18.3. SWOT Analysis
- 17.2.18.4. Recent Developments
- 17.2.18.5. Financials (Based on Availability)
- 17.2.19 Twiddla
- 17.2.19.1. Overview
- 17.2.19.2. Products
- 17.2.19.3. SWOT Analysis
- 17.2.19.4. Recent Developments
- 17.2.19.5. Financials (Based on Availability)
- 17.2.20 Ziteboard - Overview
- 17.2.20.1. Overview
- 17.2.20.2. Products
- 17.2.20.3. SWOT Analysis
- 17.2.20.4. Recent Developments
- 17.2.20.5. Financials (Based on Availability)
- 17.2.21 Bluescape
- 17.2.21.1. Overview
- 17.2.21.2. Products
- 17.2.21.3. SWOT Analysis
- 17.2.21.4. Recent Developments
- 17.2.21.5. Financials (Based on Availability)
- 17.2.22 Google Jamboard (Alphabet Inc )
- 17.2.22.1. Overview
- 17.2.22.2. Products
- 17.2.22.3. SWOT Analysis
- 17.2.22.4. Recent Developments
- 17.2.22.5. Financials (Based on Availability)
- 17.2.23 Zira Technologies Inc
- 17.2.23.1. Overview
- 17.2.23.2. Products
- 17.2.23.3. SWOT Analysis
- 17.2.23.4. Recent Developments
- 17.2.23.5. Financials (Based on Availability)
- 17.2.24 Zoom Video Communications
- 17.2.24.1. Overview
- 17.2.24.2. Products
- 17.2.24.3. SWOT Analysis
- 17.2.24.4. Recent Developments
- 17.2.24.5. Financials (Based on Availability)
- 17.2.25 Mural
- 17.2.25.1. Overview
- 17.2.25.2. Products
- 17.2.25.3. SWOT Analysis
- 17.2.25.4. Recent Developments
- 17.2.25.5. Financials (Based on Availability)
- 17.2.1 Invisionapp Inc
List of Figures
- Figure 1: Global Collaborative Whiteboard Software Market Revenue Breakdown (Million, %) by Region 2024 & 2032
- Figure 2: North America Collaborative Whiteboard Software Market Revenue (Million), by Country 2024 & 2032
- Figure 3: North America Collaborative Whiteboard Software Market Revenue Share (%), by Country 2024 & 2032
- Figure 4: Europe Collaborative Whiteboard Software Market Revenue (Million), by Country 2024 & 2032
- Figure 5: Europe Collaborative Whiteboard Software Market Revenue Share (%), by Country 2024 & 2032
- Figure 6: Asia Pacific Collaborative Whiteboard Software Market Revenue (Million), by Country 2024 & 2032
- Figure 7: Asia Pacific Collaborative Whiteboard Software Market Revenue Share (%), by Country 2024 & 2032
- Figure 8: South America Collaborative Whiteboard Software Market Revenue (Million), by Country 2024 & 2032
- Figure 9: South America Collaborative Whiteboard Software Market Revenue Share (%), by Country 2024 & 2032
- Figure 10: North America Collaborative Whiteboard Software Market Revenue (Million), by Country 2024 & 2032
- Figure 11: North America Collaborative Whiteboard Software Market Revenue Share (%), by Country 2024 & 2032
- Figure 12: MEA Collaborative Whiteboard Software Market Revenue (Million), by Country 2024 & 2032
- Figure 13: MEA Collaborative Whiteboard Software Market Revenue Share (%), by Country 2024 & 2032
- Figure 14: North America Collaborative Whiteboard Software Market Revenue (Million), by Operating System 2024 & 2032
- Figure 15: North America Collaborative Whiteboard Software Market Revenue Share (%), by Operating System 2024 & 2032
- Figure 16: North America Collaborative Whiteboard Software Market Revenue (Million), by Deployment Mode 2024 & 2032
- Figure 17: North America Collaborative Whiteboard Software Market Revenue Share (%), by Deployment Mode 2024 & 2032
- Figure 18: North America Collaborative Whiteboard Software Market Revenue (Million), by Organization Size 2024 & 2032
- Figure 19: North America Collaborative Whiteboard Software Market Revenue Share (%), by Organization Size 2024 & 2032
- Figure 20: North America Collaborative Whiteboard Software Market Revenue (Million), by End-user Vertical 2024 & 2032
- Figure 21: North America Collaborative Whiteboard Software Market Revenue Share (%), by End-user Vertical 2024 & 2032
- Figure 22: North America Collaborative Whiteboard Software Market Revenue (Million), by Country 2024 & 2032
- Figure 23: North America Collaborative Whiteboard Software Market Revenue Share (%), by Country 2024 & 2032
- Figure 24: Europe Collaborative Whiteboard Software Market Revenue (Million), by Operating System 2024 & 2032
- Figure 25: Europe Collaborative Whiteboard Software Market Revenue Share (%), by Operating System 2024 & 2032
- Figure 26: Europe Collaborative Whiteboard Software Market Revenue (Million), by Deployment Mode 2024 & 2032
- Figure 27: Europe Collaborative Whiteboard Software Market Revenue Share (%), by Deployment Mode 2024 & 2032
- Figure 28: Europe Collaborative Whiteboard Software Market Revenue (Million), by Organization Size 2024 & 2032
- Figure 29: Europe Collaborative Whiteboard Software Market Revenue Share (%), by Organization Size 2024 & 2032
- Figure 30: Europe Collaborative Whiteboard Software Market Revenue (Million), by End-user Vertical 2024 & 2032
- Figure 31: Europe Collaborative Whiteboard Software Market Revenue Share (%), by End-user Vertical 2024 & 2032
- Figure 32: Europe Collaborative Whiteboard Software Market Revenue (Million), by Country 2024 & 2032
- Figure 33: Europe Collaborative Whiteboard Software Market Revenue Share (%), by Country 2024 & 2032
- Figure 34: Asia Pacific Collaborative Whiteboard Software Market Revenue (Million), by Operating System 2024 & 2032
- Figure 35: Asia Pacific Collaborative Whiteboard Software Market Revenue Share (%), by Operating System 2024 & 2032
- Figure 36: Asia Pacific Collaborative Whiteboard Software Market Revenue (Million), by Deployment Mode 2024 & 2032
- Figure 37: Asia Pacific Collaborative Whiteboard Software Market Revenue Share (%), by Deployment Mode 2024 & 2032
- Figure 38: Asia Pacific Collaborative Whiteboard Software Market Revenue (Million), by Organization Size 2024 & 2032
- Figure 39: Asia Pacific Collaborative Whiteboard Software Market Revenue Share (%), by Organization Size 2024 & 2032
- Figure 40: Asia Pacific Collaborative Whiteboard Software Market Revenue (Million), by End-user Vertical 2024 & 2032
- Figure 41: Asia Pacific Collaborative Whiteboard Software Market Revenue Share (%), by End-user Vertical 2024 & 2032
- Figure 42: Asia Pacific Collaborative Whiteboard Software Market Revenue (Million), by Country 2024 & 2032
- Figure 43: Asia Pacific Collaborative Whiteboard Software Market Revenue Share (%), by Country 2024 & 2032
- Figure 44: Latin America Collaborative Whiteboard Software Market Revenue (Million), by Operating System 2024 & 2032
- Figure 45: Latin America Collaborative Whiteboard Software Market Revenue Share (%), by Operating System 2024 & 2032
- Figure 46: Latin America Collaborative Whiteboard Software Market Revenue (Million), by Deployment Mode 2024 & 2032
- Figure 47: Latin America Collaborative Whiteboard Software Market Revenue Share (%), by Deployment Mode 2024 & 2032
- Figure 48: Latin America Collaborative Whiteboard Software Market Revenue (Million), by Organization Size 2024 & 2032
- Figure 49: Latin America Collaborative Whiteboard Software Market Revenue Share (%), by Organization Size 2024 & 2032
- Figure 50: Latin America Collaborative Whiteboard Software Market Revenue (Million), by End-user Vertical 2024 & 2032
- Figure 51: Latin America Collaborative Whiteboard Software Market Revenue Share (%), by End-user Vertical 2024 & 2032
- Figure 52: Latin America Collaborative Whiteboard Software Market Revenue (Million), by Country 2024 & 2032
- Figure 53: Latin America Collaborative Whiteboard Software Market Revenue Share (%), by Country 2024 & 2032
- Figure 54: Middle East and Africa Collaborative Whiteboard Software Market Revenue (Million), by Operating System 2024 & 2032
- Figure 55: Middle East and Africa Collaborative Whiteboard Software Market Revenue Share (%), by Operating System 2024 & 2032
- Figure 56: Middle East and Africa Collaborative Whiteboard Software Market Revenue (Million), by Deployment Mode 2024 & 2032
- Figure 57: Middle East and Africa Collaborative Whiteboard Software Market Revenue Share (%), by Deployment Mode 2024 & 2032
- Figure 58: Middle East and Africa Collaborative Whiteboard Software Market Revenue (Million), by Organization Size 2024 & 2032
- Figure 59: Middle East and Africa Collaborative Whiteboard Software Market Revenue Share (%), by Organization Size 2024 & 2032
- Figure 60: Middle East and Africa Collaborative Whiteboard Software Market Revenue (Million), by End-user Vertical 2024 & 2032
- Figure 61: Middle East and Africa Collaborative Whiteboard Software Market Revenue Share (%), by End-user Vertical 2024 & 2032
- Figure 62: Middle East and Africa Collaborative Whiteboard Software Market Revenue (Million), by Country 2024 & 2032
- Figure 63: Middle East and Africa Collaborative Whiteboard Software Market Revenue Share (%), by Country 2024 & 2032
List of Tables
- Table 1: Global Collaborative Whiteboard Software Market Revenue Million Forecast, by Region 2019 & 2032
- Table 2: Global Collaborative Whiteboard Software Market Revenue Million Forecast, by Operating System 2019 & 2032
- Table 3: Global Collaborative Whiteboard Software Market Revenue Million Forecast, by Deployment Mode 2019 & 2032
- Table 4: Global Collaborative Whiteboard Software Market Revenue Million Forecast, by Organization Size 2019 & 2032
- Table 5: Global Collaborative Whiteboard Software Market Revenue Million Forecast, by End-user Vertical 2019 & 2032
- Table 6: Global Collaborative Whiteboard Software Market Revenue Million Forecast, by Region 2019 & 2032
- Table 7: Global Collaborative Whiteboard Software Market Revenue Million Forecast, by Country 2019 & 2032
- Table 8: United States Collaborative Whiteboard Software Market Revenue (Million) Forecast, by Application 2019 & 2032
- Table 9: Canada Collaborative Whiteboard Software Market Revenue (Million) Forecast, by Application 2019 & 2032
- Table 10: Mexico Collaborative Whiteboard Software Market Revenue (Million) Forecast, by Application 2019 & 2032
- Table 11: Global Collaborative Whiteboard Software Market Revenue Million Forecast, by Country 2019 & 2032
- Table 12: Germany Collaborative Whiteboard Software Market Revenue (Million) Forecast, by Application 2019 & 2032
- Table 13: United Kingdom Collaborative Whiteboard Software Market Revenue (Million) Forecast, by Application 2019 & 2032
- Table 14: France Collaborative Whiteboard Software Market Revenue (Million) Forecast, by Application 2019 & 2032
- Table 15: Spain Collaborative Whiteboard Software Market Revenue (Million) Forecast, by Application 2019 & 2032
- Table 16: Italy Collaborative Whiteboard Software Market Revenue (Million) Forecast, by Application 2019 & 2032
- Table 17: Spain Collaborative Whiteboard Software Market Revenue (Million) Forecast, by Application 2019 & 2032
- Table 18: Belgium Collaborative Whiteboard Software Market Revenue (Million) Forecast, by Application 2019 & 2032
- Table 19: Netherland Collaborative Whiteboard Software Market Revenue (Million) Forecast, by Application 2019 & 2032
- Table 20: Nordics Collaborative Whiteboard Software Market Revenue (Million) Forecast, by Application 2019 & 2032
- Table 21: Rest of Europe Collaborative Whiteboard Software Market Revenue (Million) Forecast, by Application 2019 & 2032
- Table 22: Global Collaborative Whiteboard Software Market Revenue Million Forecast, by Country 2019 & 2032
- Table 23: China Collaborative Whiteboard Software Market Revenue (Million) Forecast, by Application 2019 & 2032
- Table 24: Japan Collaborative Whiteboard Software Market Revenue (Million) Forecast, by Application 2019 & 2032
- Table 25: India Collaborative Whiteboard Software Market Revenue (Million) Forecast, by Application 2019 & 2032
- Table 26: South Korea Collaborative Whiteboard Software Market Revenue (Million) Forecast, by Application 2019 & 2032
- Table 27: Southeast Asia Collaborative Whiteboard Software Market Revenue (Million) Forecast, by Application 2019 & 2032
- Table 28: Australia Collaborative Whiteboard Software Market Revenue (Million) Forecast, by Application 2019 & 2032
- Table 29: Indonesia Collaborative Whiteboard Software Market Revenue (Million) Forecast, by Application 2019 & 2032
- Table 30: Phillipes Collaborative Whiteboard Software Market Revenue (Million) Forecast, by Application 2019 & 2032
- Table 31: Singapore Collaborative Whiteboard Software Market Revenue (Million) Forecast, by Application 2019 & 2032
- Table 32: Thailandc Collaborative Whiteboard Software Market Revenue (Million) Forecast, by Application 2019 & 2032
- Table 33: Rest of Asia Pacific Collaborative Whiteboard Software Market Revenue (Million) Forecast, by Application 2019 & 2032
- Table 34: Global Collaborative Whiteboard Software Market Revenue Million Forecast, by Country 2019 & 2032
- Table 35: Brazil Collaborative Whiteboard Software Market Revenue (Million) Forecast, by Application 2019 & 2032
- Table 36: Argentina Collaborative Whiteboard Software Market Revenue (Million) Forecast, by Application 2019 & 2032
- Table 37: Peru Collaborative Whiteboard Software Market Revenue (Million) Forecast, by Application 2019 & 2032
- Table 38: Chile Collaborative Whiteboard Software Market Revenue (Million) Forecast, by Application 2019 & 2032
- Table 39: Colombia Collaborative Whiteboard Software Market Revenue (Million) Forecast, by Application 2019 & 2032
- Table 40: Ecuador Collaborative Whiteboard Software Market Revenue (Million) Forecast, by Application 2019 & 2032
- Table 41: Venezuela Collaborative Whiteboard Software Market Revenue (Million) Forecast, by Application 2019 & 2032
- Table 42: Rest of South America Collaborative Whiteboard Software Market Revenue (Million) Forecast, by Application 2019 & 2032
- Table 43: Global Collaborative Whiteboard Software Market Revenue Million Forecast, by Country 2019 & 2032
- Table 44: United States Collaborative Whiteboard Software Market Revenue (Million) Forecast, by Application 2019 & 2032
- Table 45: Canada Collaborative Whiteboard Software Market Revenue (Million) Forecast, by Application 2019 & 2032
- Table 46: Mexico Collaborative Whiteboard Software Market Revenue (Million) Forecast, by Application 2019 & 2032
- Table 47: Global Collaborative Whiteboard Software Market Revenue Million Forecast, by Country 2019 & 2032
- Table 48: United Arab Emirates Collaborative Whiteboard Software Market Revenue (Million) Forecast, by Application 2019 & 2032
- Table 49: Saudi Arabia Collaborative Whiteboard Software Market Revenue (Million) Forecast, by Application 2019 & 2032
- Table 50: South Africa Collaborative Whiteboard Software Market Revenue (Million) Forecast, by Application 2019 & 2032
- Table 51: Rest of Middle East and Africa Collaborative Whiteboard Software Market Revenue (Million) Forecast, by Application 2019 & 2032
- Table 52: Global Collaborative Whiteboard Software Market Revenue Million Forecast, by Operating System 2019 & 2032
- Table 53: Global Collaborative Whiteboard Software Market Revenue Million Forecast, by Deployment Mode 2019 & 2032
- Table 54: Global Collaborative Whiteboard Software Market Revenue Million Forecast, by Organization Size 2019 & 2032
- Table 55: Global Collaborative Whiteboard Software Market Revenue Million Forecast, by End-user Vertical 2019 & 2032
- Table 56: Global Collaborative Whiteboard Software Market Revenue Million Forecast, by Country 2019 & 2032
- Table 57: Global Collaborative Whiteboard Software Market Revenue Million Forecast, by Operating System 2019 & 2032
- Table 58: Global Collaborative Whiteboard Software Market Revenue Million Forecast, by Deployment Mode 2019 & 2032
- Table 59: Global Collaborative Whiteboard Software Market Revenue Million Forecast, by Organization Size 2019 & 2032
- Table 60: Global Collaborative Whiteboard Software Market Revenue Million Forecast, by End-user Vertical 2019 & 2032
- Table 61: Global Collaborative Whiteboard Software Market Revenue Million Forecast, by Country 2019 & 2032
- Table 62: Global Collaborative Whiteboard Software Market Revenue Million Forecast, by Operating System 2019 & 2032
- Table 63: Global Collaborative Whiteboard Software Market Revenue Million Forecast, by Deployment Mode 2019 & 2032
- Table 64: Global Collaborative Whiteboard Software Market Revenue Million Forecast, by Organization Size 2019 & 2032
- Table 65: Global Collaborative Whiteboard Software Market Revenue Million Forecast, by End-user Vertical 2019 & 2032
- Table 66: Global Collaborative Whiteboard Software Market Revenue Million Forecast, by Country 2019 & 2032
- Table 67: Global Collaborative Whiteboard Software Market Revenue Million Forecast, by Operating System 2019 & 2032
- Table 68: Global Collaborative Whiteboard Software Market Revenue Million Forecast, by Deployment Mode 2019 & 2032
- Table 69: Global Collaborative Whiteboard Software Market Revenue Million Forecast, by Organization Size 2019 & 2032
- Table 70: Global Collaborative Whiteboard Software Market Revenue Million Forecast, by End-user Vertical 2019 & 2032
- Table 71: Global Collaborative Whiteboard Software Market Revenue Million Forecast, by Country 2019 & 2032
- Table 72: Global Collaborative Whiteboard Software Market Revenue Million Forecast, by Operating System 2019 & 2032
- Table 73: Global Collaborative Whiteboard Software Market Revenue Million Forecast, by Deployment Mode 2019 & 2032
- Table 74: Global Collaborative Whiteboard Software Market Revenue Million Forecast, by Organization Size 2019 & 2032
- Table 75: Global Collaborative Whiteboard Software Market Revenue Million Forecast, by End-user Vertical 2019 & 2032
- Table 76: Global Collaborative Whiteboard Software Market Revenue Million Forecast, by Country 2019 & 2032
Frequently Asked Questions
1. What is the projected Compound Annual Growth Rate (CAGR) of the Collaborative Whiteboard Software Market?
The projected CAGR is approximately 20.85%.
2. Which companies are prominent players in the Collaborative Whiteboard Software Market?
Key companies in the market include Invisionapp Inc, Trello Inc (Atlassian Corporation PLC), Ayoa (Opengenius Limited), Groupmap Technology Pty Ltd, Figma Inc, Stormboard, Conceptboard, Vizetto, Limnu, Collaboard, Lucidspark, Cisco Systems Inc, Eztalks, Microsoft Corporation, Beecanvas, Miro, Explain Everything, Edrawmind (Wondershare), Twiddla, Ziteboard - Overview, Bluescape, Google Jamboard (Alphabet Inc ), Zira Technologies Inc, Zoom Video Communications, Mural.
3. What are the main segments of the Collaborative Whiteboard Software Market?
The market segments include Operating System, Deployment Mode, Organization Size, End-user Vertical.
4. Can you provide details about the market size?
The market size is estimated to be USD 2.62 Million as of 2022.
5. What are some drivers contributing to market growth?
Increasing Remote Working and Real-time Collaboration in Organizations.
6. What are the notable trends driving market growth?
Increasing Remote Working and Real-time Collaboration in Organizations.
7. Are there any restraints impacting market growth?
Lack of Awareness and Digital Resources in Developing Countries.
8. Can you provide examples of recent developments in the market?
Dec 2022: Apple announced that the company launched Freeform, which includes the latest versions of iOS, iPadOS, and macOS. Users of Freeform may see, share, and discuss in one location without worrying about layouts or page widths by organizing and aesthetically organizing material on a flexible canvas.
9. What pricing options are available for accessing the report?
Pricing options include single-user, multi-user, and enterprise licenses priced at USD 4750, USD 5250, and USD 8750 respectively.
10. Is the market size provided in terms of value or volume?
The market size is provided in terms of value, measured in Million.
11. Are there any specific market keywords associated with the report?
Yes, the market keyword associated with the report is "Collaborative Whiteboard Software Market," which aids in identifying and referencing the specific market segment covered.
12. How do I determine which pricing option suits my needs best?
The pricing options vary based on user requirements and access needs. Individual users may opt for single-user licenses, while businesses requiring broader access may choose multi-user or enterprise licenses for cost-effective access to the report.
13. Are there any additional resources or data provided in the Collaborative Whiteboard Software Market report?
While the report offers comprehensive insights, it's advisable to review the specific contents or supplementary materials provided to ascertain if additional resources or data are available.
14. How can I stay updated on further developments or reports in the Collaborative Whiteboard Software Market?
To stay informed about further developments, trends, and reports in the Collaborative Whiteboard Software Market, consider subscribing to industry newsletters, following relevant companies and organizations, or regularly checking reputable industry news sources and publications.
Methodology
Step 1 - Identification of Relevant Samples Size from Population Database


Step 2 - Approaches for Defining Global Market Size (Value, Volume* & Price*)

Note*: In applicable scenarios
Step 3 - Data Sources
Primary Research
- Web Analytics
- Survey Reports
- Research Institute
- Latest Research Reports
- Opinion Leaders
Secondary Research
- Annual Reports
- White Paper
- Latest Press Release
- Industry Association
- Paid Database
- Investor Presentations

Step 4 - Data Triangulation
Involves using different sources of information in order to increase the validity of a study
These sources are likely to be stakeholders in a program - participants, other researchers, program staff, other community members, and so on.
Then we put all data in single framework & apply various statistical tools to find out the dynamic on the market.
During the analysis stage, feedback from the stakeholder groups would be compared to determine areas of agreement as well as areas of divergence


