
Key Insights
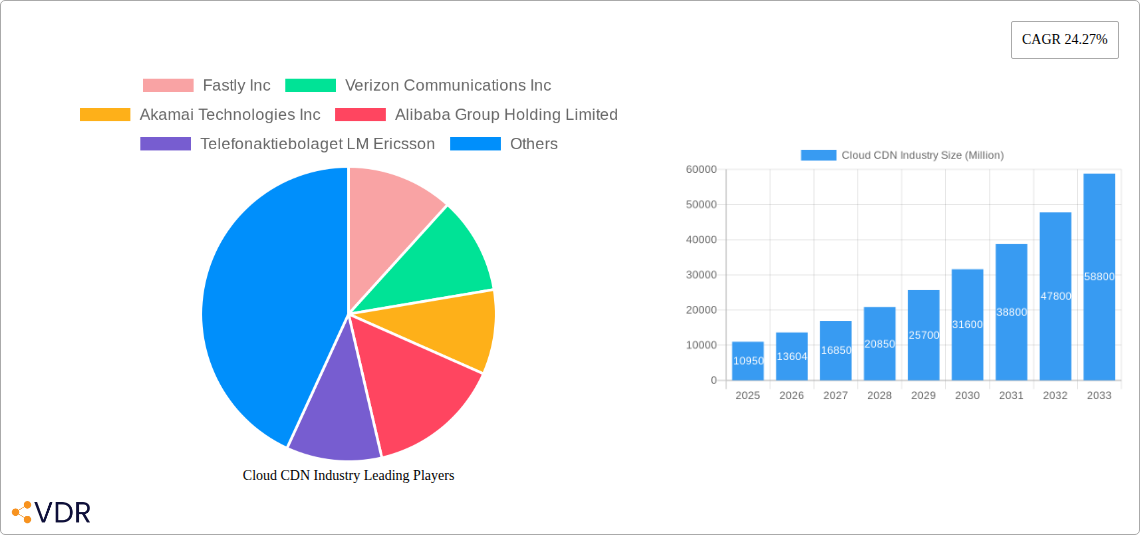
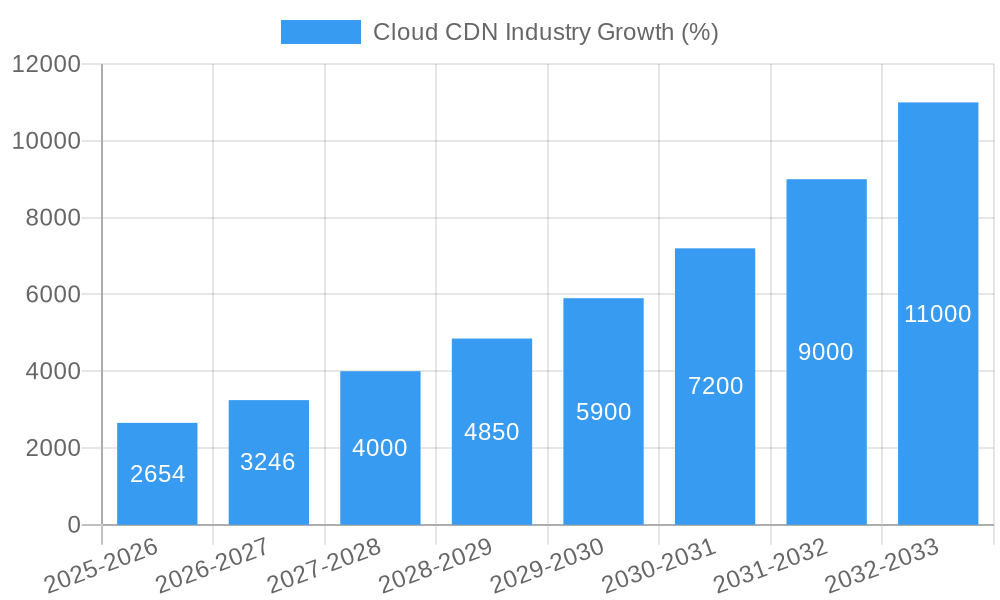
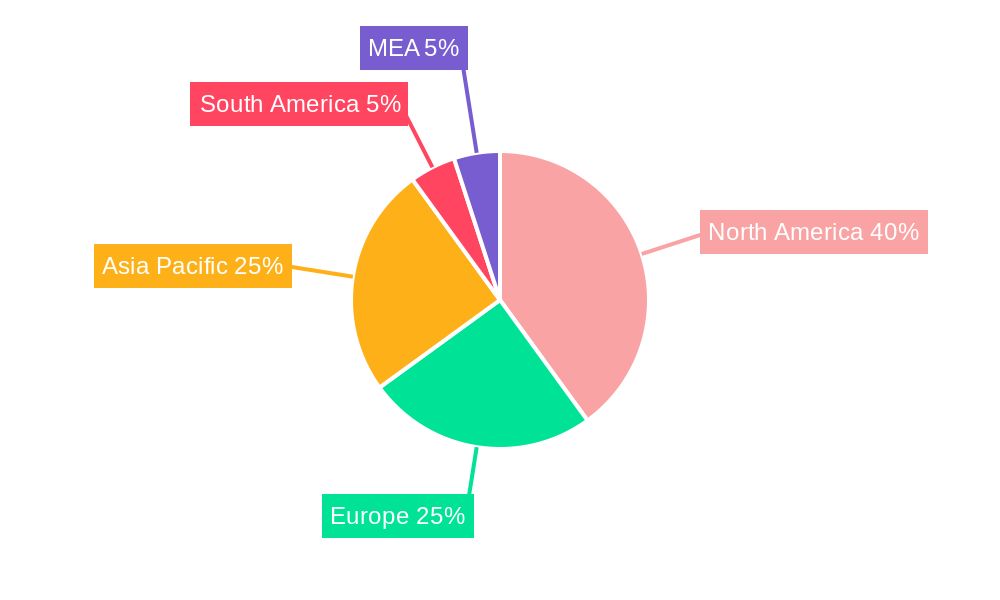
The Cloud CDN (Content Delivery Network) market is experiencing robust growth, projected to reach $10.95 billion in 2025 and exhibiting a Compound Annual Growth Rate (CAGR) of 24.27% from 2025 to 2033. This expansion is fueled by several key drivers. The increasing adoption of cloud computing and the surge in online video streaming and e-commerce are significantly boosting demand for efficient content delivery solutions. Businesses are increasingly relying on Cloud CDNs to enhance website performance, improve user experience, and reduce latency, particularly in geographically dispersed markets. Furthermore, the rise of 5G networks and the expanding Internet of Things (IoT) ecosystem are creating new opportunities for Cloud CDN providers. The market is segmented by solutions (Media Delivery, Cloud Security, Web Performance), deployment models (Public, Private, Hybrid Cloud), and end-user industries (Media & Entertainment, E-commerce, IT & Telecom, Others). North America currently holds a significant market share due to early adoption and the presence of major technology companies. However, rapid growth is anticipated in Asia-Pacific, driven by increasing internet penetration and digital transformation initiatives in developing economies.
Competitive dynamics within the Cloud CDN market are intense, with established players like Akamai, Fastly, and Amazon Web Services facing competition from emerging cloud providers and specialized CDN services. Differentiation strategies focus on advanced features like edge computing capabilities, enhanced security protocols, and tailored solutions for specific industries. The ongoing evolution of technological advancements like AI-powered optimization and improved network infrastructure will continue shaping the market landscape. While potential restraints such as data privacy concerns and security breaches exist, the overall market outlook remains positive, driven by the long-term growth trajectory of cloud computing and the expanding digital economy. The market is expected to maintain its high growth trajectory, exceeding $100 billion by 2033, driven by increased reliance on cloud infrastructure, advancements in edge computing, and the growing demand for faster and more reliable content delivery globally.
Cloud CDN Industry Market Report: 2019-2033
This comprehensive report provides a detailed analysis of the Cloud CDN industry, encompassing market dynamics, growth trends, regional dominance, product landscape, challenges, opportunities, and key players. The study period covers 2019-2033, with 2025 as the base and estimated year. The report projects a market value of xx Million by 2033, showcasing substantial growth potential for investors and industry professionals.
Keywords: Cloud CDN, Content Delivery Network, Edge Computing, Cloud Security, Media Delivery, Web Performance, Public Cloud, Private Cloud, Hybrid Cloud, Akamai Technologies, Amazon Web Services, Cloudflare, Fastly, Verizon, Alibaba, Market Size, Market Share, Growth Rate, CAGR, Market Analysis, Industry Trends, Competitive Landscape.
Cloud CDN Industry Market Dynamics & Structure
The Cloud CDN market is characterized by a moderately concentrated landscape with several major players holding significant market share. Technological innovation, particularly in edge computing and AI-driven optimization, is a key driver. Regulatory frameworks concerning data privacy and security significantly influence market operations. Competitive substitutes include traditional CDNs and internal content delivery solutions. The end-user demographic spans diverse sectors, with significant growth anticipated from media & entertainment and e-commerce. M&A activity has been moderate, with a total of xx deals recorded between 2019 and 2024 (estimated value of xx Million).
- Market Concentration: Highly concentrated, with top 5 players holding approximately 60% market share (estimated).
- Technological Innovation: Edge computing, AI-powered optimization, and improved security protocols drive market evolution.
- Regulatory Frameworks: GDPR, CCPA, and other data privacy regulations influence market strategies.
- Competitive Substitutes: Traditional CDNs and internal content delivery systems offer alternative solutions.
- End-User Demographics: Media & Entertainment, E-commerce, IT & Telecom, and other industries are key segments.
- M&A Trends: Moderate activity with an estimated xx deals (xx Million in value) between 2019-2024, indicating consolidation.
Cloud CDN Industry Growth Trends & Insights
The Cloud CDN market exhibits robust growth, driven by increasing internet penetration, the rise of video streaming, and the adoption of cloud-based applications. The market size expanded from xx Million in 2019 to xx Million in 2024, registering a CAGR of xx%. This growth is projected to continue, with a forecasted CAGR of xx% from 2025 to 2033, reaching xx Million by 2033. Technological disruptions, such as the increasing adoption of 5G and edge computing, fuel this expansion. Consumer behavior shifts, like a preference for high-quality streaming and faster website loading speeds, further augment demand. Market penetration across various end-user industries remains relatively low, indicating significant growth potential.
Dominant Regions, Countries, or Segments in Cloud CDN Industry
North America currently dominates the Cloud CDN market, driven by strong technological infrastructure and high adoption rates among major businesses. The region holds an estimated market share of xx% in 2025. Europe and Asia-Pacific are also key regions exhibiting significant growth potential.
Solutions & Services: Media Delivery is the largest segment, followed by Cloud Security and Web Performance. Growth is propelled by increasing demand for high-quality streaming and secure content delivery.
Deployment: Public cloud deployments currently dominate, driven by cost-effectiveness and scalability. However, hybrid and private cloud deployments are gaining traction driven by security and compliance concerns.
End-User Industry: Media & Entertainment and E-commerce are the leading segments, propelled by rising demand for high-quality video streaming and faster e-commerce experiences.
Key Drivers: Robust technological infrastructure, high internet penetration, increasing demand for streaming content and faster website loading speeds.
Cloud CDN Industry Product Landscape
The Cloud CDN market offers a diverse range of solutions, including content caching, load balancing, security features (DDoS mitigation, SSL/TLS encryption), and real-time analytics. Innovations focus on edge computing capabilities, AI-driven optimization, and enhanced security features. Key performance metrics include latency, uptime, bandwidth utilization, and security breach prevention. Unique selling propositions often center on superior performance, security features, and seamless integration with existing cloud platforms.
Key Drivers, Barriers & Challenges in Cloud CDN Industry
Key Drivers:
- Increased demand for high-quality streaming and faster content delivery.
- Growing adoption of cloud-based applications and services.
- Rising internet penetration and mobile usage.
- Advancement in 5G technology and edge computing.
Challenges & Restraints:
- High initial investment costs can be a barrier to entry for some businesses.
- Maintaining high levels of security and managing data privacy concerns.
- Competition from existing and emerging players creates price pressure.
- Interoperability issues and integration complexities can limit adoption.
Emerging Opportunities in Cloud CDN Industry
The burgeoning adoption of 5G technology and edge computing presents substantial opportunities. Expansion into untapped markets, like the developing economies, also presents significant growth potential. The rise of IoT devices will necessitate customized CDN solutions for efficient content distribution. Development of tailored solutions for specific industry needs, like industrial IoT, provides additional opportunities.
Growth Accelerators in the Cloud CDN Industry
Strategic partnerships between CDN providers and cloud platforms drive adoption and market expansion. Technological advancements in edge computing, AI, and machine learning enhance CDN performance and efficiency. Market expansion into new geographical regions, particularly developing economies with rising internet penetration, represents a key growth catalyst.
Key Players Shaping the Cloud CDN Industry Market
- Fastly Inc
- Verizon Communications Inc
- Akamai Technologies Inc
- Alibaba Group Holding Limited
- Telefonaktiebolaget LM Ericsson
- Limelight Networks
- Amazon Web Services Inc
- Internap Corporation
- Cloudflare Inc
- Google Inc
Notable Milestones in Cloud CDN Industry Sector
- February 2023: Akamai Technologies Inc. unveils Akamai Connected Cloud, a massively distributed edge and cloud platform.
- September 2022: Microsoft introduces a private enterprise-grade Content Delivery Network (CDN) solution.
In-Depth Cloud CDN Industry Market Outlook
The Cloud CDN market is poised for sustained growth, driven by technological advancements, increasing demand, and expanding market penetration. Strategic partnerships, acquisitions, and innovative product offerings will further fuel market expansion. The focus on enhanced security, improved performance, and customized solutions will shape future competition. The integration of AI and machine learning will optimize content delivery, creating new avenues for growth.
Cloud CDN Industry Segmentation
-
1. Solutions & Services
- 1.1. Media Delivery
- 1.2. Cloud Security
- 1.3. Web Performance
-
2. Deployment
- 2.1. Public Cloud
- 2.2. Private Cloud
- 2.3. Hybrid Cloud
-
3. End-user Industry
- 3.1. Media & Entertainment
- 3.2. E-Commerce
- 3.3. IT and Telecom
- 3.4. Other End-user Industries
Cloud CDN Industry Segmentation By Geography
-
1. North America
- 1.1. United States
- 1.2. Canada
-
2. Europe
- 2.1. United Kingdom
- 2.2. Germany
- 2.3. France
- 2.4. Rest of Europe
-
3. Asia Pacific
- 3.1. China
- 3.2. Japan
- 3.3. South Korea
- 3.4. Rest of Asia Pacific
- 4. Latin America
- 5. Middle East and Africa
Cloud CDN Industry REPORT HIGHLIGHTS
| Aspects | Details |
|---|---|
| Study Period | 2019-2033 |
| Base Year | 2024 |
| Estimated Year | 2025 |
| Forecast Period | 2025-2033 |
| Historical Period | 2019-2024 |
| Growth Rate | CAGR of 24.27% from 2019-2033 |
| Segmentation |
|
Table of Contents
- 1. Introduction
- 1.1. Research Scope
- 1.2. Market Segmentation
- 1.3. Research Methodology
- 1.4. Definitions and Assumptions
- 2. Executive Summary
- 2.1. Introduction
- 3. Market Dynamics
- 3.1. Introduction
- 3.2. Market Drivers
- 3.2.1. Increasing Data Consumption Over Internet; Increasing Demand for Faster Content Delivery
- 3.3. Market Restrains
- 3.3.1. Latency Issue
- 3.4. Market Trends
- 3.4.1. E-Commerce Segment is Expected to Hold the Significant Share
- 4. Market Factor Analysis
- 4.1. Porters Five Forces
- 4.2. Supply/Value Chain
- 4.3. PESTEL analysis
- 4.4. Market Entropy
- 4.5. Patent/Trademark Analysis
- 5. Global Cloud CDN Industry Analysis, Insights and Forecast, 2019-2031
- 5.1. Market Analysis, Insights and Forecast - by Solutions & Services
- 5.1.1. Media Delivery
- 5.1.2. Cloud Security
- 5.1.3. Web Performance
- 5.2. Market Analysis, Insights and Forecast - by Deployment
- 5.2.1. Public Cloud
- 5.2.2. Private Cloud
- 5.2.3. Hybrid Cloud
- 5.3. Market Analysis, Insights and Forecast - by End-user Industry
- 5.3.1. Media & Entertainment
- 5.3.2. E-Commerce
- 5.3.3. IT and Telecom
- 5.3.4. Other End-user Industries
- 5.4. Market Analysis, Insights and Forecast - by Region
- 5.4.1. North America
- 5.4.2. Europe
- 5.4.3. Asia Pacific
- 5.4.4. Latin America
- 5.4.5. Middle East and Africa
- 5.1. Market Analysis, Insights and Forecast - by Solutions & Services
- 6. North America Cloud CDN Industry Analysis, Insights and Forecast, 2019-2031
- 6.1. Market Analysis, Insights and Forecast - by Solutions & Services
- 6.1.1. Media Delivery
- 6.1.2. Cloud Security
- 6.1.3. Web Performance
- 6.2. Market Analysis, Insights and Forecast - by Deployment
- 6.2.1. Public Cloud
- 6.2.2. Private Cloud
- 6.2.3. Hybrid Cloud
- 6.3. Market Analysis, Insights and Forecast - by End-user Industry
- 6.3.1. Media & Entertainment
- 6.3.2. E-Commerce
- 6.3.3. IT and Telecom
- 6.3.4. Other End-user Industries
- 6.1. Market Analysis, Insights and Forecast - by Solutions & Services
- 7. Europe Cloud CDN Industry Analysis, Insights and Forecast, 2019-2031
- 7.1. Market Analysis, Insights and Forecast - by Solutions & Services
- 7.1.1. Media Delivery
- 7.1.2. Cloud Security
- 7.1.3. Web Performance
- 7.2. Market Analysis, Insights and Forecast - by Deployment
- 7.2.1. Public Cloud
- 7.2.2. Private Cloud
- 7.2.3. Hybrid Cloud
- 7.3. Market Analysis, Insights and Forecast - by End-user Industry
- 7.3.1. Media & Entertainment
- 7.3.2. E-Commerce
- 7.3.3. IT and Telecom
- 7.3.4. Other End-user Industries
- 7.1. Market Analysis, Insights and Forecast - by Solutions & Services
- 8. Asia Pacific Cloud CDN Industry Analysis, Insights and Forecast, 2019-2031
- 8.1. Market Analysis, Insights and Forecast - by Solutions & Services
- 8.1.1. Media Delivery
- 8.1.2. Cloud Security
- 8.1.3. Web Performance
- 8.2. Market Analysis, Insights and Forecast - by Deployment
- 8.2.1. Public Cloud
- 8.2.2. Private Cloud
- 8.2.3. Hybrid Cloud
- 8.3. Market Analysis, Insights and Forecast - by End-user Industry
- 8.3.1. Media & Entertainment
- 8.3.2. E-Commerce
- 8.3.3. IT and Telecom
- 8.3.4. Other End-user Industries
- 8.1. Market Analysis, Insights and Forecast - by Solutions & Services
- 9. Latin America Cloud CDN Industry Analysis, Insights and Forecast, 2019-2031
- 9.1. Market Analysis, Insights and Forecast - by Solutions & Services
- 9.1.1. Media Delivery
- 9.1.2. Cloud Security
- 9.1.3. Web Performance
- 9.2. Market Analysis, Insights and Forecast - by Deployment
- 9.2.1. Public Cloud
- 9.2.2. Private Cloud
- 9.2.3. Hybrid Cloud
- 9.3. Market Analysis, Insights and Forecast - by End-user Industry
- 9.3.1. Media & Entertainment
- 9.3.2. E-Commerce
- 9.3.3. IT and Telecom
- 9.3.4. Other End-user Industries
- 9.1. Market Analysis, Insights and Forecast - by Solutions & Services
- 10. Middle East and Africa Cloud CDN Industry Analysis, Insights and Forecast, 2019-2031
- 10.1. Market Analysis, Insights and Forecast - by Solutions & Services
- 10.1.1. Media Delivery
- 10.1.2. Cloud Security
- 10.1.3. Web Performance
- 10.2. Market Analysis, Insights and Forecast - by Deployment
- 10.2.1. Public Cloud
- 10.2.2. Private Cloud
- 10.2.3. Hybrid Cloud
- 10.3. Market Analysis, Insights and Forecast - by End-user Industry
- 10.3.1. Media & Entertainment
- 10.3.2. E-Commerce
- 10.3.3. IT and Telecom
- 10.3.4. Other End-user Industries
- 10.1. Market Analysis, Insights and Forecast - by Solutions & Services
- 11. North America Cloud CDN Industry Analysis, Insights and Forecast, 2019-2031
- 11.1. Market Analysis, Insights and Forecast - By Country/Sub-region
- 11.1.1 United States
- 11.1.2 Canada
- 11.1.3 Mexico
- 12. Europe Cloud CDN Industry Analysis, Insights and Forecast, 2019-2031
- 12.1. Market Analysis, Insights and Forecast - By Country/Sub-region
- 12.1.1 Germany
- 12.1.2 United Kingdom
- 12.1.3 France
- 12.1.4 Spain
- 12.1.5 Italy
- 12.1.6 Spain
- 12.1.7 Belgium
- 12.1.8 Netherland
- 12.1.9 Nordics
- 12.1.10 Rest of Europe
- 13. Asia Pacific Cloud CDN Industry Analysis, Insights and Forecast, 2019-2031
- 13.1. Market Analysis, Insights and Forecast - By Country/Sub-region
- 13.1.1 China
- 13.1.2 Japan
- 13.1.3 India
- 13.1.4 South Korea
- 13.1.5 Southeast Asia
- 13.1.6 Australia
- 13.1.7 Indonesia
- 13.1.8 Phillipes
- 13.1.9 Singapore
- 13.1.10 Thailandc
- 13.1.11 Rest of Asia Pacific
- 14. South America Cloud CDN Industry Analysis, Insights and Forecast, 2019-2031
- 14.1. Market Analysis, Insights and Forecast - By Country/Sub-region
- 14.1.1 Brazil
- 14.1.2 Argentina
- 14.1.3 Peru
- 14.1.4 Chile
- 14.1.5 Colombia
- 14.1.6 Ecuador
- 14.1.7 Venezuela
- 14.1.8 Rest of South America
- 15. North America Cloud CDN Industry Analysis, Insights and Forecast, 2019-2031
- 15.1. Market Analysis, Insights and Forecast - By Country/Sub-region
- 15.1.1 United States
- 15.1.2 Canada
- 15.1.3 Mexico
- 16. MEA Cloud CDN Industry Analysis, Insights and Forecast, 2019-2031
- 16.1. Market Analysis, Insights and Forecast - By Country/Sub-region
- 16.1.1 United Arab Emirates
- 16.1.2 Saudi Arabia
- 16.1.3 South Africa
- 16.1.4 Rest of Middle East and Africa
- 17. Competitive Analysis
- 17.1. Global Market Share Analysis 2024
- 17.2. Company Profiles
- 17.2.1 Fastly Inc
- 17.2.1.1. Overview
- 17.2.1.2. Products
- 17.2.1.3. SWOT Analysis
- 17.2.1.4. Recent Developments
- 17.2.1.5. Financials (Based on Availability)
- 17.2.2 Verizon Communications Inc
- 17.2.2.1. Overview
- 17.2.2.2. Products
- 17.2.2.3. SWOT Analysis
- 17.2.2.4. Recent Developments
- 17.2.2.5. Financials (Based on Availability)
- 17.2.3 Akamai Technologies Inc
- 17.2.3.1. Overview
- 17.2.3.2. Products
- 17.2.3.3. SWOT Analysis
- 17.2.3.4. Recent Developments
- 17.2.3.5. Financials (Based on Availability)
- 17.2.4 Alibaba Group Holding Limited
- 17.2.4.1. Overview
- 17.2.4.2. Products
- 17.2.4.3. SWOT Analysis
- 17.2.4.4. Recent Developments
- 17.2.4.5. Financials (Based on Availability)
- 17.2.5 Telefonaktiebolaget LM Ericsson
- 17.2.5.1. Overview
- 17.2.5.2. Products
- 17.2.5.3. SWOT Analysis
- 17.2.5.4. Recent Developments
- 17.2.5.5. Financials (Based on Availability)
- 17.2.6 Limelight Networks
- 17.2.6.1. Overview
- 17.2.6.2. Products
- 17.2.6.3. SWOT Analysis
- 17.2.6.4. Recent Developments
- 17.2.6.5. Financials (Based on Availability)
- 17.2.7 Amazon Web Services Inc
- 17.2.7.1. Overview
- 17.2.7.2. Products
- 17.2.7.3. SWOT Analysis
- 17.2.7.4. Recent Developments
- 17.2.7.5. Financials (Based on Availability)
- 17.2.8 Internap Corporation
- 17.2.8.1. Overview
- 17.2.8.2. Products
- 17.2.8.3. SWOT Analysis
- 17.2.8.4. Recent Developments
- 17.2.8.5. Financials (Based on Availability)
- 17.2.9 Cloudflare Inc
- 17.2.9.1. Overview
- 17.2.9.2. Products
- 17.2.9.3. SWOT Analysis
- 17.2.9.4. Recent Developments
- 17.2.9.5. Financials (Based on Availability)
- 17.2.10 Google Inc
- 17.2.10.1. Overview
- 17.2.10.2. Products
- 17.2.10.3. SWOT Analysis
- 17.2.10.4. Recent Developments
- 17.2.10.5. Financials (Based on Availability)
- 17.2.1 Fastly Inc
List of Figures
- Figure 1: Global Cloud CDN Industry Revenue Breakdown (Million, %) by Region 2024 & 2032
- Figure 2: Global Cloud CDN Industry Volume Breakdown (K Unit, %) by Region 2024 & 2032
- Figure 3: North America Cloud CDN Industry Revenue (Million), by Country 2024 & 2032
- Figure 4: North America Cloud CDN Industry Volume (K Unit), by Country 2024 & 2032
- Figure 5: North America Cloud CDN Industry Revenue Share (%), by Country 2024 & 2032
- Figure 6: North America Cloud CDN Industry Volume Share (%), by Country 2024 & 2032
- Figure 7: Europe Cloud CDN Industry Revenue (Million), by Country 2024 & 2032
- Figure 8: Europe Cloud CDN Industry Volume (K Unit), by Country 2024 & 2032
- Figure 9: Europe Cloud CDN Industry Revenue Share (%), by Country 2024 & 2032
- Figure 10: Europe Cloud CDN Industry Volume Share (%), by Country 2024 & 2032
- Figure 11: Asia Pacific Cloud CDN Industry Revenue (Million), by Country 2024 & 2032
- Figure 12: Asia Pacific Cloud CDN Industry Volume (K Unit), by Country 2024 & 2032
- Figure 13: Asia Pacific Cloud CDN Industry Revenue Share (%), by Country 2024 & 2032
- Figure 14: Asia Pacific Cloud CDN Industry Volume Share (%), by Country 2024 & 2032
- Figure 15: South America Cloud CDN Industry Revenue (Million), by Country 2024 & 2032
- Figure 16: South America Cloud CDN Industry Volume (K Unit), by Country 2024 & 2032
- Figure 17: South America Cloud CDN Industry Revenue Share (%), by Country 2024 & 2032
- Figure 18: South America Cloud CDN Industry Volume Share (%), by Country 2024 & 2032
- Figure 19: North America Cloud CDN Industry Revenue (Million), by Country 2024 & 2032
- Figure 20: North America Cloud CDN Industry Volume (K Unit), by Country 2024 & 2032
- Figure 21: North America Cloud CDN Industry Revenue Share (%), by Country 2024 & 2032
- Figure 22: North America Cloud CDN Industry Volume Share (%), by Country 2024 & 2032
- Figure 23: MEA Cloud CDN Industry Revenue (Million), by Country 2024 & 2032
- Figure 24: MEA Cloud CDN Industry Volume (K Unit), by Country 2024 & 2032
- Figure 25: MEA Cloud CDN Industry Revenue Share (%), by Country 2024 & 2032
- Figure 26: MEA Cloud CDN Industry Volume Share (%), by Country 2024 & 2032
- Figure 27: North America Cloud CDN Industry Revenue (Million), by Solutions & Services 2024 & 2032
- Figure 28: North America Cloud CDN Industry Volume (K Unit), by Solutions & Services 2024 & 2032
- Figure 29: North America Cloud CDN Industry Revenue Share (%), by Solutions & Services 2024 & 2032
- Figure 30: North America Cloud CDN Industry Volume Share (%), by Solutions & Services 2024 & 2032
- Figure 31: North America Cloud CDN Industry Revenue (Million), by Deployment 2024 & 2032
- Figure 32: North America Cloud CDN Industry Volume (K Unit), by Deployment 2024 & 2032
- Figure 33: North America Cloud CDN Industry Revenue Share (%), by Deployment 2024 & 2032
- Figure 34: North America Cloud CDN Industry Volume Share (%), by Deployment 2024 & 2032
- Figure 35: North America Cloud CDN Industry Revenue (Million), by End-user Industry 2024 & 2032
- Figure 36: North America Cloud CDN Industry Volume (K Unit), by End-user Industry 2024 & 2032
- Figure 37: North America Cloud CDN Industry Revenue Share (%), by End-user Industry 2024 & 2032
- Figure 38: North America Cloud CDN Industry Volume Share (%), by End-user Industry 2024 & 2032
- Figure 39: North America Cloud CDN Industry Revenue (Million), by Country 2024 & 2032
- Figure 40: North America Cloud CDN Industry Volume (K Unit), by Country 2024 & 2032
- Figure 41: North America Cloud CDN Industry Revenue Share (%), by Country 2024 & 2032
- Figure 42: North America Cloud CDN Industry Volume Share (%), by Country 2024 & 2032
- Figure 43: Europe Cloud CDN Industry Revenue (Million), by Solutions & Services 2024 & 2032
- Figure 44: Europe Cloud CDN Industry Volume (K Unit), by Solutions & Services 2024 & 2032
- Figure 45: Europe Cloud CDN Industry Revenue Share (%), by Solutions & Services 2024 & 2032
- Figure 46: Europe Cloud CDN Industry Volume Share (%), by Solutions & Services 2024 & 2032
- Figure 47: Europe Cloud CDN Industry Revenue (Million), by Deployment 2024 & 2032
- Figure 48: Europe Cloud CDN Industry Volume (K Unit), by Deployment 2024 & 2032
- Figure 49: Europe Cloud CDN Industry Revenue Share (%), by Deployment 2024 & 2032
- Figure 50: Europe Cloud CDN Industry Volume Share (%), by Deployment 2024 & 2032
- Figure 51: Europe Cloud CDN Industry Revenue (Million), by End-user Industry 2024 & 2032
- Figure 52: Europe Cloud CDN Industry Volume (K Unit), by End-user Industry 2024 & 2032
- Figure 53: Europe Cloud CDN Industry Revenue Share (%), by End-user Industry 2024 & 2032
- Figure 54: Europe Cloud CDN Industry Volume Share (%), by End-user Industry 2024 & 2032
- Figure 55: Europe Cloud CDN Industry Revenue (Million), by Country 2024 & 2032
- Figure 56: Europe Cloud CDN Industry Volume (K Unit), by Country 2024 & 2032
- Figure 57: Europe Cloud CDN Industry Revenue Share (%), by Country 2024 & 2032
- Figure 58: Europe Cloud CDN Industry Volume Share (%), by Country 2024 & 2032
- Figure 59: Asia Pacific Cloud CDN Industry Revenue (Million), by Solutions & Services 2024 & 2032
- Figure 60: Asia Pacific Cloud CDN Industry Volume (K Unit), by Solutions & Services 2024 & 2032
- Figure 61: Asia Pacific Cloud CDN Industry Revenue Share (%), by Solutions & Services 2024 & 2032
- Figure 62: Asia Pacific Cloud CDN Industry Volume Share (%), by Solutions & Services 2024 & 2032
- Figure 63: Asia Pacific Cloud CDN Industry Revenue (Million), by Deployment 2024 & 2032
- Figure 64: Asia Pacific Cloud CDN Industry Volume (K Unit), by Deployment 2024 & 2032
- Figure 65: Asia Pacific Cloud CDN Industry Revenue Share (%), by Deployment 2024 & 2032
- Figure 66: Asia Pacific Cloud CDN Industry Volume Share (%), by Deployment 2024 & 2032
- Figure 67: Asia Pacific Cloud CDN Industry Revenue (Million), by End-user Industry 2024 & 2032
- Figure 68: Asia Pacific Cloud CDN Industry Volume (K Unit), by End-user Industry 2024 & 2032
- Figure 69: Asia Pacific Cloud CDN Industry Revenue Share (%), by End-user Industry 2024 & 2032
- Figure 70: Asia Pacific Cloud CDN Industry Volume Share (%), by End-user Industry 2024 & 2032
- Figure 71: Asia Pacific Cloud CDN Industry Revenue (Million), by Country 2024 & 2032
- Figure 72: Asia Pacific Cloud CDN Industry Volume (K Unit), by Country 2024 & 2032
- Figure 73: Asia Pacific Cloud CDN Industry Revenue Share (%), by Country 2024 & 2032
- Figure 74: Asia Pacific Cloud CDN Industry Volume Share (%), by Country 2024 & 2032
- Figure 75: Latin America Cloud CDN Industry Revenue (Million), by Solutions & Services 2024 & 2032
- Figure 76: Latin America Cloud CDN Industry Volume (K Unit), by Solutions & Services 2024 & 2032
- Figure 77: Latin America Cloud CDN Industry Revenue Share (%), by Solutions & Services 2024 & 2032
- Figure 78: Latin America Cloud CDN Industry Volume Share (%), by Solutions & Services 2024 & 2032
- Figure 79: Latin America Cloud CDN Industry Revenue (Million), by Deployment 2024 & 2032
- Figure 80: Latin America Cloud CDN Industry Volume (K Unit), by Deployment 2024 & 2032
- Figure 81: Latin America Cloud CDN Industry Revenue Share (%), by Deployment 2024 & 2032
- Figure 82: Latin America Cloud CDN Industry Volume Share (%), by Deployment 2024 & 2032
- Figure 83: Latin America Cloud CDN Industry Revenue (Million), by End-user Industry 2024 & 2032
- Figure 84: Latin America Cloud CDN Industry Volume (K Unit), by End-user Industry 2024 & 2032
- Figure 85: Latin America Cloud CDN Industry Revenue Share (%), by End-user Industry 2024 & 2032
- Figure 86: Latin America Cloud CDN Industry Volume Share (%), by End-user Industry 2024 & 2032
- Figure 87: Latin America Cloud CDN Industry Revenue (Million), by Country 2024 & 2032
- Figure 88: Latin America Cloud CDN Industry Volume (K Unit), by Country 2024 & 2032
- Figure 89: Latin America Cloud CDN Industry Revenue Share (%), by Country 2024 & 2032
- Figure 90: Latin America Cloud CDN Industry Volume Share (%), by Country 2024 & 2032
- Figure 91: Middle East and Africa Cloud CDN Industry Revenue (Million), by Solutions & Services 2024 & 2032
- Figure 92: Middle East and Africa Cloud CDN Industry Volume (K Unit), by Solutions & Services 2024 & 2032
- Figure 93: Middle East and Africa Cloud CDN Industry Revenue Share (%), by Solutions & Services 2024 & 2032
- Figure 94: Middle East and Africa Cloud CDN Industry Volume Share (%), by Solutions & Services 2024 & 2032
- Figure 95: Middle East and Africa Cloud CDN Industry Revenue (Million), by Deployment 2024 & 2032
- Figure 96: Middle East and Africa Cloud CDN Industry Volume (K Unit), by Deployment 2024 & 2032
- Figure 97: Middle East and Africa Cloud CDN Industry Revenue Share (%), by Deployment 2024 & 2032
- Figure 98: Middle East and Africa Cloud CDN Industry Volume Share (%), by Deployment 2024 & 2032
- Figure 99: Middle East and Africa Cloud CDN Industry Revenue (Million), by End-user Industry 2024 & 2032
- Figure 100: Middle East and Africa Cloud CDN Industry Volume (K Unit), by End-user Industry 2024 & 2032
- Figure 101: Middle East and Africa Cloud CDN Industry Revenue Share (%), by End-user Industry 2024 & 2032
- Figure 102: Middle East and Africa Cloud CDN Industry Volume Share (%), by End-user Industry 2024 & 2032
- Figure 103: Middle East and Africa Cloud CDN Industry Revenue (Million), by Country 2024 & 2032
- Figure 104: Middle East and Africa Cloud CDN Industry Volume (K Unit), by Country 2024 & 2032
- Figure 105: Middle East and Africa Cloud CDN Industry Revenue Share (%), by Country 2024 & 2032
- Figure 106: Middle East and Africa Cloud CDN Industry Volume Share (%), by Country 2024 & 2032
List of Tables
- Table 1: Global Cloud CDN Industry Revenue Million Forecast, by Region 2019 & 2032
- Table 2: Global Cloud CDN Industry Volume K Unit Forecast, by Region 2019 & 2032
- Table 3: Global Cloud CDN Industry Revenue Million Forecast, by Solutions & Services 2019 & 2032
- Table 4: Global Cloud CDN Industry Volume K Unit Forecast, by Solutions & Services 2019 & 2032
- Table 5: Global Cloud CDN Industry Revenue Million Forecast, by Deployment 2019 & 2032
- Table 6: Global Cloud CDN Industry Volume K Unit Forecast, by Deployment 2019 & 2032
- Table 7: Global Cloud CDN Industry Revenue Million Forecast, by End-user Industry 2019 & 2032
- Table 8: Global Cloud CDN Industry Volume K Unit Forecast, by End-user Industry 2019 & 2032
- Table 9: Global Cloud CDN Industry Revenue Million Forecast, by Region 2019 & 2032
- Table 10: Global Cloud CDN Industry Volume K Unit Forecast, by Region 2019 & 2032
- Table 11: Global Cloud CDN Industry Revenue Million Forecast, by Country 2019 & 2032
- Table 12: Global Cloud CDN Industry Volume K Unit Forecast, by Country 2019 & 2032
- Table 13: United States Cloud CDN Industry Revenue (Million) Forecast, by Application 2019 & 2032
- Table 14: United States Cloud CDN Industry Volume (K Unit) Forecast, by Application 2019 & 2032
- Table 15: Canada Cloud CDN Industry Revenue (Million) Forecast, by Application 2019 & 2032
- Table 16: Canada Cloud CDN Industry Volume (K Unit) Forecast, by Application 2019 & 2032
- Table 17: Mexico Cloud CDN Industry Revenue (Million) Forecast, by Application 2019 & 2032
- Table 18: Mexico Cloud CDN Industry Volume (K Unit) Forecast, by Application 2019 & 2032
- Table 19: Global Cloud CDN Industry Revenue Million Forecast, by Country 2019 & 2032
- Table 20: Global Cloud CDN Industry Volume K Unit Forecast, by Country 2019 & 2032
- Table 21: Germany Cloud CDN Industry Revenue (Million) Forecast, by Application 2019 & 2032
- Table 22: Germany Cloud CDN Industry Volume (K Unit) Forecast, by Application 2019 & 2032
- Table 23: United Kingdom Cloud CDN Industry Revenue (Million) Forecast, by Application 2019 & 2032
- Table 24: United Kingdom Cloud CDN Industry Volume (K Unit) Forecast, by Application 2019 & 2032
- Table 25: France Cloud CDN Industry Revenue (Million) Forecast, by Application 2019 & 2032
- Table 26: France Cloud CDN Industry Volume (K Unit) Forecast, by Application 2019 & 2032
- Table 27: Spain Cloud CDN Industry Revenue (Million) Forecast, by Application 2019 & 2032
- Table 28: Spain Cloud CDN Industry Volume (K Unit) Forecast, by Application 2019 & 2032
- Table 29: Italy Cloud CDN Industry Revenue (Million) Forecast, by Application 2019 & 2032
- Table 30: Italy Cloud CDN Industry Volume (K Unit) Forecast, by Application 2019 & 2032
- Table 31: Spain Cloud CDN Industry Revenue (Million) Forecast, by Application 2019 & 2032
- Table 32: Spain Cloud CDN Industry Volume (K Unit) Forecast, by Application 2019 & 2032
- Table 33: Belgium Cloud CDN Industry Revenue (Million) Forecast, by Application 2019 & 2032
- Table 34: Belgium Cloud CDN Industry Volume (K Unit) Forecast, by Application 2019 & 2032
- Table 35: Netherland Cloud CDN Industry Revenue (Million) Forecast, by Application 2019 & 2032
- Table 36: Netherland Cloud CDN Industry Volume (K Unit) Forecast, by Application 2019 & 2032
- Table 37: Nordics Cloud CDN Industry Revenue (Million) Forecast, by Application 2019 & 2032
- Table 38: Nordics Cloud CDN Industry Volume (K Unit) Forecast, by Application 2019 & 2032
- Table 39: Rest of Europe Cloud CDN Industry Revenue (Million) Forecast, by Application 2019 & 2032
- Table 40: Rest of Europe Cloud CDN Industry Volume (K Unit) Forecast, by Application 2019 & 2032
- Table 41: Global Cloud CDN Industry Revenue Million Forecast, by Country 2019 & 2032
- Table 42: Global Cloud CDN Industry Volume K Unit Forecast, by Country 2019 & 2032
- Table 43: China Cloud CDN Industry Revenue (Million) Forecast, by Application 2019 & 2032
- Table 44: China Cloud CDN Industry Volume (K Unit) Forecast, by Application 2019 & 2032
- Table 45: Japan Cloud CDN Industry Revenue (Million) Forecast, by Application 2019 & 2032
- Table 46: Japan Cloud CDN Industry Volume (K Unit) Forecast, by Application 2019 & 2032
- Table 47: India Cloud CDN Industry Revenue (Million) Forecast, by Application 2019 & 2032
- Table 48: India Cloud CDN Industry Volume (K Unit) Forecast, by Application 2019 & 2032
- Table 49: South Korea Cloud CDN Industry Revenue (Million) Forecast, by Application 2019 & 2032
- Table 50: South Korea Cloud CDN Industry Volume (K Unit) Forecast, by Application 2019 & 2032
- Table 51: Southeast Asia Cloud CDN Industry Revenue (Million) Forecast, by Application 2019 & 2032
- Table 52: Southeast Asia Cloud CDN Industry Volume (K Unit) Forecast, by Application 2019 & 2032
- Table 53: Australia Cloud CDN Industry Revenue (Million) Forecast, by Application 2019 & 2032
- Table 54: Australia Cloud CDN Industry Volume (K Unit) Forecast, by Application 2019 & 2032
- Table 55: Indonesia Cloud CDN Industry Revenue (Million) Forecast, by Application 2019 & 2032
- Table 56: Indonesia Cloud CDN Industry Volume (K Unit) Forecast, by Application 2019 & 2032
- Table 57: Phillipes Cloud CDN Industry Revenue (Million) Forecast, by Application 2019 & 2032
- Table 58: Phillipes Cloud CDN Industry Volume (K Unit) Forecast, by Application 2019 & 2032
- Table 59: Singapore Cloud CDN Industry Revenue (Million) Forecast, by Application 2019 & 2032
- Table 60: Singapore Cloud CDN Industry Volume (K Unit) Forecast, by Application 2019 & 2032
- Table 61: Thailandc Cloud CDN Industry Revenue (Million) Forecast, by Application 2019 & 2032
- Table 62: Thailandc Cloud CDN Industry Volume (K Unit) Forecast, by Application 2019 & 2032
- Table 63: Rest of Asia Pacific Cloud CDN Industry Revenue (Million) Forecast, by Application 2019 & 2032
- Table 64: Rest of Asia Pacific Cloud CDN Industry Volume (K Unit) Forecast, by Application 2019 & 2032
- Table 65: Global Cloud CDN Industry Revenue Million Forecast, by Country 2019 & 2032
- Table 66: Global Cloud CDN Industry Volume K Unit Forecast, by Country 2019 & 2032
- Table 67: Brazil Cloud CDN Industry Revenue (Million) Forecast, by Application 2019 & 2032
- Table 68: Brazil Cloud CDN Industry Volume (K Unit) Forecast, by Application 2019 & 2032
- Table 69: Argentina Cloud CDN Industry Revenue (Million) Forecast, by Application 2019 & 2032
- Table 70: Argentina Cloud CDN Industry Volume (K Unit) Forecast, by Application 2019 & 2032
- Table 71: Peru Cloud CDN Industry Revenue (Million) Forecast, by Application 2019 & 2032
- Table 72: Peru Cloud CDN Industry Volume (K Unit) Forecast, by Application 2019 & 2032
- Table 73: Chile Cloud CDN Industry Revenue (Million) Forecast, by Application 2019 & 2032
- Table 74: Chile Cloud CDN Industry Volume (K Unit) Forecast, by Application 2019 & 2032
- Table 75: Colombia Cloud CDN Industry Revenue (Million) Forecast, by Application 2019 & 2032
- Table 76: Colombia Cloud CDN Industry Volume (K Unit) Forecast, by Application 2019 & 2032
- Table 77: Ecuador Cloud CDN Industry Revenue (Million) Forecast, by Application 2019 & 2032
- Table 78: Ecuador Cloud CDN Industry Volume (K Unit) Forecast, by Application 2019 & 2032
- Table 79: Venezuela Cloud CDN Industry Revenue (Million) Forecast, by Application 2019 & 2032
- Table 80: Venezuela Cloud CDN Industry Volume (K Unit) Forecast, by Application 2019 & 2032
- Table 81: Rest of South America Cloud CDN Industry Revenue (Million) Forecast, by Application 2019 & 2032
- Table 82: Rest of South America Cloud CDN Industry Volume (K Unit) Forecast, by Application 2019 & 2032
- Table 83: Global Cloud CDN Industry Revenue Million Forecast, by Country 2019 & 2032
- Table 84: Global Cloud CDN Industry Volume K Unit Forecast, by Country 2019 & 2032
- Table 85: United States Cloud CDN Industry Revenue (Million) Forecast, by Application 2019 & 2032
- Table 86: United States Cloud CDN Industry Volume (K Unit) Forecast, by Application 2019 & 2032
- Table 87: Canada Cloud CDN Industry Revenue (Million) Forecast, by Application 2019 & 2032
- Table 88: Canada Cloud CDN Industry Volume (K Unit) Forecast, by Application 2019 & 2032
- Table 89: Mexico Cloud CDN Industry Revenue (Million) Forecast, by Application 2019 & 2032
- Table 90: Mexico Cloud CDN Industry Volume (K Unit) Forecast, by Application 2019 & 2032
- Table 91: Global Cloud CDN Industry Revenue Million Forecast, by Country 2019 & 2032
- Table 92: Global Cloud CDN Industry Volume K Unit Forecast, by Country 2019 & 2032
- Table 93: United Arab Emirates Cloud CDN Industry Revenue (Million) Forecast, by Application 2019 & 2032
- Table 94: United Arab Emirates Cloud CDN Industry Volume (K Unit) Forecast, by Application 2019 & 2032
- Table 95: Saudi Arabia Cloud CDN Industry Revenue (Million) Forecast, by Application 2019 & 2032
- Table 96: Saudi Arabia Cloud CDN Industry Volume (K Unit) Forecast, by Application 2019 & 2032
- Table 97: South Africa Cloud CDN Industry Revenue (Million) Forecast, by Application 2019 & 2032
- Table 98: South Africa Cloud CDN Industry Volume (K Unit) Forecast, by Application 2019 & 2032
- Table 99: Rest of Middle East and Africa Cloud CDN Industry Revenue (Million) Forecast, by Application 2019 & 2032
- Table 100: Rest of Middle East and Africa Cloud CDN Industry Volume (K Unit) Forecast, by Application 2019 & 2032
- Table 101: Global Cloud CDN Industry Revenue Million Forecast, by Solutions & Services 2019 & 2032
- Table 102: Global Cloud CDN Industry Volume K Unit Forecast, by Solutions & Services 2019 & 2032
- Table 103: Global Cloud CDN Industry Revenue Million Forecast, by Deployment 2019 & 2032
- Table 104: Global Cloud CDN Industry Volume K Unit Forecast, by Deployment 2019 & 2032
- Table 105: Global Cloud CDN Industry Revenue Million Forecast, by End-user Industry 2019 & 2032
- Table 106: Global Cloud CDN Industry Volume K Unit Forecast, by End-user Industry 2019 & 2032
- Table 107: Global Cloud CDN Industry Revenue Million Forecast, by Country 2019 & 2032
- Table 108: Global Cloud CDN Industry Volume K Unit Forecast, by Country 2019 & 2032
- Table 109: United States Cloud CDN Industry Revenue (Million) Forecast, by Application 2019 & 2032
- Table 110: United States Cloud CDN Industry Volume (K Unit) Forecast, by Application 2019 & 2032
- Table 111: Canada Cloud CDN Industry Revenue (Million) Forecast, by Application 2019 & 2032
- Table 112: Canada Cloud CDN Industry Volume (K Unit) Forecast, by Application 2019 & 2032
- Table 113: Global Cloud CDN Industry Revenue Million Forecast, by Solutions & Services 2019 & 2032
- Table 114: Global Cloud CDN Industry Volume K Unit Forecast, by Solutions & Services 2019 & 2032
- Table 115: Global Cloud CDN Industry Revenue Million Forecast, by Deployment 2019 & 2032
- Table 116: Global Cloud CDN Industry Volume K Unit Forecast, by Deployment 2019 & 2032
- Table 117: Global Cloud CDN Industry Revenue Million Forecast, by End-user Industry 2019 & 2032
- Table 118: Global Cloud CDN Industry Volume K Unit Forecast, by End-user Industry 2019 & 2032
- Table 119: Global Cloud CDN Industry Revenue Million Forecast, by Country 2019 & 2032
- Table 120: Global Cloud CDN Industry Volume K Unit Forecast, by Country 2019 & 2032
- Table 121: United Kingdom Cloud CDN Industry Revenue (Million) Forecast, by Application 2019 & 2032
- Table 122: United Kingdom Cloud CDN Industry Volume (K Unit) Forecast, by Application 2019 & 2032
- Table 123: Germany Cloud CDN Industry Revenue (Million) Forecast, by Application 2019 & 2032
- Table 124: Germany Cloud CDN Industry Volume (K Unit) Forecast, by Application 2019 & 2032
- Table 125: France Cloud CDN Industry Revenue (Million) Forecast, by Application 2019 & 2032
- Table 126: France Cloud CDN Industry Volume (K Unit) Forecast, by Application 2019 & 2032
- Table 127: Rest of Europe Cloud CDN Industry Revenue (Million) Forecast, by Application 2019 & 2032
- Table 128: Rest of Europe Cloud CDN Industry Volume (K Unit) Forecast, by Application 2019 & 2032
- Table 129: Global Cloud CDN Industry Revenue Million Forecast, by Solutions & Services 2019 & 2032
- Table 130: Global Cloud CDN Industry Volume K Unit Forecast, by Solutions & Services 2019 & 2032
- Table 131: Global Cloud CDN Industry Revenue Million Forecast, by Deployment 2019 & 2032
- Table 132: Global Cloud CDN Industry Volume K Unit Forecast, by Deployment 2019 & 2032
- Table 133: Global Cloud CDN Industry Revenue Million Forecast, by End-user Industry 2019 & 2032
- Table 134: Global Cloud CDN Industry Volume K Unit Forecast, by End-user Industry 2019 & 2032
- Table 135: Global Cloud CDN Industry Revenue Million Forecast, by Country 2019 & 2032
- Table 136: Global Cloud CDN Industry Volume K Unit Forecast, by Country 2019 & 2032
- Table 137: China Cloud CDN Industry Revenue (Million) Forecast, by Application 2019 & 2032
- Table 138: China Cloud CDN Industry Volume (K Unit) Forecast, by Application 2019 & 2032
- Table 139: Japan Cloud CDN Industry Revenue (Million) Forecast, by Application 2019 & 2032
- Table 140: Japan Cloud CDN Industry Volume (K Unit) Forecast, by Application 2019 & 2032
- Table 141: South Korea Cloud CDN Industry Revenue (Million) Forecast, by Application 2019 & 2032
- Table 142: South Korea Cloud CDN Industry Volume (K Unit) Forecast, by Application 2019 & 2032
- Table 143: Rest of Asia Pacific Cloud CDN Industry Revenue (Million) Forecast, by Application 2019 & 2032
- Table 144: Rest of Asia Pacific Cloud CDN Industry Volume (K Unit) Forecast, by Application 2019 & 2032
- Table 145: Global Cloud CDN Industry Revenue Million Forecast, by Solutions & Services 2019 & 2032
- Table 146: Global Cloud CDN Industry Volume K Unit Forecast, by Solutions & Services 2019 & 2032
- Table 147: Global Cloud CDN Industry Revenue Million Forecast, by Deployment 2019 & 2032
- Table 148: Global Cloud CDN Industry Volume K Unit Forecast, by Deployment 2019 & 2032
- Table 149: Global Cloud CDN Industry Revenue Million Forecast, by End-user Industry 2019 & 2032
- Table 150: Global Cloud CDN Industry Volume K Unit Forecast, by End-user Industry 2019 & 2032
- Table 151: Global Cloud CDN Industry Revenue Million Forecast, by Country 2019 & 2032
- Table 152: Global Cloud CDN Industry Volume K Unit Forecast, by Country 2019 & 2032
- Table 153: Global Cloud CDN Industry Revenue Million Forecast, by Solutions & Services 2019 & 2032
- Table 154: Global Cloud CDN Industry Volume K Unit Forecast, by Solutions & Services 2019 & 2032
- Table 155: Global Cloud CDN Industry Revenue Million Forecast, by Deployment 2019 & 2032
- Table 156: Global Cloud CDN Industry Volume K Unit Forecast, by Deployment 2019 & 2032
- Table 157: Global Cloud CDN Industry Revenue Million Forecast, by End-user Industry 2019 & 2032
- Table 158: Global Cloud CDN Industry Volume K Unit Forecast, by End-user Industry 2019 & 2032
- Table 159: Global Cloud CDN Industry Revenue Million Forecast, by Country 2019 & 2032
- Table 160: Global Cloud CDN Industry Volume K Unit Forecast, by Country 2019 & 2032
Frequently Asked Questions
1. What is the projected Compound Annual Growth Rate (CAGR) of the Cloud CDN Industry?
The projected CAGR is approximately 24.27%.
2. Which companies are prominent players in the Cloud CDN Industry?
Key companies in the market include Fastly Inc, Verizon Communications Inc , Akamai Technologies Inc, Alibaba Group Holding Limited, Telefonaktiebolaget LM Ericsson, Limelight Networks, Amazon Web Services Inc, Internap Corporation, Cloudflare Inc, Google Inc.
3. What are the main segments of the Cloud CDN Industry?
The market segments include Solutions & Services, Deployment, End-user Industry.
4. Can you provide details about the market size?
The market size is estimated to be USD 10.95 Million as of 2022.
5. What are some drivers contributing to market growth?
Increasing Data Consumption Over Internet; Increasing Demand for Faster Content Delivery.
6. What are the notable trends driving market growth?
E-Commerce Segment is Expected to Hold the Significant Share.
7. Are there any restraints impacting market growth?
Latency Issue.
8. Can you provide examples of recent developments in the market?
February 2023: Akamai Technologies Inc. unveiled Akamai Connected Cloud, a groundbreaking massively distributed edge and cloud platform designed to revolutionize cloud computing, security, and content delivery. This innovative platform is engineered to bridge the gap between applications and end-users, ensuring they remain in close proximity while pushing potential threats to a safe distance. As part of this major announcement, the company also introduced a suite of strategic cloud computing services tailored to developers, enabling them to construct, operate, and safeguard exceptionally high-performing workloads in close proximity to the points where businesses and users connect online.
9. What pricing options are available for accessing the report?
Pricing options include single-user, multi-user, and enterprise licenses priced at USD 4750, USD 5250, and USD 8750 respectively.
10. Is the market size provided in terms of value or volume?
The market size is provided in terms of value, measured in Million and volume, measured in K Unit.
11. Are there any specific market keywords associated with the report?
Yes, the market keyword associated with the report is "Cloud CDN Industry," which aids in identifying and referencing the specific market segment covered.
12. How do I determine which pricing option suits my needs best?
The pricing options vary based on user requirements and access needs. Individual users may opt for single-user licenses, while businesses requiring broader access may choose multi-user or enterprise licenses for cost-effective access to the report.
13. Are there any additional resources or data provided in the Cloud CDN Industry report?
While the report offers comprehensive insights, it's advisable to review the specific contents or supplementary materials provided to ascertain if additional resources or data are available.
14. How can I stay updated on further developments or reports in the Cloud CDN Industry?
To stay informed about further developments, trends, and reports in the Cloud CDN Industry, consider subscribing to industry newsletters, following relevant companies and organizations, or regularly checking reputable industry news sources and publications.
Methodology
Step 1 - Identification of Relevant Samples Size from Population Database


Step 2 - Approaches for Defining Global Market Size (Value, Volume* & Price*)

Note*: In applicable scenarios
Step 3 - Data Sources
Primary Research
- Web Analytics
- Survey Reports
- Research Institute
- Latest Research Reports
- Opinion Leaders
Secondary Research
- Annual Reports
- White Paper
- Latest Press Release
- Industry Association
- Paid Database
- Investor Presentations

Step 4 - Data Triangulation
Involves using different sources of information in order to increase the validity of a study
These sources are likely to be stakeholders in a program - participants, other researchers, program staff, other community members, and so on.
Then we put all data in single framework & apply various statistical tools to find out the dynamic on the market.
During the analysis stage, feedback from the stakeholder groups would be compared to determine areas of agreement as well as areas of divergence


