
Key Insights
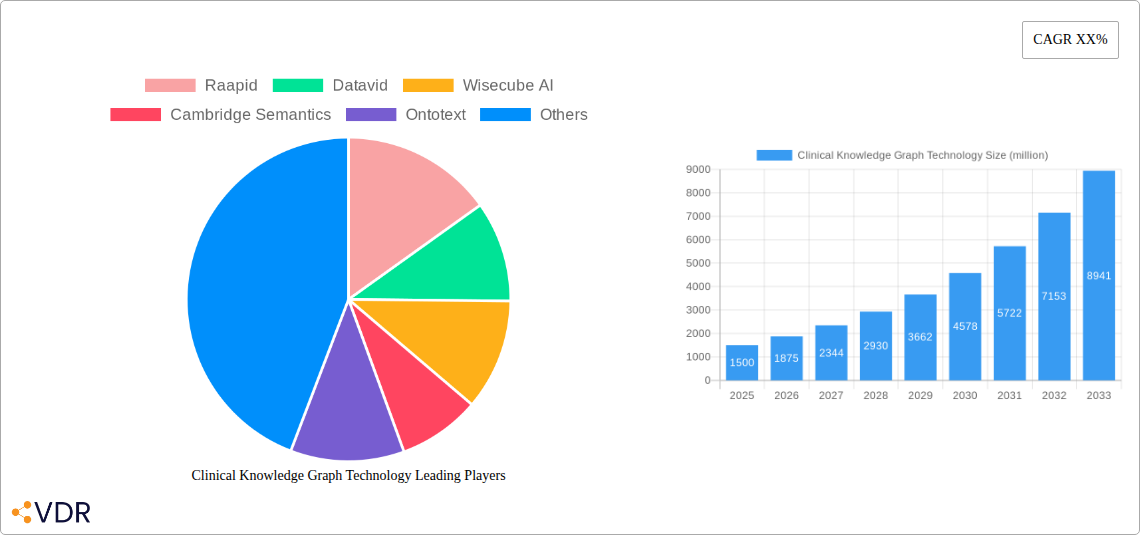
The Clinical Knowledge Graph (CKG) technology market is experiencing robust growth, driven by the increasing need for efficient and insightful analysis of complex healthcare data. The market, estimated at $1.5 billion in 2025, is projected to exhibit a Compound Annual Growth Rate (CAGR) of 25% between 2025 and 2033, reaching approximately $7 billion by 2033. This expansion is fueled by several key factors: the rising volume of unstructured clinical data, the urgent need to improve patient care through better data integration and analysis, and the growing adoption of precision medicine initiatives. Furthermore, the development of advanced analytics capabilities within CKGs is enabling healthcare providers and researchers to identify patterns, predict outcomes, and personalize treatments, further boosting market demand. Leading companies like Raapid, Datavid, Wisecube AI, Cambridge Semantics, Ontotext, and Elsevier are actively shaping the market landscape through their innovative solutions and strategic partnerships.
However, market growth is not without challenges. Significant restraints include the high initial investment costs associated with implementing CKG technology, the complexity of integrating diverse data sources, and concerns regarding data privacy and security. Overcoming these obstacles requires collaborative efforts between technology providers, healthcare institutions, and regulatory bodies to establish robust data governance frameworks and streamline integration processes. Future market trends will likely center on the increasing adoption of cloud-based CKG solutions, the expansion of interoperability standards, and the integration of artificial intelligence (AI) and machine learning (ML) to enhance analytical capabilities. The focus on improving data quality and standardization will also be crucial for unlocking the full potential of CKG technology and realizing its transformative impact on healthcare.
Clinical Knowledge Graph Technology Market Report: 2019-2033
This comprehensive report provides an in-depth analysis of the Clinical Knowledge Graph Technology market, encompassing market dynamics, growth trends, regional analysis, product landscape, key players, and future outlook. The study period covers 2019-2033, with a base year of 2025 and a forecast period of 2025-2033. The report leverages extensive research and data analysis to offer valuable insights for industry professionals, investors, and strategic decision-makers. The parent market is Healthcare IT, and the child market is Clinical Data Management.
Clinical Knowledge Graph Technology Market Dynamics & Structure
The Clinical Knowledge Graph Technology market is experiencing significant growth driven by the increasing need for efficient data management and interoperability within the healthcare sector. Market concentration is relatively moderate, with several key players competing for market share. Technological innovation, particularly in AI and machine learning, is a primary driver. Regulatory frameworks, such as HIPAA and GDPR, influence market dynamics, demanding robust data security and privacy measures. Competitive substitutes include traditional relational databases and data warehouses, but knowledge graphs offer superior semantic interoperability and reasoning capabilities. The end-user demographic primarily comprises hospitals, pharmaceutical companies, research institutions, and healthcare IT providers. M&A activity has been moderate, with xx deals recorded during the historical period (2019-2024), indicating consolidation within the market.
- Market Concentration: Moderately Concentrated (xx% held by top 5 players in 2025)
- Technological Innovation Drivers: AI, Machine Learning, Natural Language Processing
- Regulatory Frameworks: HIPAA, GDPR, other regional regulations
- Competitive Substitutes: Relational Databases, Data Warehouses
- End-User Demographics: Hospitals, Pharma Companies, Research Institutions, Healthcare IT Providers
- M&A Trends: xx deals (2019-2024), xx projected (2025-2033)
Clinical Knowledge Graph Technology Growth Trends & Insights
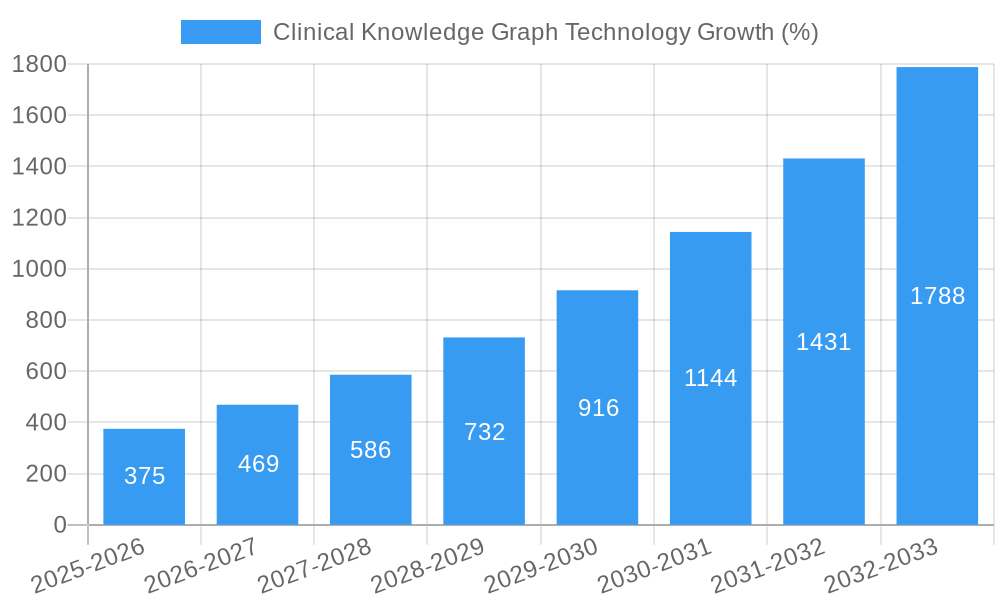
The Clinical Knowledge Graph Technology market exhibited a CAGR of xx% during the historical period (2019-2024) and is projected to grow at a CAGR of xx% during the forecast period (2025-2033), reaching a market size of $xx billion by 2033. Adoption rates are increasing steadily, driven by the need for improved clinical decision-making, enhanced patient care, and streamlined research processes. Technological disruptions, such as the rise of cloud-based solutions and advancements in semantic technologies, are accelerating market growth. Consumer behavior shifts towards data-driven healthcare and personalized medicine are further fueling market expansion. Market penetration is expected to reach xx% by 2033. The increasing adoption of electronic health records (EHRs) and the rising demand for interoperability are key factors supporting market growth.
Dominant Regions, Countries, or Segments in Clinical Knowledge Graph Technology
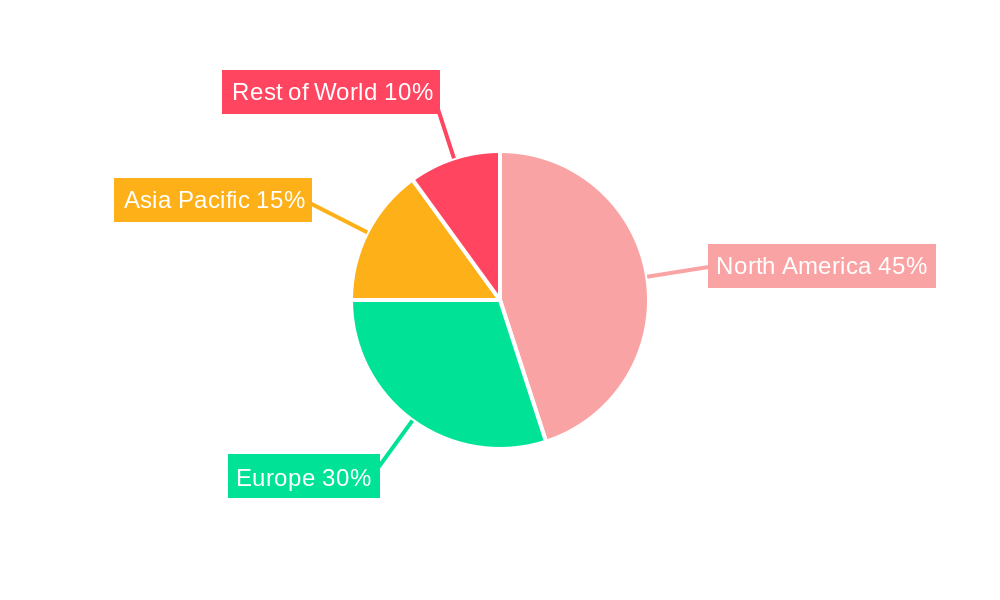
North America currently dominates the Clinical Knowledge Graph Technology market, holding a market share of xx% in 2025, driven by robust healthcare infrastructure, high adoption of advanced technologies, and significant investments in R&D. Europe follows closely, with a market share of xx%, while the Asia-Pacific region shows the highest growth potential, projected to grow at a CAGR of xx% during the forecast period.
- North America: High adoption of EHRs, advanced technological infrastructure, significant R&D investments.
- Europe: Strong regulatory framework, focus on data privacy, growing adoption of knowledge graph technologies.
- Asia-Pacific: High growth potential, increasing healthcare expenditure, rising demand for improved healthcare services.
Clinical Knowledge Graph Technology Product Landscape
The Clinical Knowledge Graph Technology market offers a diverse range of products, including knowledge graph platforms, ontologies, and semantic reasoning engines. These products are designed to facilitate data integration, knowledge representation, and clinical decision support. Unique selling propositions include improved data interoperability, enhanced analytical capabilities, and faster insights for clinical research and patient care. Recent technological advancements focus on AI-powered knowledge graph construction and real-time data analysis.
Key Drivers, Barriers & Challenges in Clinical Knowledge Graph Technology
Key Drivers: The increasing volume of healthcare data, the need for improved data interoperability, and the demand for better clinical decision support are primary drivers. Government initiatives promoting digital health and the rising adoption of EHRs further accelerate market growth.
Challenges: High implementation costs, data security and privacy concerns, and the lack of skilled professionals to manage and maintain knowledge graphs pose significant challenges. The complexity of integrating knowledge graphs with existing healthcare IT infrastructure can also hinder market adoption. Regulatory hurdles related to data sharing and patient consent can also impact market growth. These challenges result in a slower-than-predicted market adoption rate with a xx% impact in 2025.
Emerging Opportunities in Clinical Knowledge Graph Technology
Emerging opportunities lie in the development of specialized knowledge graphs for specific clinical domains (e.g., oncology, cardiology), the integration of knowledge graphs with other healthcare technologies (e.g., IoT devices, wearables), and the expansion into untapped markets in developing countries. The use of knowledge graphs in precision medicine and personalized healthcare represents a significant growth area.
Growth Accelerators in the Clinical Knowledge Graph Technology Industry
Technological advancements in AI and machine learning, strategic partnerships between healthcare providers and technology companies, and the expansion into new geographical markets are key catalysts for long-term market growth. Increasing government funding for healthcare IT initiatives and the growing emphasis on data-driven healthcare further support market expansion.
Key Players Shaping the Clinical Knowledge Graph Technology Market
Notable Milestones in Clinical Knowledge Graph Technology Sector
- 2020: Launch of the first cloud-based clinical knowledge graph platform by Raapid.
- 2022: Acquisition of a smaller knowledge graph company by Elsevier.
- 2023: Development of a new AI-powered ontology creation tool by Ontotext.
- 2024: Increased adoption of knowledge graphs by major hospitals in North America.
- 2025: Several significant partnerships between leading technology companies and pharmaceutical companies leading to more widespread market penetration.
In-Depth Clinical Knowledge Graph Technology Market Outlook
The Clinical Knowledge Graph Technology market is poised for robust growth over the next decade, driven by a confluence of factors including technological advancements, increasing data volumes, and the growing demand for improved healthcare outcomes. Strategic partnerships, focused product development, and expansion into new markets represent key opportunities for market players. The long-term potential is substantial, with continued market expansion projected across all major regions.
Clinical Knowledge Graph Technology Segmentation
-
1. Application
- 1.1. Medical Diagnosis and Treatment
- 1.2. Drug Discovery
- 1.3. Others
-
2. Types
- 2.1. Structured Knowledge Graph
- 2.2. Unstructured Knowledge Graph
Clinical Knowledge Graph Technology Segmentation By Geography
-
1. North America
- 1.1. United States
- 1.2. Canada
- 1.3. Mexico
-
2. South America
- 2.1. Brazil
- 2.2. Argentina
- 2.3. Rest of South America
-
3. Europe
- 3.1. United Kingdom
- 3.2. Germany
- 3.3. France
- 3.4. Italy
- 3.5. Spain
- 3.6. Russia
- 3.7. Benelux
- 3.8. Nordics
- 3.9. Rest of Europe
-
4. Middle East & Africa
- 4.1. Turkey
- 4.2. Israel
- 4.3. GCC
- 4.4. North Africa
- 4.5. South Africa
- 4.6. Rest of Middle East & Africa
-
5. Asia Pacific
- 5.1. China
- 5.2. India
- 5.3. Japan
- 5.4. South Korea
- 5.5. ASEAN
- 5.6. Oceania
- 5.7. Rest of Asia Pacific
Clinical Knowledge Graph Technology REPORT HIGHLIGHTS
| Aspects | Details |
|---|---|
| Study Period | 2019-2033 |
| Base Year | 2024 |
| Estimated Year | 2025 |
| Forecast Period | 2025-2033 |
| Historical Period | 2019-2024 |
| Growth Rate | CAGR of XX% from 2019-2033 |
| Segmentation |
|
Table of Contents
- 1. Introduction
- 1.1. Research Scope
- 1.2. Market Segmentation
- 1.3. Research Methodology
- 1.4. Definitions and Assumptions
- 2. Executive Summary
- 2.1. Introduction
- 3. Market Dynamics
- 3.1. Introduction
- 3.2. Market Drivers
- 3.3. Market Restrains
- 3.4. Market Trends
- 4. Market Factor Analysis
- 4.1. Porters Five Forces
- 4.2. Supply/Value Chain
- 4.3. PESTEL analysis
- 4.4. Market Entropy
- 4.5. Patent/Trademark Analysis
- 5. Global Clinical Knowledge Graph Technology Analysis, Insights and Forecast, 2019-2031
- 5.1. Market Analysis, Insights and Forecast - by Application
- 5.1.1. Medical Diagnosis and Treatment
- 5.1.2. Drug Discovery
- 5.1.3. Others
- 5.2. Market Analysis, Insights and Forecast - by Types
- 5.2.1. Structured Knowledge Graph
- 5.2.2. Unstructured Knowledge Graph
- 5.3. Market Analysis, Insights and Forecast - by Region
- 5.3.1. North America
- 5.3.2. South America
- 5.3.3. Europe
- 5.3.4. Middle East & Africa
- 5.3.5. Asia Pacific
- 5.1. Market Analysis, Insights and Forecast - by Application
- 6. North America Clinical Knowledge Graph Technology Analysis, Insights and Forecast, 2019-2031
- 6.1. Market Analysis, Insights and Forecast - by Application
- 6.1.1. Medical Diagnosis and Treatment
- 6.1.2. Drug Discovery
- 6.1.3. Others
- 6.2. Market Analysis, Insights and Forecast - by Types
- 6.2.1. Structured Knowledge Graph
- 6.2.2. Unstructured Knowledge Graph
- 6.1. Market Analysis, Insights and Forecast - by Application
- 7. South America Clinical Knowledge Graph Technology Analysis, Insights and Forecast, 2019-2031
- 7.1. Market Analysis, Insights and Forecast - by Application
- 7.1.1. Medical Diagnosis and Treatment
- 7.1.2. Drug Discovery
- 7.1.3. Others
- 7.2. Market Analysis, Insights and Forecast - by Types
- 7.2.1. Structured Knowledge Graph
- 7.2.2. Unstructured Knowledge Graph
- 7.1. Market Analysis, Insights and Forecast - by Application
- 8. Europe Clinical Knowledge Graph Technology Analysis, Insights and Forecast, 2019-2031
- 8.1. Market Analysis, Insights and Forecast - by Application
- 8.1.1. Medical Diagnosis and Treatment
- 8.1.2. Drug Discovery
- 8.1.3. Others
- 8.2. Market Analysis, Insights and Forecast - by Types
- 8.2.1. Structured Knowledge Graph
- 8.2.2. Unstructured Knowledge Graph
- 8.1. Market Analysis, Insights and Forecast - by Application
- 9. Middle East & Africa Clinical Knowledge Graph Technology Analysis, Insights and Forecast, 2019-2031
- 9.1. Market Analysis, Insights and Forecast - by Application
- 9.1.1. Medical Diagnosis and Treatment
- 9.1.2. Drug Discovery
- 9.1.3. Others
- 9.2. Market Analysis, Insights and Forecast - by Types
- 9.2.1. Structured Knowledge Graph
- 9.2.2. Unstructured Knowledge Graph
- 9.1. Market Analysis, Insights and Forecast - by Application
- 10. Asia Pacific Clinical Knowledge Graph Technology Analysis, Insights and Forecast, 2019-2031
- 10.1. Market Analysis, Insights and Forecast - by Application
- 10.1.1. Medical Diagnosis and Treatment
- 10.1.2. Drug Discovery
- 10.1.3. Others
- 10.2. Market Analysis, Insights and Forecast - by Types
- 10.2.1. Structured Knowledge Graph
- 10.2.2. Unstructured Knowledge Graph
- 10.1. Market Analysis, Insights and Forecast - by Application
- 11. Competitive Analysis
- 11.1. Global Market Share Analysis 2024
- 11.2. Company Profiles
- 11.2.1 Raapid
- 11.2.1.1. Overview
- 11.2.1.2. Products
- 11.2.1.3. SWOT Analysis
- 11.2.1.4. Recent Developments
- 11.2.1.5. Financials (Based on Availability)
- 11.2.2 Datavid
- 11.2.2.1. Overview
- 11.2.2.2. Products
- 11.2.2.3. SWOT Analysis
- 11.2.2.4. Recent Developments
- 11.2.2.5. Financials (Based on Availability)
- 11.2.3 Wisecube AI
- 11.2.3.1. Overview
- 11.2.3.2. Products
- 11.2.3.3. SWOT Analysis
- 11.2.3.4. Recent Developments
- 11.2.3.5. Financials (Based on Availability)
- 11.2.4 Cambridge Semantics
- 11.2.4.1. Overview
- 11.2.4.2. Products
- 11.2.4.3. SWOT Analysis
- 11.2.4.4. Recent Developments
- 11.2.4.5. Financials (Based on Availability)
- 11.2.5 Ontotext
- 11.2.5.1. Overview
- 11.2.5.2. Products
- 11.2.5.3. SWOT Analysis
- 11.2.5.4. Recent Developments
- 11.2.5.5. Financials (Based on Availability)
- 11.2.6 Elsevier
- 11.2.6.1. Overview
- 11.2.6.2. Products
- 11.2.6.3. SWOT Analysis
- 11.2.6.4. Recent Developments
- 11.2.6.5. Financials (Based on Availability)
- 11.2.1 Raapid
List of Figures
- Figure 1: Global Clinical Knowledge Graph Technology Revenue Breakdown (million, %) by Region 2024 & 2032
- Figure 2: North America Clinical Knowledge Graph Technology Revenue (million), by Application 2024 & 2032
- Figure 3: North America Clinical Knowledge Graph Technology Revenue Share (%), by Application 2024 & 2032
- Figure 4: North America Clinical Knowledge Graph Technology Revenue (million), by Types 2024 & 2032
- Figure 5: North America Clinical Knowledge Graph Technology Revenue Share (%), by Types 2024 & 2032
- Figure 6: North America Clinical Knowledge Graph Technology Revenue (million), by Country 2024 & 2032
- Figure 7: North America Clinical Knowledge Graph Technology Revenue Share (%), by Country 2024 & 2032
- Figure 8: South America Clinical Knowledge Graph Technology Revenue (million), by Application 2024 & 2032
- Figure 9: South America Clinical Knowledge Graph Technology Revenue Share (%), by Application 2024 & 2032
- Figure 10: South America Clinical Knowledge Graph Technology Revenue (million), by Types 2024 & 2032
- Figure 11: South America Clinical Knowledge Graph Technology Revenue Share (%), by Types 2024 & 2032
- Figure 12: South America Clinical Knowledge Graph Technology Revenue (million), by Country 2024 & 2032
- Figure 13: South America Clinical Knowledge Graph Technology Revenue Share (%), by Country 2024 & 2032
- Figure 14: Europe Clinical Knowledge Graph Technology Revenue (million), by Application 2024 & 2032
- Figure 15: Europe Clinical Knowledge Graph Technology Revenue Share (%), by Application 2024 & 2032
- Figure 16: Europe Clinical Knowledge Graph Technology Revenue (million), by Types 2024 & 2032
- Figure 17: Europe Clinical Knowledge Graph Technology Revenue Share (%), by Types 2024 & 2032
- Figure 18: Europe Clinical Knowledge Graph Technology Revenue (million), by Country 2024 & 2032
- Figure 19: Europe Clinical Knowledge Graph Technology Revenue Share (%), by Country 2024 & 2032
- Figure 20: Middle East & Africa Clinical Knowledge Graph Technology Revenue (million), by Application 2024 & 2032
- Figure 21: Middle East & Africa Clinical Knowledge Graph Technology Revenue Share (%), by Application 2024 & 2032
- Figure 22: Middle East & Africa Clinical Knowledge Graph Technology Revenue (million), by Types 2024 & 2032
- Figure 23: Middle East & Africa Clinical Knowledge Graph Technology Revenue Share (%), by Types 2024 & 2032
- Figure 24: Middle East & Africa Clinical Knowledge Graph Technology Revenue (million), by Country 2024 & 2032
- Figure 25: Middle East & Africa Clinical Knowledge Graph Technology Revenue Share (%), by Country 2024 & 2032
- Figure 26: Asia Pacific Clinical Knowledge Graph Technology Revenue (million), by Application 2024 & 2032
- Figure 27: Asia Pacific Clinical Knowledge Graph Technology Revenue Share (%), by Application 2024 & 2032
- Figure 28: Asia Pacific Clinical Knowledge Graph Technology Revenue (million), by Types 2024 & 2032
- Figure 29: Asia Pacific Clinical Knowledge Graph Technology Revenue Share (%), by Types 2024 & 2032
- Figure 30: Asia Pacific Clinical Knowledge Graph Technology Revenue (million), by Country 2024 & 2032
- Figure 31: Asia Pacific Clinical Knowledge Graph Technology Revenue Share (%), by Country 2024 & 2032
List of Tables
- Table 1: Global Clinical Knowledge Graph Technology Revenue million Forecast, by Region 2019 & 2032
- Table 2: Global Clinical Knowledge Graph Technology Revenue million Forecast, by Application 2019 & 2032
- Table 3: Global Clinical Knowledge Graph Technology Revenue million Forecast, by Types 2019 & 2032
- Table 4: Global Clinical Knowledge Graph Technology Revenue million Forecast, by Region 2019 & 2032
- Table 5: Global Clinical Knowledge Graph Technology Revenue million Forecast, by Application 2019 & 2032
- Table 6: Global Clinical Knowledge Graph Technology Revenue million Forecast, by Types 2019 & 2032
- Table 7: Global Clinical Knowledge Graph Technology Revenue million Forecast, by Country 2019 & 2032
- Table 8: United States Clinical Knowledge Graph Technology Revenue (million) Forecast, by Application 2019 & 2032
- Table 9: Canada Clinical Knowledge Graph Technology Revenue (million) Forecast, by Application 2019 & 2032
- Table 10: Mexico Clinical Knowledge Graph Technology Revenue (million) Forecast, by Application 2019 & 2032
- Table 11: Global Clinical Knowledge Graph Technology Revenue million Forecast, by Application 2019 & 2032
- Table 12: Global Clinical Knowledge Graph Technology Revenue million Forecast, by Types 2019 & 2032
- Table 13: Global Clinical Knowledge Graph Technology Revenue million Forecast, by Country 2019 & 2032
- Table 14: Brazil Clinical Knowledge Graph Technology Revenue (million) Forecast, by Application 2019 & 2032
- Table 15: Argentina Clinical Knowledge Graph Technology Revenue (million) Forecast, by Application 2019 & 2032
- Table 16: Rest of South America Clinical Knowledge Graph Technology Revenue (million) Forecast, by Application 2019 & 2032
- Table 17: Global Clinical Knowledge Graph Technology Revenue million Forecast, by Application 2019 & 2032
- Table 18: Global Clinical Knowledge Graph Technology Revenue million Forecast, by Types 2019 & 2032
- Table 19: Global Clinical Knowledge Graph Technology Revenue million Forecast, by Country 2019 & 2032
- Table 20: United Kingdom Clinical Knowledge Graph Technology Revenue (million) Forecast, by Application 2019 & 2032
- Table 21: Germany Clinical Knowledge Graph Technology Revenue (million) Forecast, by Application 2019 & 2032
- Table 22: France Clinical Knowledge Graph Technology Revenue (million) Forecast, by Application 2019 & 2032
- Table 23: Italy Clinical Knowledge Graph Technology Revenue (million) Forecast, by Application 2019 & 2032
- Table 24: Spain Clinical Knowledge Graph Technology Revenue (million) Forecast, by Application 2019 & 2032
- Table 25: Russia Clinical Knowledge Graph Technology Revenue (million) Forecast, by Application 2019 & 2032
- Table 26: Benelux Clinical Knowledge Graph Technology Revenue (million) Forecast, by Application 2019 & 2032
- Table 27: Nordics Clinical Knowledge Graph Technology Revenue (million) Forecast, by Application 2019 & 2032
- Table 28: Rest of Europe Clinical Knowledge Graph Technology Revenue (million) Forecast, by Application 2019 & 2032
- Table 29: Global Clinical Knowledge Graph Technology Revenue million Forecast, by Application 2019 & 2032
- Table 30: Global Clinical Knowledge Graph Technology Revenue million Forecast, by Types 2019 & 2032
- Table 31: Global Clinical Knowledge Graph Technology Revenue million Forecast, by Country 2019 & 2032
- Table 32: Turkey Clinical Knowledge Graph Technology Revenue (million) Forecast, by Application 2019 & 2032
- Table 33: Israel Clinical Knowledge Graph Technology Revenue (million) Forecast, by Application 2019 & 2032
- Table 34: GCC Clinical Knowledge Graph Technology Revenue (million) Forecast, by Application 2019 & 2032
- Table 35: North Africa Clinical Knowledge Graph Technology Revenue (million) Forecast, by Application 2019 & 2032
- Table 36: South Africa Clinical Knowledge Graph Technology Revenue (million) Forecast, by Application 2019 & 2032
- Table 37: Rest of Middle East & Africa Clinical Knowledge Graph Technology Revenue (million) Forecast, by Application 2019 & 2032
- Table 38: Global Clinical Knowledge Graph Technology Revenue million Forecast, by Application 2019 & 2032
- Table 39: Global Clinical Knowledge Graph Technology Revenue million Forecast, by Types 2019 & 2032
- Table 40: Global Clinical Knowledge Graph Technology Revenue million Forecast, by Country 2019 & 2032
- Table 41: China Clinical Knowledge Graph Technology Revenue (million) Forecast, by Application 2019 & 2032
- Table 42: India Clinical Knowledge Graph Technology Revenue (million) Forecast, by Application 2019 & 2032
- Table 43: Japan Clinical Knowledge Graph Technology Revenue (million) Forecast, by Application 2019 & 2032
- Table 44: South Korea Clinical Knowledge Graph Technology Revenue (million) Forecast, by Application 2019 & 2032
- Table 45: ASEAN Clinical Knowledge Graph Technology Revenue (million) Forecast, by Application 2019 & 2032
- Table 46: Oceania Clinical Knowledge Graph Technology Revenue (million) Forecast, by Application 2019 & 2032
- Table 47: Rest of Asia Pacific Clinical Knowledge Graph Technology Revenue (million) Forecast, by Application 2019 & 2032
Frequently Asked Questions
1. What is the projected Compound Annual Growth Rate (CAGR) of the Clinical Knowledge Graph Technology?
The projected CAGR is approximately XX%.
2. Which companies are prominent players in the Clinical Knowledge Graph Technology?
Key companies in the market include Raapid, Datavid, Wisecube AI, Cambridge Semantics, Ontotext, Elsevier.
3. What are the main segments of the Clinical Knowledge Graph Technology?
The market segments include Application, Types.
4. Can you provide details about the market size?
The market size is estimated to be USD XXX million as of 2022.
5. What are some drivers contributing to market growth?
N/A
6. What are the notable trends driving market growth?
N/A
7. Are there any restraints impacting market growth?
N/A
8. Can you provide examples of recent developments in the market?
N/A
9. What pricing options are available for accessing the report?
Pricing options include single-user, multi-user, and enterprise licenses priced at USD 3950.00, USD 5925.00, and USD 7900.00 respectively.
10. Is the market size provided in terms of value or volume?
The market size is provided in terms of value, measured in million.
11. Are there any specific market keywords associated with the report?
Yes, the market keyword associated with the report is "Clinical Knowledge Graph Technology," which aids in identifying and referencing the specific market segment covered.
12. How do I determine which pricing option suits my needs best?
The pricing options vary based on user requirements and access needs. Individual users may opt for single-user licenses, while businesses requiring broader access may choose multi-user or enterprise licenses for cost-effective access to the report.
13. Are there any additional resources or data provided in the Clinical Knowledge Graph Technology report?
While the report offers comprehensive insights, it's advisable to review the specific contents or supplementary materials provided to ascertain if additional resources or data are available.
14. How can I stay updated on further developments or reports in the Clinical Knowledge Graph Technology?
To stay informed about further developments, trends, and reports in the Clinical Knowledge Graph Technology, consider subscribing to industry newsletters, following relevant companies and organizations, or regularly checking reputable industry news sources and publications.
Methodology
Step 1 - Identification of Relevant Samples Size from Population Database


Step 2 - Approaches for Defining Global Market Size (Value, Volume* & Price*)

Note*: In applicable scenarios
Step 3 - Data Sources
Primary Research
- Web Analytics
- Survey Reports
- Research Institute
- Latest Research Reports
- Opinion Leaders
Secondary Research
- Annual Reports
- White Paper
- Latest Press Release
- Industry Association
- Paid Database
- Investor Presentations

Step 4 - Data Triangulation
Involves using different sources of information in order to increase the validity of a study
These sources are likely to be stakeholders in a program - participants, other researchers, program staff, other community members, and so on.
Then we put all data in single framework & apply various statistical tools to find out the dynamic on the market.
During the analysis stage, feedback from the stakeholder groups would be compared to determine areas of agreement as well as areas of divergence


