
Key Insights
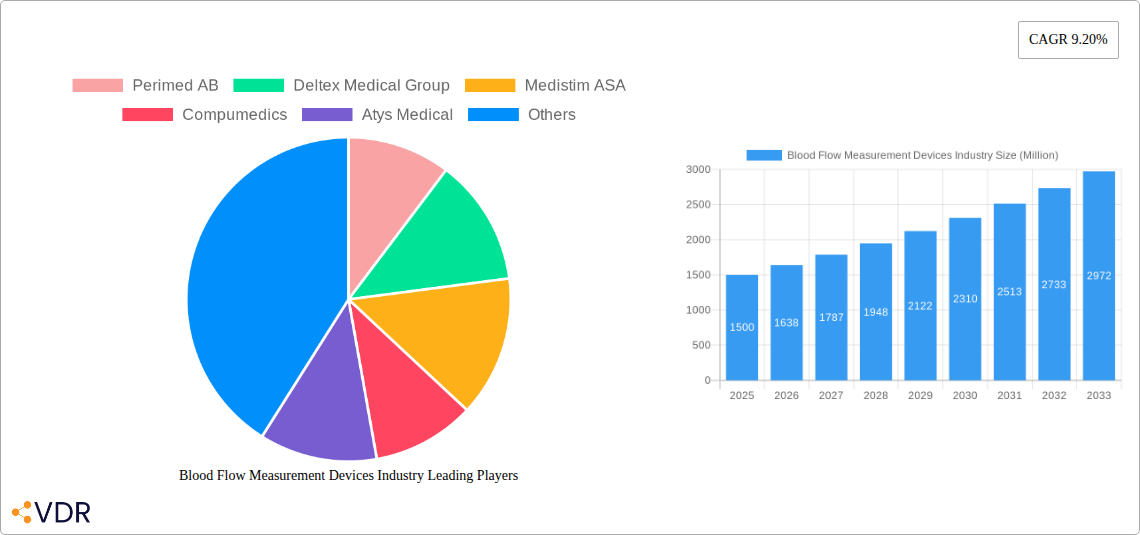
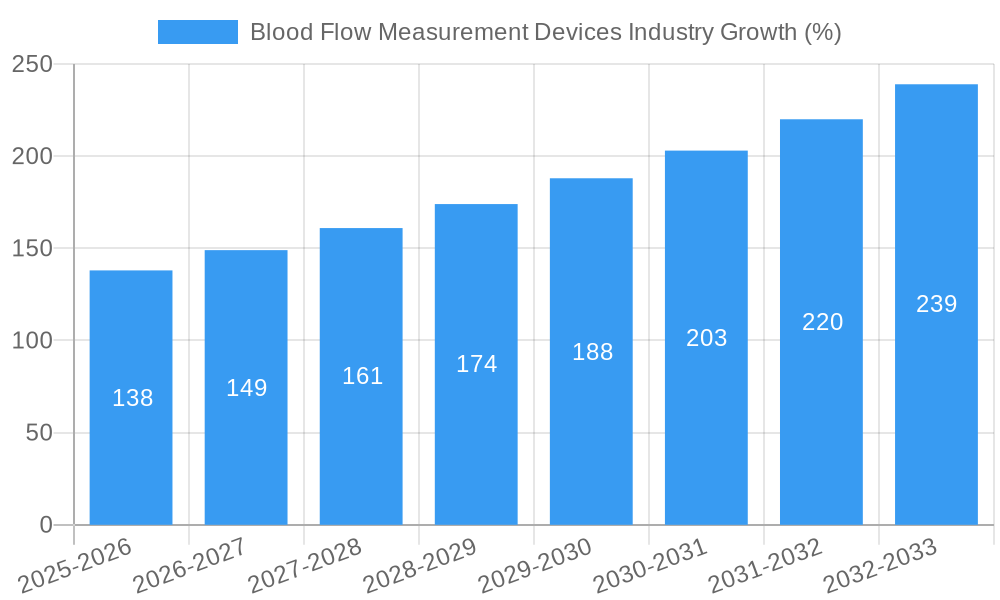
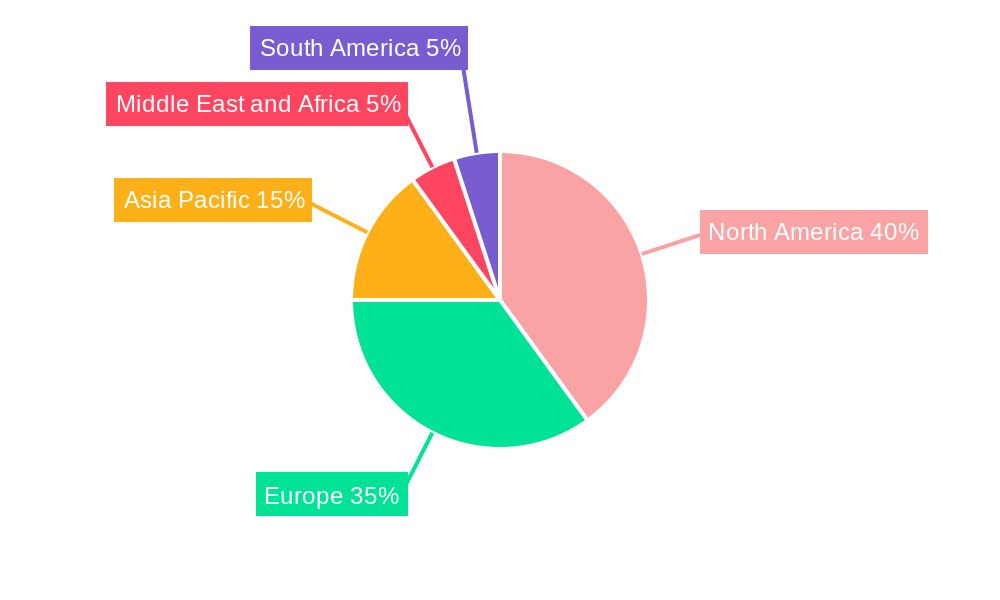
The global blood flow measurement devices market is experiencing robust growth, projected to reach a significant size by 2033, driven by a 9.20% CAGR from 2019 to 2033. This expansion is fueled by several key factors. The increasing prevalence of cardiovascular diseases necessitates advanced diagnostic and monitoring tools, creating a substantial demand for accurate and reliable blood flow measurement devices. Technological advancements, such as the development of miniaturized sensors and improved imaging techniques (like advanced ultrasound and laser Doppler technologies), are enhancing the accuracy and accessibility of these devices. Furthermore, the rising adoption of minimally invasive procedures and the growing preference for ambulatory care settings contribute to the market's expansion. The market is segmented by product type (ultrasound devices, transit-time flow meters, laser Doppler flowmetry), application (invasive vs. non-invasive), and end-user (hospitals, ambulatory surgical centers, research institutions). The competitive landscape includes established players like Perimed AB, Deltex Medical Group, and Medistim ASA, alongside emerging companies introducing innovative solutions. Regional growth varies, with North America and Europe currently holding substantial market shares, however, the Asia-Pacific region is poised for significant growth due to rising healthcare expenditure and increasing awareness of cardiovascular health.
The market's growth, however, faces certain restraints. High costs associated with advanced devices and their maintenance can limit accessibility, particularly in resource-constrained settings. Regulatory hurdles and stringent approval processes for new technologies can also impede market penetration. Despite these challenges, the long-term outlook for the blood flow measurement devices market remains positive, driven by continuous innovation, expanding healthcare infrastructure, and growing awareness of the importance of early diagnosis and effective management of cardiovascular conditions. The market's segmentation presents diverse opportunities for companies to specialize in specific technologies, applications, or end-user segments.
Blood Flow Measurement Devices Industry Market Report: 2019-2033
This comprehensive report provides a detailed analysis of the Blood Flow Measurement Devices market, encompassing market dynamics, growth trends, regional dominance, product landscape, and key players. The study covers the historical period (2019-2024), base year (2025), and forecast period (2025-2033), offering invaluable insights for industry professionals, investors, and stakeholders. The report segments the market by product (Ultrasound Devices, Transit-Time Flow Meters, Laser Doppler), application (Invasive, Non-Invasive), and end-user (Hospitals, Ambulatory Surgical Centers, Others).
Blood Flow Measurement Devices Industry Market Dynamics & Structure
This section analyzes the competitive landscape, technological advancements, regulatory influences, and market consolidation within the blood flow measurement devices industry. The market exhibits a moderately consolidated structure with key players holding significant market share. Technological innovation, particularly in non-invasive techniques and AI integration, is a major driver. Stringent regulatory frameworks influence product development and market entry. The presence of substitute technologies, though limited, poses some competitive pressure. The end-user demographic is primarily comprised of hospitals and ambulatory surgical centers, with a growing segment of home healthcare settings. M&A activity has been moderate, with a focus on strategic acquisitions to expand product portfolios and geographic reach.
- Market Concentration: Moderately consolidated, with top 5 players holding approximately xx% of the market share in 2025.
- Technological Innovation: Focus on miniaturization, improved accuracy, non-invasive techniques, and AI integration.
- Regulatory Framework: Stringent regulatory approvals impacting product development and launch timelines.
- Competitive Substitutes: Limited, but alternative diagnostic methods exert some competitive pressure.
- End-User Demographics: Primarily hospitals and ambulatory surgical centers, with increasing adoption in home healthcare.
- M&A Trends: Moderate M&A activity, primarily focused on strategic acquisitions for portfolio expansion. Estimated xx M&A deals between 2019-2024.
Blood Flow Measurement Devices Industry Growth Trends & Insights
The blood flow measurement devices market witnessed significant growth between 2019 and 2024, driven by factors such as increasing prevalence of cardiovascular diseases, technological advancements, and rising healthcare expenditure. The market size is estimated at xx million units in 2025 and is projected to grow at a CAGR of xx% during the forecast period (2025-2033), reaching xx million units by 2033. Adoption rates are highest in developed regions due to better healthcare infrastructure and higher awareness. Technological disruptions, such as the introduction of AI-powered diagnostic tools, are expected to accelerate market growth. Consumer behavior shifts towards minimally invasive procedures and remote patient monitoring are also influencing market trends. The market penetration rate for non-invasive methods is increasing, driven by patient preference and ease of use.
Dominant Regions, Countries, or Segments in Blood Flow Measurement Devices Industry
North America currently holds the largest market share in the blood flow measurement devices industry, driven by high healthcare expenditure, advanced medical infrastructure, and a high prevalence of cardiovascular diseases. Europe is another significant market, with strong growth prospects. Within the product segment, ultrasound devices dominate due to their versatility and relatively lower cost. Among applications, non-invasive methods are gaining traction due to patient preference and ease of use. Hospitals represent the largest end-user segment.
- Key Drivers for North America: High healthcare expenditure, well-established healthcare infrastructure, and increased prevalence of cardiovascular diseases.
- Key Drivers for Europe: Growing healthcare awareness, aging population, and government initiatives supporting advanced medical technologies.
- Product Segment Dominance: Ultrasound devices due to versatility and cost-effectiveness.
- Application Segment Dominance: Non-invasive methods due to increased patient preference and ease of use.
- End-User Segment Dominance: Hospitals due to higher patient volumes and availability of resources.
Blood Flow Measurement Devices Industry Product Landscape
The blood flow measurement devices market offers a diverse range of products, including ultrasound devices, transit-time flow meters, and laser Doppler systems. Recent innovations focus on improving accuracy, portability, and ease of use. Ultrasound devices are characterized by their versatility and real-time imaging capabilities. Transit-time flow meters are widely used for their simplicity and reliability in specific applications. Laser Doppler flowmetry provides highly accurate measurements, particularly in microcirculation research. Unique selling propositions often revolve around improved image quality, enhanced portability, reduced invasiveness, and advanced data analysis capabilities.
Key Drivers, Barriers & Challenges in Blood Flow Measurement Devices Industry
Key Drivers:
- Increasing prevalence of cardiovascular diseases.
- Technological advancements leading to improved accuracy and ease of use.
- Growing demand for minimally invasive procedures.
- Rising healthcare expenditure and insurance coverage.
Key Challenges:
- High initial investment costs for advanced technologies.
- Stringent regulatory approvals for new products.
- Competition from alternative diagnostic methods.
- Potential supply chain disruptions impacting device availability. This has led to approximately a xx% increase in device costs in some regions.
Emerging Opportunities in Blood Flow Measurement Devices Industry
- Growing demand for point-of-care diagnostics.
- Increasing adoption of telemedicine and remote patient monitoring.
- Development of AI-powered diagnostic tools for improved accuracy and efficiency.
- Expansion into emerging markets with rising healthcare spending.
Growth Accelerators in the Blood Flow Measurement Devices Industry
Technological breakthroughs, particularly in non-invasive imaging techniques and AI-driven data analysis, will continue to accelerate market growth. Strategic partnerships between device manufacturers and healthcare providers will further enhance market penetration. Expanding into untapped markets, such as home healthcare and developing countries, represents significant growth opportunities.
Key Players Shaping the Blood Flow Measurement Devices Industry Market
- Perimed AB
- Deltex Medical Group
- Medistim ASA
- Compumedics
- Atys Medical
- Cook Group Incorporated
- Carolina Medical Inc
- SONOTEC GmbH
- Transonic
- ADInstruments
- ArjoHuntleigh Inc
- Moor Instruments Ltd
Notable Milestones in Blood Flow Measurement Devices Industry Sector
- May 2022: NuraLogix launched a 30-second contactless blood pressure and vital sign measurement technology in Singapore. This signifies a significant advancement in non-invasive blood pressure monitoring.
- February 2022: Philips expanded its ultrasound portfolio with advanced hemodynamic assessment capabilities, enhancing real-time blood flow measurement on its Lumify device. This expansion improved the capabilities of a widely used point-of-care ultrasound system.
In-Depth Blood Flow Measurement Devices Industry Market Outlook
The blood flow measurement devices market is poised for continued robust growth, driven by technological advancements, expanding applications, and increasing healthcare expenditure globally. Strategic partnerships, expansion into emerging markets, and the development of innovative, user-friendly devices will shape the future of this dynamic market. The focus on non-invasive techniques and integration with AI promises to revolutionize diagnostics and improve patient care.
Blood Flow Measurement Devices Industry Segmentation
-
1. Product
-
1.1. Ultrasound Devices
- 1.1.1. Ultrasound Doppler
- 1.1.2. Transit-Time Flow Meters
- 1.2. Laser Doppler
-
1.1. Ultrasound Devices
-
2. Application
-
2.1. Invasive
- 2.1.1. Microvascular Surgery
- 2.1.2. Coronary Artery Bypass Surgery
- 2.1.3. Others
-
2.2. Non-Invasive
- 2.2.1. Cardiovascular Disease
- 2.2.2. Gastroenterology
- 2.2.3. Tumor Monitoring
-
2.1. Invasive
-
3. End-User
- 3.1. Hospitals
- 3.2. Ambulatory Surgical Centers
- 3.3. Others
Blood Flow Measurement Devices Industry Segmentation By Geography
-
1. North America
- 1.1. United States
- 1.2. Canada
- 1.3. Mexico
-
2. Europe
- 2.1. Germany
- 2.2. United Kingdom
- 2.3. France
- 2.4. Italy
- 2.5. Spain
- 2.6. Rest of Europe
-
3. Asia Pacific
- 3.1. China
- 3.2. Japan
- 3.3. India
- 3.4. Australia
- 3.5. South Korea
- 3.6. Rest of Asia Pacific
-
4. Middle East and Africa
- 4.1. GCC
- 4.2. South Africa
- 4.3. Rest of Middle East and Africa
-
5. South America
- 5.1. Brazil
- 5.2. Argentina
- 5.3. Rest of South America
Blood Flow Measurement Devices Industry REPORT HIGHLIGHTS
| Aspects | Details |
|---|---|
| Study Period | 2019-2033 |
| Base Year | 2024 |
| Estimated Year | 2025 |
| Forecast Period | 2025-2033 |
| Historical Period | 2019-2024 |
| Growth Rate | CAGR of 9.20% from 2019-2033 |
| Segmentation |
|
Table of Contents
- 1. Introduction
- 1.1. Research Scope
- 1.2. Market Segmentation
- 1.3. Research Methodology
- 1.4. Definitions and Assumptions
- 2. Executive Summary
- 2.1. Introduction
- 3. Market Dynamics
- 3.1. Introduction
- 3.2. Market Drivers
- 3.2.1. Increasing Prevalence of Cardiovascular Diseases and Growing Geriatric Population; Advancements in Product Technologies
- 3.3. Market Restrains
- 3.3.1. High Cost of Blood Flow Measurement Devices; Limited Reimbursement Scenario
- 3.4. Market Trends
- 3.4.1. Ultrasound Dopplers Segment is Expected to Hold a Major Market Share in the Blood Flow Measurement Devices Market.
- 4. Market Factor Analysis
- 4.1. Porters Five Forces
- 4.2. Supply/Value Chain
- 4.3. PESTEL analysis
- 4.4. Market Entropy
- 4.5. Patent/Trademark Analysis
- 5. Global Blood Flow Measurement Devices Industry Analysis, Insights and Forecast, 2019-2031
- 5.1. Market Analysis, Insights and Forecast - by Product
- 5.1.1. Ultrasound Devices
- 5.1.1.1. Ultrasound Doppler
- 5.1.1.2. Transit-Time Flow Meters
- 5.1.2. Laser Doppler
- 5.1.1. Ultrasound Devices
- 5.2. Market Analysis, Insights and Forecast - by Application
- 5.2.1. Invasive
- 5.2.1.1. Microvascular Surgery
- 5.2.1.2. Coronary Artery Bypass Surgery
- 5.2.1.3. Others
- 5.2.2. Non-Invasive
- 5.2.2.1. Cardiovascular Disease
- 5.2.2.2. Gastroenterology
- 5.2.2.3. Tumor Monitoring
- 5.2.1. Invasive
- 5.3. Market Analysis, Insights and Forecast - by End-User
- 5.3.1. Hospitals
- 5.3.2. Ambulatory Surgical Centers
- 5.3.3. Others
- 5.4. Market Analysis, Insights and Forecast - by Region
- 5.4.1. North America
- 5.4.2. Europe
- 5.4.3. Asia Pacific
- 5.4.4. Middle East and Africa
- 5.4.5. South America
- 5.1. Market Analysis, Insights and Forecast - by Product
- 6. North America Blood Flow Measurement Devices Industry Analysis, Insights and Forecast, 2019-2031
- 6.1. Market Analysis, Insights and Forecast - by Product
- 6.1.1. Ultrasound Devices
- 6.1.1.1. Ultrasound Doppler
- 6.1.1.2. Transit-Time Flow Meters
- 6.1.2. Laser Doppler
- 6.1.1. Ultrasound Devices
- 6.2. Market Analysis, Insights and Forecast - by Application
- 6.2.1. Invasive
- 6.2.1.1. Microvascular Surgery
- 6.2.1.2. Coronary Artery Bypass Surgery
- 6.2.1.3. Others
- 6.2.2. Non-Invasive
- 6.2.2.1. Cardiovascular Disease
- 6.2.2.2. Gastroenterology
- 6.2.2.3. Tumor Monitoring
- 6.2.1. Invasive
- 6.3. Market Analysis, Insights and Forecast - by End-User
- 6.3.1. Hospitals
- 6.3.2. Ambulatory Surgical Centers
- 6.3.3. Others
- 6.1. Market Analysis, Insights and Forecast - by Product
- 7. Europe Blood Flow Measurement Devices Industry Analysis, Insights and Forecast, 2019-2031
- 7.1. Market Analysis, Insights and Forecast - by Product
- 7.1.1. Ultrasound Devices
- 7.1.1.1. Ultrasound Doppler
- 7.1.1.2. Transit-Time Flow Meters
- 7.1.2. Laser Doppler
- 7.1.1. Ultrasound Devices
- 7.2. Market Analysis, Insights and Forecast - by Application
- 7.2.1. Invasive
- 7.2.1.1. Microvascular Surgery
- 7.2.1.2. Coronary Artery Bypass Surgery
- 7.2.1.3. Others
- 7.2.2. Non-Invasive
- 7.2.2.1. Cardiovascular Disease
- 7.2.2.2. Gastroenterology
- 7.2.2.3. Tumor Monitoring
- 7.2.1. Invasive
- 7.3. Market Analysis, Insights and Forecast - by End-User
- 7.3.1. Hospitals
- 7.3.2. Ambulatory Surgical Centers
- 7.3.3. Others
- 7.1. Market Analysis, Insights and Forecast - by Product
- 8. Asia Pacific Blood Flow Measurement Devices Industry Analysis, Insights and Forecast, 2019-2031
- 8.1. Market Analysis, Insights and Forecast - by Product
- 8.1.1. Ultrasound Devices
- 8.1.1.1. Ultrasound Doppler
- 8.1.1.2. Transit-Time Flow Meters
- 8.1.2. Laser Doppler
- 8.1.1. Ultrasound Devices
- 8.2. Market Analysis, Insights and Forecast - by Application
- 8.2.1. Invasive
- 8.2.1.1. Microvascular Surgery
- 8.2.1.2. Coronary Artery Bypass Surgery
- 8.2.1.3. Others
- 8.2.2. Non-Invasive
- 8.2.2.1. Cardiovascular Disease
- 8.2.2.2. Gastroenterology
- 8.2.2.3. Tumor Monitoring
- 8.2.1. Invasive
- 8.3. Market Analysis, Insights and Forecast - by End-User
- 8.3.1. Hospitals
- 8.3.2. Ambulatory Surgical Centers
- 8.3.3. Others
- 8.1. Market Analysis, Insights and Forecast - by Product
- 9. Middle East and Africa Blood Flow Measurement Devices Industry Analysis, Insights and Forecast, 2019-2031
- 9.1. Market Analysis, Insights and Forecast - by Product
- 9.1.1. Ultrasound Devices
- 9.1.1.1. Ultrasound Doppler
- 9.1.1.2. Transit-Time Flow Meters
- 9.1.2. Laser Doppler
- 9.1.1. Ultrasound Devices
- 9.2. Market Analysis, Insights and Forecast - by Application
- 9.2.1. Invasive
- 9.2.1.1. Microvascular Surgery
- 9.2.1.2. Coronary Artery Bypass Surgery
- 9.2.1.3. Others
- 9.2.2. Non-Invasive
- 9.2.2.1. Cardiovascular Disease
- 9.2.2.2. Gastroenterology
- 9.2.2.3. Tumor Monitoring
- 9.2.1. Invasive
- 9.3. Market Analysis, Insights and Forecast - by End-User
- 9.3.1. Hospitals
- 9.3.2. Ambulatory Surgical Centers
- 9.3.3. Others
- 9.1. Market Analysis, Insights and Forecast - by Product
- 10. South America Blood Flow Measurement Devices Industry Analysis, Insights and Forecast, 2019-2031
- 10.1. Market Analysis, Insights and Forecast - by Product
- 10.1.1. Ultrasound Devices
- 10.1.1.1. Ultrasound Doppler
- 10.1.1.2. Transit-Time Flow Meters
- 10.1.2. Laser Doppler
- 10.1.1. Ultrasound Devices
- 10.2. Market Analysis, Insights and Forecast - by Application
- 10.2.1. Invasive
- 10.2.1.1. Microvascular Surgery
- 10.2.1.2. Coronary Artery Bypass Surgery
- 10.2.1.3. Others
- 10.2.2. Non-Invasive
- 10.2.2.1. Cardiovascular Disease
- 10.2.2.2. Gastroenterology
- 10.2.2.3. Tumor Monitoring
- 10.2.1. Invasive
- 10.3. Market Analysis, Insights and Forecast - by End-User
- 10.3.1. Hospitals
- 10.3.2. Ambulatory Surgical Centers
- 10.3.3. Others
- 10.1. Market Analysis, Insights and Forecast - by Product
- 11. North America Blood Flow Measurement Devices Industry Analysis, Insights and Forecast, 2019-2031
- 11.1. Market Analysis, Insights and Forecast - By Country/Sub-region
- 11.1.1. undefined
- 12. Europe Blood Flow Measurement Devices Industry Analysis, Insights and Forecast, 2019-2031
- 12.1. Market Analysis, Insights and Forecast - By Country/Sub-region
- 12.1.1. undefined
- 13. Asia Pacific Blood Flow Measurement Devices Industry Analysis, Insights and Forecast, 2019-2031
- 13.1. Market Analysis, Insights and Forecast - By Country/Sub-region
- 13.1.1. undefined
- 14. Middle East and Africa Blood Flow Measurement Devices Industry Analysis, Insights and Forecast, 2019-2031
- 14.1. Market Analysis, Insights and Forecast - By Country/Sub-region
- 14.1.1. undefined
- 15. South America Blood Flow Measurement Devices Industry Analysis, Insights and Forecast, 2019-2031
- 15.1. Market Analysis, Insights and Forecast - By Country/Sub-region
- 15.1.1. undefined
- 16. Competitive Analysis
- 16.1. Global Market Share Analysis 2024
- 16.2. Company Profiles
- 16.2.1 Perimed AB
- 16.2.1.1. Overview
- 16.2.1.2. Products
- 16.2.1.3. SWOT Analysis
- 16.2.1.4. Recent Developments
- 16.2.1.5. Financials (Based on Availability)
- 16.2.2 Deltex Medical Group
- 16.2.2.1. Overview
- 16.2.2.2. Products
- 16.2.2.3. SWOT Analysis
- 16.2.2.4. Recent Developments
- 16.2.2.5. Financials (Based on Availability)
- 16.2.3 Medistim ASA
- 16.2.3.1. Overview
- 16.2.3.2. Products
- 16.2.3.3. SWOT Analysis
- 16.2.3.4. Recent Developments
- 16.2.3.5. Financials (Based on Availability)
- 16.2.4 Compumedics
- 16.2.4.1. Overview
- 16.2.4.2. Products
- 16.2.4.3. SWOT Analysis
- 16.2.4.4. Recent Developments
- 16.2.4.5. Financials (Based on Availability)
- 16.2.5 Atys Medical
- 16.2.5.1. Overview
- 16.2.5.2. Products
- 16.2.5.3. SWOT Analysis
- 16.2.5.4. Recent Developments
- 16.2.5.5. Financials (Based on Availability)
- 16.2.6 Cook Group Incorporated
- 16.2.6.1. Overview
- 16.2.6.2. Products
- 16.2.6.3. SWOT Analysis
- 16.2.6.4. Recent Developments
- 16.2.6.5. Financials (Based on Availability)
- 16.2.7 Carolina Medical Inc
- 16.2.7.1. Overview
- 16.2.7.2. Products
- 16.2.7.3. SWOT Analysis
- 16.2.7.4. Recent Developments
- 16.2.7.5. Financials (Based on Availability)
- 16.2.8 SONOTEC GmbH
- 16.2.8.1. Overview
- 16.2.8.2. Products
- 16.2.8.3. SWOT Analysis
- 16.2.8.4. Recent Developments
- 16.2.8.5. Financials (Based on Availability)
- 16.2.9 Transonic
- 16.2.9.1. Overview
- 16.2.9.2. Products
- 16.2.9.3. SWOT Analysis
- 16.2.9.4. Recent Developments
- 16.2.9.5. Financials (Based on Availability)
- 16.2.10 ADInstruments
- 16.2.10.1. Overview
- 16.2.10.2. Products
- 16.2.10.3. SWOT Analysis
- 16.2.10.4. Recent Developments
- 16.2.10.5. Financials (Based on Availability)
- 16.2.11 ArjoHuntleigh Inc
- 16.2.11.1. Overview
- 16.2.11.2. Products
- 16.2.11.3. SWOT Analysis
- 16.2.11.4. Recent Developments
- 16.2.11.5. Financials (Based on Availability)
- 16.2.12 Moor Instruments Ltd
- 16.2.12.1. Overview
- 16.2.12.2. Products
- 16.2.12.3. SWOT Analysis
- 16.2.12.4. Recent Developments
- 16.2.12.5. Financials (Based on Availability)
- 16.2.1 Perimed AB
List of Figures
- Figure 1: Global Blood Flow Measurement Devices Industry Revenue Breakdown (Million, %) by Region 2024 & 2032
- Figure 2: Global Blood Flow Measurement Devices Industry Volume Breakdown (K Unit, %) by Region 2024 & 2032
- Figure 3: North America Blood Flow Measurement Devices Industry Revenue (Million), by Country 2024 & 2032
- Figure 4: North America Blood Flow Measurement Devices Industry Volume (K Unit), by Country 2024 & 2032
- Figure 5: North America Blood Flow Measurement Devices Industry Revenue Share (%), by Country 2024 & 2032
- Figure 6: North America Blood Flow Measurement Devices Industry Volume Share (%), by Country 2024 & 2032
- Figure 7: Europe Blood Flow Measurement Devices Industry Revenue (Million), by Country 2024 & 2032
- Figure 8: Europe Blood Flow Measurement Devices Industry Volume (K Unit), by Country 2024 & 2032
- Figure 9: Europe Blood Flow Measurement Devices Industry Revenue Share (%), by Country 2024 & 2032
- Figure 10: Europe Blood Flow Measurement Devices Industry Volume Share (%), by Country 2024 & 2032
- Figure 11: Asia Pacific Blood Flow Measurement Devices Industry Revenue (Million), by Country 2024 & 2032
- Figure 12: Asia Pacific Blood Flow Measurement Devices Industry Volume (K Unit), by Country 2024 & 2032
- Figure 13: Asia Pacific Blood Flow Measurement Devices Industry Revenue Share (%), by Country 2024 & 2032
- Figure 14: Asia Pacific Blood Flow Measurement Devices Industry Volume Share (%), by Country 2024 & 2032
- Figure 15: Middle East and Africa Blood Flow Measurement Devices Industry Revenue (Million), by Country 2024 & 2032
- Figure 16: Middle East and Africa Blood Flow Measurement Devices Industry Volume (K Unit), by Country 2024 & 2032
- Figure 17: Middle East and Africa Blood Flow Measurement Devices Industry Revenue Share (%), by Country 2024 & 2032
- Figure 18: Middle East and Africa Blood Flow Measurement Devices Industry Volume Share (%), by Country 2024 & 2032
- Figure 19: South America Blood Flow Measurement Devices Industry Revenue (Million), by Country 2024 & 2032
- Figure 20: South America Blood Flow Measurement Devices Industry Volume (K Unit), by Country 2024 & 2032
- Figure 21: South America Blood Flow Measurement Devices Industry Revenue Share (%), by Country 2024 & 2032
- Figure 22: South America Blood Flow Measurement Devices Industry Volume Share (%), by Country 2024 & 2032
- Figure 23: North America Blood Flow Measurement Devices Industry Revenue (Million), by Product 2024 & 2032
- Figure 24: North America Blood Flow Measurement Devices Industry Volume (K Unit), by Product 2024 & 2032
- Figure 25: North America Blood Flow Measurement Devices Industry Revenue Share (%), by Product 2024 & 2032
- Figure 26: North America Blood Flow Measurement Devices Industry Volume Share (%), by Product 2024 & 2032
- Figure 27: North America Blood Flow Measurement Devices Industry Revenue (Million), by Application 2024 & 2032
- Figure 28: North America Blood Flow Measurement Devices Industry Volume (K Unit), by Application 2024 & 2032
- Figure 29: North America Blood Flow Measurement Devices Industry Revenue Share (%), by Application 2024 & 2032
- Figure 30: North America Blood Flow Measurement Devices Industry Volume Share (%), by Application 2024 & 2032
- Figure 31: North America Blood Flow Measurement Devices Industry Revenue (Million), by End-User 2024 & 2032
- Figure 32: North America Blood Flow Measurement Devices Industry Volume (K Unit), by End-User 2024 & 2032
- Figure 33: North America Blood Flow Measurement Devices Industry Revenue Share (%), by End-User 2024 & 2032
- Figure 34: North America Blood Flow Measurement Devices Industry Volume Share (%), by End-User 2024 & 2032
- Figure 35: North America Blood Flow Measurement Devices Industry Revenue (Million), by Country 2024 & 2032
- Figure 36: North America Blood Flow Measurement Devices Industry Volume (K Unit), by Country 2024 & 2032
- Figure 37: North America Blood Flow Measurement Devices Industry Revenue Share (%), by Country 2024 & 2032
- Figure 38: North America Blood Flow Measurement Devices Industry Volume Share (%), by Country 2024 & 2032
- Figure 39: Europe Blood Flow Measurement Devices Industry Revenue (Million), by Product 2024 & 2032
- Figure 40: Europe Blood Flow Measurement Devices Industry Volume (K Unit), by Product 2024 & 2032
- Figure 41: Europe Blood Flow Measurement Devices Industry Revenue Share (%), by Product 2024 & 2032
- Figure 42: Europe Blood Flow Measurement Devices Industry Volume Share (%), by Product 2024 & 2032
- Figure 43: Europe Blood Flow Measurement Devices Industry Revenue (Million), by Application 2024 & 2032
- Figure 44: Europe Blood Flow Measurement Devices Industry Volume (K Unit), by Application 2024 & 2032
- Figure 45: Europe Blood Flow Measurement Devices Industry Revenue Share (%), by Application 2024 & 2032
- Figure 46: Europe Blood Flow Measurement Devices Industry Volume Share (%), by Application 2024 & 2032
- Figure 47: Europe Blood Flow Measurement Devices Industry Revenue (Million), by End-User 2024 & 2032
- Figure 48: Europe Blood Flow Measurement Devices Industry Volume (K Unit), by End-User 2024 & 2032
- Figure 49: Europe Blood Flow Measurement Devices Industry Revenue Share (%), by End-User 2024 & 2032
- Figure 50: Europe Blood Flow Measurement Devices Industry Volume Share (%), by End-User 2024 & 2032
- Figure 51: Europe Blood Flow Measurement Devices Industry Revenue (Million), by Country 2024 & 2032
- Figure 52: Europe Blood Flow Measurement Devices Industry Volume (K Unit), by Country 2024 & 2032
- Figure 53: Europe Blood Flow Measurement Devices Industry Revenue Share (%), by Country 2024 & 2032
- Figure 54: Europe Blood Flow Measurement Devices Industry Volume Share (%), by Country 2024 & 2032
- Figure 55: Asia Pacific Blood Flow Measurement Devices Industry Revenue (Million), by Product 2024 & 2032
- Figure 56: Asia Pacific Blood Flow Measurement Devices Industry Volume (K Unit), by Product 2024 & 2032
- Figure 57: Asia Pacific Blood Flow Measurement Devices Industry Revenue Share (%), by Product 2024 & 2032
- Figure 58: Asia Pacific Blood Flow Measurement Devices Industry Volume Share (%), by Product 2024 & 2032
- Figure 59: Asia Pacific Blood Flow Measurement Devices Industry Revenue (Million), by Application 2024 & 2032
- Figure 60: Asia Pacific Blood Flow Measurement Devices Industry Volume (K Unit), by Application 2024 & 2032
- Figure 61: Asia Pacific Blood Flow Measurement Devices Industry Revenue Share (%), by Application 2024 & 2032
- Figure 62: Asia Pacific Blood Flow Measurement Devices Industry Volume Share (%), by Application 2024 & 2032
- Figure 63: Asia Pacific Blood Flow Measurement Devices Industry Revenue (Million), by End-User 2024 & 2032
- Figure 64: Asia Pacific Blood Flow Measurement Devices Industry Volume (K Unit), by End-User 2024 & 2032
- Figure 65: Asia Pacific Blood Flow Measurement Devices Industry Revenue Share (%), by End-User 2024 & 2032
- Figure 66: Asia Pacific Blood Flow Measurement Devices Industry Volume Share (%), by End-User 2024 & 2032
- Figure 67: Asia Pacific Blood Flow Measurement Devices Industry Revenue (Million), by Country 2024 & 2032
- Figure 68: Asia Pacific Blood Flow Measurement Devices Industry Volume (K Unit), by Country 2024 & 2032
- Figure 69: Asia Pacific Blood Flow Measurement Devices Industry Revenue Share (%), by Country 2024 & 2032
- Figure 70: Asia Pacific Blood Flow Measurement Devices Industry Volume Share (%), by Country 2024 & 2032
- Figure 71: Middle East and Africa Blood Flow Measurement Devices Industry Revenue (Million), by Product 2024 & 2032
- Figure 72: Middle East and Africa Blood Flow Measurement Devices Industry Volume (K Unit), by Product 2024 & 2032
- Figure 73: Middle East and Africa Blood Flow Measurement Devices Industry Revenue Share (%), by Product 2024 & 2032
- Figure 74: Middle East and Africa Blood Flow Measurement Devices Industry Volume Share (%), by Product 2024 & 2032
- Figure 75: Middle East and Africa Blood Flow Measurement Devices Industry Revenue (Million), by Application 2024 & 2032
- Figure 76: Middle East and Africa Blood Flow Measurement Devices Industry Volume (K Unit), by Application 2024 & 2032
- Figure 77: Middle East and Africa Blood Flow Measurement Devices Industry Revenue Share (%), by Application 2024 & 2032
- Figure 78: Middle East and Africa Blood Flow Measurement Devices Industry Volume Share (%), by Application 2024 & 2032
- Figure 79: Middle East and Africa Blood Flow Measurement Devices Industry Revenue (Million), by End-User 2024 & 2032
- Figure 80: Middle East and Africa Blood Flow Measurement Devices Industry Volume (K Unit), by End-User 2024 & 2032
- Figure 81: Middle East and Africa Blood Flow Measurement Devices Industry Revenue Share (%), by End-User 2024 & 2032
- Figure 82: Middle East and Africa Blood Flow Measurement Devices Industry Volume Share (%), by End-User 2024 & 2032
- Figure 83: Middle East and Africa Blood Flow Measurement Devices Industry Revenue (Million), by Country 2024 & 2032
- Figure 84: Middle East and Africa Blood Flow Measurement Devices Industry Volume (K Unit), by Country 2024 & 2032
- Figure 85: Middle East and Africa Blood Flow Measurement Devices Industry Revenue Share (%), by Country 2024 & 2032
- Figure 86: Middle East and Africa Blood Flow Measurement Devices Industry Volume Share (%), by Country 2024 & 2032
- Figure 87: South America Blood Flow Measurement Devices Industry Revenue (Million), by Product 2024 & 2032
- Figure 88: South America Blood Flow Measurement Devices Industry Volume (K Unit), by Product 2024 & 2032
- Figure 89: South America Blood Flow Measurement Devices Industry Revenue Share (%), by Product 2024 & 2032
- Figure 90: South America Blood Flow Measurement Devices Industry Volume Share (%), by Product 2024 & 2032
- Figure 91: South America Blood Flow Measurement Devices Industry Revenue (Million), by Application 2024 & 2032
- Figure 92: South America Blood Flow Measurement Devices Industry Volume (K Unit), by Application 2024 & 2032
- Figure 93: South America Blood Flow Measurement Devices Industry Revenue Share (%), by Application 2024 & 2032
- Figure 94: South America Blood Flow Measurement Devices Industry Volume Share (%), by Application 2024 & 2032
- Figure 95: South America Blood Flow Measurement Devices Industry Revenue (Million), by End-User 2024 & 2032
- Figure 96: South America Blood Flow Measurement Devices Industry Volume (K Unit), by End-User 2024 & 2032
- Figure 97: South America Blood Flow Measurement Devices Industry Revenue Share (%), by End-User 2024 & 2032
- Figure 98: South America Blood Flow Measurement Devices Industry Volume Share (%), by End-User 2024 & 2032
- Figure 99: South America Blood Flow Measurement Devices Industry Revenue (Million), by Country 2024 & 2032
- Figure 100: South America Blood Flow Measurement Devices Industry Volume (K Unit), by Country 2024 & 2032
- Figure 101: South America Blood Flow Measurement Devices Industry Revenue Share (%), by Country 2024 & 2032
- Figure 102: South America Blood Flow Measurement Devices Industry Volume Share (%), by Country 2024 & 2032
List of Tables
- Table 1: Global Blood Flow Measurement Devices Industry Revenue Million Forecast, by Region 2019 & 2032
- Table 2: Global Blood Flow Measurement Devices Industry Volume K Unit Forecast, by Region 2019 & 2032
- Table 3: Global Blood Flow Measurement Devices Industry Revenue Million Forecast, by Product 2019 & 2032
- Table 4: Global Blood Flow Measurement Devices Industry Volume K Unit Forecast, by Product 2019 & 2032
- Table 5: Global Blood Flow Measurement Devices Industry Revenue Million Forecast, by Application 2019 & 2032
- Table 6: Global Blood Flow Measurement Devices Industry Volume K Unit Forecast, by Application 2019 & 2032
- Table 7: Global Blood Flow Measurement Devices Industry Revenue Million Forecast, by End-User 2019 & 2032
- Table 8: Global Blood Flow Measurement Devices Industry Volume K Unit Forecast, by End-User 2019 & 2032
- Table 9: Global Blood Flow Measurement Devices Industry Revenue Million Forecast, by Region 2019 & 2032
- Table 10: Global Blood Flow Measurement Devices Industry Volume K Unit Forecast, by Region 2019 & 2032
- Table 11: Global Blood Flow Measurement Devices Industry Revenue Million Forecast, by Country 2019 & 2032
- Table 12: Global Blood Flow Measurement Devices Industry Volume K Unit Forecast, by Country 2019 & 2032
- Table 13: Global Blood Flow Measurement Devices Industry Revenue Million Forecast, by Country 2019 & 2032
- Table 14: Global Blood Flow Measurement Devices Industry Volume K Unit Forecast, by Country 2019 & 2032
- Table 15: Global Blood Flow Measurement Devices Industry Revenue Million Forecast, by Country 2019 & 2032
- Table 16: Global Blood Flow Measurement Devices Industry Volume K Unit Forecast, by Country 2019 & 2032
- Table 17: Global Blood Flow Measurement Devices Industry Revenue Million Forecast, by Country 2019 & 2032
- Table 18: Global Blood Flow Measurement Devices Industry Volume K Unit Forecast, by Country 2019 & 2032
- Table 19: Global Blood Flow Measurement Devices Industry Revenue Million Forecast, by Country 2019 & 2032
- Table 20: Global Blood Flow Measurement Devices Industry Volume K Unit Forecast, by Country 2019 & 2032
- Table 21: Global Blood Flow Measurement Devices Industry Revenue Million Forecast, by Product 2019 & 2032
- Table 22: Global Blood Flow Measurement Devices Industry Volume K Unit Forecast, by Product 2019 & 2032
- Table 23: Global Blood Flow Measurement Devices Industry Revenue Million Forecast, by Application 2019 & 2032
- Table 24: Global Blood Flow Measurement Devices Industry Volume K Unit Forecast, by Application 2019 & 2032
- Table 25: Global Blood Flow Measurement Devices Industry Revenue Million Forecast, by End-User 2019 & 2032
- Table 26: Global Blood Flow Measurement Devices Industry Volume K Unit Forecast, by End-User 2019 & 2032
- Table 27: Global Blood Flow Measurement Devices Industry Revenue Million Forecast, by Country 2019 & 2032
- Table 28: Global Blood Flow Measurement Devices Industry Volume K Unit Forecast, by Country 2019 & 2032
- Table 29: United States Blood Flow Measurement Devices Industry Revenue (Million) Forecast, by Application 2019 & 2032
- Table 30: United States Blood Flow Measurement Devices Industry Volume (K Unit) Forecast, by Application 2019 & 2032
- Table 31: Canada Blood Flow Measurement Devices Industry Revenue (Million) Forecast, by Application 2019 & 2032
- Table 32: Canada Blood Flow Measurement Devices Industry Volume (K Unit) Forecast, by Application 2019 & 2032
- Table 33: Mexico Blood Flow Measurement Devices Industry Revenue (Million) Forecast, by Application 2019 & 2032
- Table 34: Mexico Blood Flow Measurement Devices Industry Volume (K Unit) Forecast, by Application 2019 & 2032
- Table 35: Global Blood Flow Measurement Devices Industry Revenue Million Forecast, by Product 2019 & 2032
- Table 36: Global Blood Flow Measurement Devices Industry Volume K Unit Forecast, by Product 2019 & 2032
- Table 37: Global Blood Flow Measurement Devices Industry Revenue Million Forecast, by Application 2019 & 2032
- Table 38: Global Blood Flow Measurement Devices Industry Volume K Unit Forecast, by Application 2019 & 2032
- Table 39: Global Blood Flow Measurement Devices Industry Revenue Million Forecast, by End-User 2019 & 2032
- Table 40: Global Blood Flow Measurement Devices Industry Volume K Unit Forecast, by End-User 2019 & 2032
- Table 41: Global Blood Flow Measurement Devices Industry Revenue Million Forecast, by Country 2019 & 2032
- Table 42: Global Blood Flow Measurement Devices Industry Volume K Unit Forecast, by Country 2019 & 2032
- Table 43: Germany Blood Flow Measurement Devices Industry Revenue (Million) Forecast, by Application 2019 & 2032
- Table 44: Germany Blood Flow Measurement Devices Industry Volume (K Unit) Forecast, by Application 2019 & 2032
- Table 45: United Kingdom Blood Flow Measurement Devices Industry Revenue (Million) Forecast, by Application 2019 & 2032
- Table 46: United Kingdom Blood Flow Measurement Devices Industry Volume (K Unit) Forecast, by Application 2019 & 2032
- Table 47: France Blood Flow Measurement Devices Industry Revenue (Million) Forecast, by Application 2019 & 2032
- Table 48: France Blood Flow Measurement Devices Industry Volume (K Unit) Forecast, by Application 2019 & 2032
- Table 49: Italy Blood Flow Measurement Devices Industry Revenue (Million) Forecast, by Application 2019 & 2032
- Table 50: Italy Blood Flow Measurement Devices Industry Volume (K Unit) Forecast, by Application 2019 & 2032
- Table 51: Spain Blood Flow Measurement Devices Industry Revenue (Million) Forecast, by Application 2019 & 2032
- Table 52: Spain Blood Flow Measurement Devices Industry Volume (K Unit) Forecast, by Application 2019 & 2032
- Table 53: Rest of Europe Blood Flow Measurement Devices Industry Revenue (Million) Forecast, by Application 2019 & 2032
- Table 54: Rest of Europe Blood Flow Measurement Devices Industry Volume (K Unit) Forecast, by Application 2019 & 2032
- Table 55: Global Blood Flow Measurement Devices Industry Revenue Million Forecast, by Product 2019 & 2032
- Table 56: Global Blood Flow Measurement Devices Industry Volume K Unit Forecast, by Product 2019 & 2032
- Table 57: Global Blood Flow Measurement Devices Industry Revenue Million Forecast, by Application 2019 & 2032
- Table 58: Global Blood Flow Measurement Devices Industry Volume K Unit Forecast, by Application 2019 & 2032
- Table 59: Global Blood Flow Measurement Devices Industry Revenue Million Forecast, by End-User 2019 & 2032
- Table 60: Global Blood Flow Measurement Devices Industry Volume K Unit Forecast, by End-User 2019 & 2032
- Table 61: Global Blood Flow Measurement Devices Industry Revenue Million Forecast, by Country 2019 & 2032
- Table 62: Global Blood Flow Measurement Devices Industry Volume K Unit Forecast, by Country 2019 & 2032
- Table 63: China Blood Flow Measurement Devices Industry Revenue (Million) Forecast, by Application 2019 & 2032
- Table 64: China Blood Flow Measurement Devices Industry Volume (K Unit) Forecast, by Application 2019 & 2032
- Table 65: Japan Blood Flow Measurement Devices Industry Revenue (Million) Forecast, by Application 2019 & 2032
- Table 66: Japan Blood Flow Measurement Devices Industry Volume (K Unit) Forecast, by Application 2019 & 2032
- Table 67: India Blood Flow Measurement Devices Industry Revenue (Million) Forecast, by Application 2019 & 2032
- Table 68: India Blood Flow Measurement Devices Industry Volume (K Unit) Forecast, by Application 2019 & 2032
- Table 69: Australia Blood Flow Measurement Devices Industry Revenue (Million) Forecast, by Application 2019 & 2032
- Table 70: Australia Blood Flow Measurement Devices Industry Volume (K Unit) Forecast, by Application 2019 & 2032
- Table 71: South Korea Blood Flow Measurement Devices Industry Revenue (Million) Forecast, by Application 2019 & 2032
- Table 72: South Korea Blood Flow Measurement Devices Industry Volume (K Unit) Forecast, by Application 2019 & 2032
- Table 73: Rest of Asia Pacific Blood Flow Measurement Devices Industry Revenue (Million) Forecast, by Application 2019 & 2032
- Table 74: Rest of Asia Pacific Blood Flow Measurement Devices Industry Volume (K Unit) Forecast, by Application 2019 & 2032
- Table 75: Global Blood Flow Measurement Devices Industry Revenue Million Forecast, by Product 2019 & 2032
- Table 76: Global Blood Flow Measurement Devices Industry Volume K Unit Forecast, by Product 2019 & 2032
- Table 77: Global Blood Flow Measurement Devices Industry Revenue Million Forecast, by Application 2019 & 2032
- Table 78: Global Blood Flow Measurement Devices Industry Volume K Unit Forecast, by Application 2019 & 2032
- Table 79: Global Blood Flow Measurement Devices Industry Revenue Million Forecast, by End-User 2019 & 2032
- Table 80: Global Blood Flow Measurement Devices Industry Volume K Unit Forecast, by End-User 2019 & 2032
- Table 81: Global Blood Flow Measurement Devices Industry Revenue Million Forecast, by Country 2019 & 2032
- Table 82: Global Blood Flow Measurement Devices Industry Volume K Unit Forecast, by Country 2019 & 2032
- Table 83: GCC Blood Flow Measurement Devices Industry Revenue (Million) Forecast, by Application 2019 & 2032
- Table 84: GCC Blood Flow Measurement Devices Industry Volume (K Unit) Forecast, by Application 2019 & 2032
- Table 85: South Africa Blood Flow Measurement Devices Industry Revenue (Million) Forecast, by Application 2019 & 2032
- Table 86: South Africa Blood Flow Measurement Devices Industry Volume (K Unit) Forecast, by Application 2019 & 2032
- Table 87: Rest of Middle East and Africa Blood Flow Measurement Devices Industry Revenue (Million) Forecast, by Application 2019 & 2032
- Table 88: Rest of Middle East and Africa Blood Flow Measurement Devices Industry Volume (K Unit) Forecast, by Application 2019 & 2032
- Table 89: Global Blood Flow Measurement Devices Industry Revenue Million Forecast, by Product 2019 & 2032
- Table 90: Global Blood Flow Measurement Devices Industry Volume K Unit Forecast, by Product 2019 & 2032
- Table 91: Global Blood Flow Measurement Devices Industry Revenue Million Forecast, by Application 2019 & 2032
- Table 92: Global Blood Flow Measurement Devices Industry Volume K Unit Forecast, by Application 2019 & 2032
- Table 93: Global Blood Flow Measurement Devices Industry Revenue Million Forecast, by End-User 2019 & 2032
- Table 94: Global Blood Flow Measurement Devices Industry Volume K Unit Forecast, by End-User 2019 & 2032
- Table 95: Global Blood Flow Measurement Devices Industry Revenue Million Forecast, by Country 2019 & 2032
- Table 96: Global Blood Flow Measurement Devices Industry Volume K Unit Forecast, by Country 2019 & 2032
- Table 97: Brazil Blood Flow Measurement Devices Industry Revenue (Million) Forecast, by Application 2019 & 2032
- Table 98: Brazil Blood Flow Measurement Devices Industry Volume (K Unit) Forecast, by Application 2019 & 2032
- Table 99: Argentina Blood Flow Measurement Devices Industry Revenue (Million) Forecast, by Application 2019 & 2032
- Table 100: Argentina Blood Flow Measurement Devices Industry Volume (K Unit) Forecast, by Application 2019 & 2032
- Table 101: Rest of South America Blood Flow Measurement Devices Industry Revenue (Million) Forecast, by Application 2019 & 2032
- Table 102: Rest of South America Blood Flow Measurement Devices Industry Volume (K Unit) Forecast, by Application 2019 & 2032
Frequently Asked Questions
1. What is the projected Compound Annual Growth Rate (CAGR) of the Blood Flow Measurement Devices Industry?
The projected CAGR is approximately 9.20%.
2. Which companies are prominent players in the Blood Flow Measurement Devices Industry?
Key companies in the market include Perimed AB, Deltex Medical Group, Medistim ASA, Compumedics, Atys Medical, Cook Group Incorporated, Carolina Medical Inc, SONOTEC GmbH, Transonic, ADInstruments, ArjoHuntleigh Inc, Moor Instruments Ltd.
3. What are the main segments of the Blood Flow Measurement Devices Industry?
The market segments include Product, Application, End-User.
4. Can you provide details about the market size?
The market size is estimated to be USD XX Million as of 2022.
5. What are some drivers contributing to market growth?
Increasing Prevalence of Cardiovascular Diseases and Growing Geriatric Population; Advancements in Product Technologies.
6. What are the notable trends driving market growth?
Ultrasound Dopplers Segment is Expected to Hold a Major Market Share in the Blood Flow Measurement Devices Market..
7. Are there any restraints impacting market growth?
High Cost of Blood Flow Measurement Devices; Limited Reimbursement Scenario.
8. Can you provide examples of recent developments in the market?
In May 2022, HealthTech AI company NuraLogix launched their 30-second contactless blood pressure and vital sign measurement technology in Singapore.
9. What pricing options are available for accessing the report?
Pricing options include single-user, multi-user, and enterprise licenses priced at USD 4750, USD 5250, and USD 8750 respectively.
10. Is the market size provided in terms of value or volume?
The market size is provided in terms of value, measured in Million and volume, measured in K Unit.
11. Are there any specific market keywords associated with the report?
Yes, the market keyword associated with the report is "Blood Flow Measurement Devices Industry," which aids in identifying and referencing the specific market segment covered.
12. How do I determine which pricing option suits my needs best?
The pricing options vary based on user requirements and access needs. Individual users may opt for single-user licenses, while businesses requiring broader access may choose multi-user or enterprise licenses for cost-effective access to the report.
13. Are there any additional resources or data provided in the Blood Flow Measurement Devices Industry report?
While the report offers comprehensive insights, it's advisable to review the specific contents or supplementary materials provided to ascertain if additional resources or data are available.
14. How can I stay updated on further developments or reports in the Blood Flow Measurement Devices Industry?
To stay informed about further developments, trends, and reports in the Blood Flow Measurement Devices Industry, consider subscribing to industry newsletters, following relevant companies and organizations, or regularly checking reputable industry news sources and publications.
Methodology
Step 1 - Identification of Relevant Samples Size from Population Database


Step 2 - Approaches for Defining Global Market Size (Value, Volume* & Price*)

Note*: In applicable scenarios
Step 3 - Data Sources
Primary Research
- Web Analytics
- Survey Reports
- Research Institute
- Latest Research Reports
- Opinion Leaders
Secondary Research
- Annual Reports
- White Paper
- Latest Press Release
- Industry Association
- Paid Database
- Investor Presentations

Step 4 - Data Triangulation
Involves using different sources of information in order to increase the validity of a study
These sources are likely to be stakeholders in a program - participants, other researchers, program staff, other community members, and so on.
Then we put all data in single framework & apply various statistical tools to find out the dynamic on the market.
During the analysis stage, feedback from the stakeholder groups would be compared to determine areas of agreement as well as areas of divergence


