
Key Insights
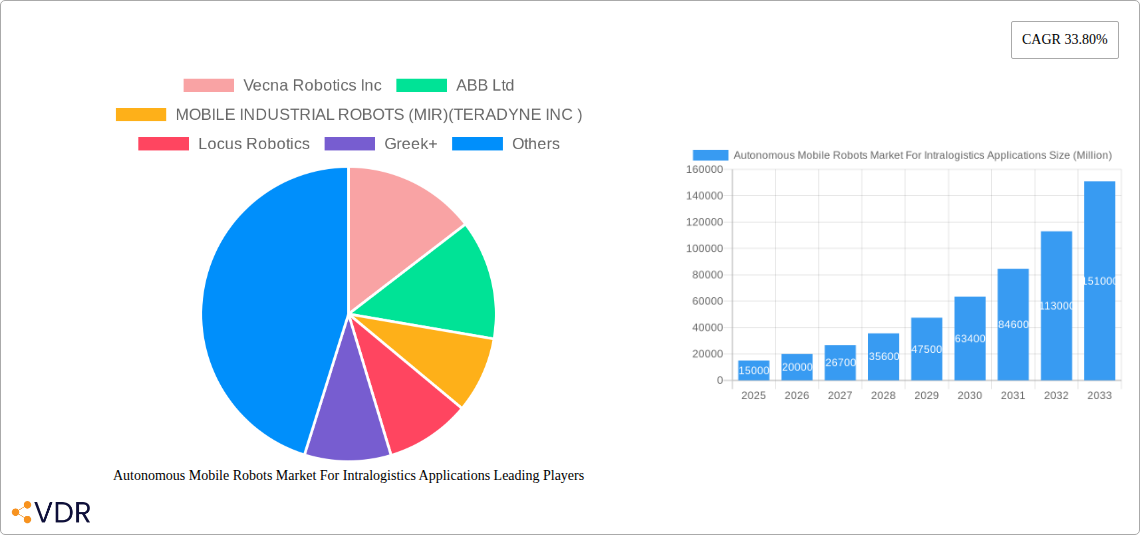
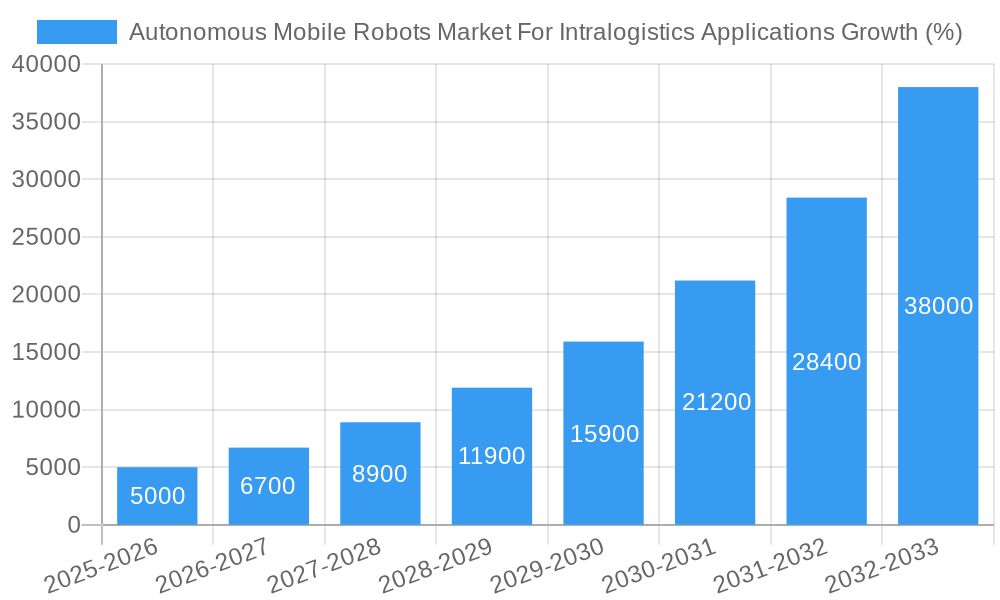
The Autonomous Mobile Robots (AMR) market for intralogistics applications is experiencing explosive growth, projected to reach a substantial size driven by the increasing demand for automation in warehouses, manufacturing facilities, and distribution centers. The market's Compound Annual Growth Rate (CAGR) of 33.80% from 2019-2033 signifies a significant upward trajectory. This growth is fueled by several key factors: the escalating need for efficiency and productivity improvements in supply chains, the rising labor costs and shortages, the increasing adoption of e-commerce and its associated order fulfillment complexities, and the advancements in robotics technology leading to more sophisticated, reliable, and cost-effective AMRs. Key market segments like the manufacturing sector (particularly automotive, electronics, and pharmaceuticals) are showing high adoption rates due to the need for precise material handling and optimized production workflows. Similarly, the non-manufacturing sector (logistics and warehousing) is witnessing significant AMR deployment to accelerate order fulfillment and reduce operational bottlenecks. Different AMR form factors, including tow tractors, order pickers, and load carriers, cater to the diverse needs of various industries, further contributing to market expansion.
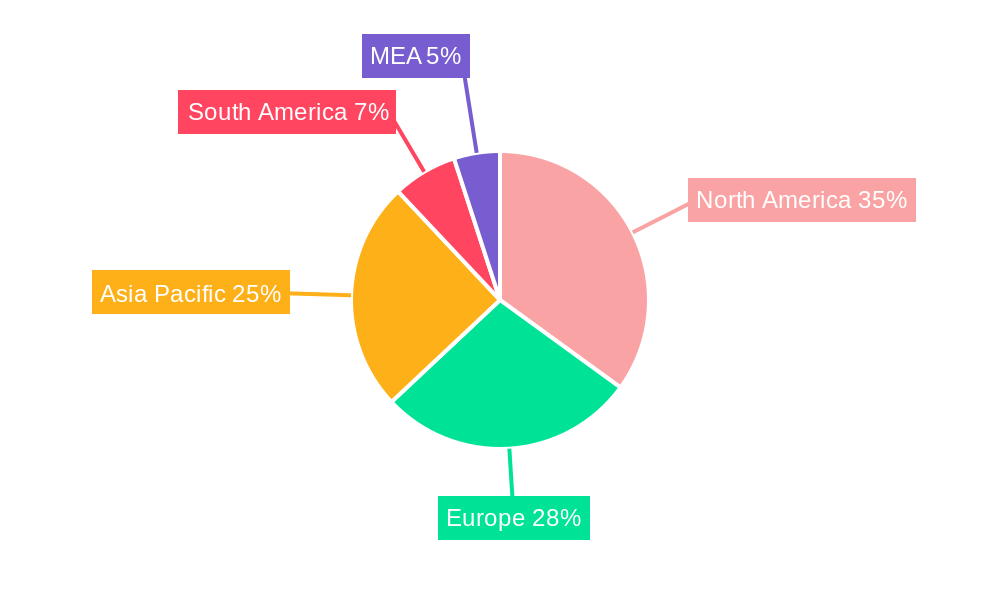
While the market enjoys considerable momentum, challenges remain. High initial investment costs for AMR implementation can be a barrier for entry for some businesses. Furthermore, concerns surrounding the integration of AMRs with existing warehouse management systems (WMS) and the need for skilled personnel to operate and maintain these systems necessitate addressing these factors for sustained growth. Despite these hurdles, ongoing technological advancements, decreasing hardware costs, and the increasing availability of user-friendly software solutions are likely to mitigate these challenges and fuel continued market expansion in the forecast period (2025-2033). The geographical distribution of the market is expected to be skewed towards regions like North America and Asia Pacific, reflecting higher levels of automation adoption and industrialization in these regions, followed by Europe and other developing markets.
Autonomous Mobile Robots Market for Intralogistics Applications: A Comprehensive Report (2019-2033)
This in-depth report provides a comprehensive analysis of the Autonomous Mobile Robots (AMRs) market for intralogistics applications, covering market dynamics, growth trends, regional segmentation, product landscape, key players, and future outlook. The report offers valuable insights for industry professionals, investors, and strategic decision-makers seeking to understand and capitalize on the rapidly evolving AMR landscape. With a study period spanning 2019-2033, a base year of 2025, and an estimated year of 2025, this report provides a robust forecast (2025-2033) and historical perspective (2019-2024). The market is segmented by environment of operation (manufacturing and non-manufacturing) and form factor (tow/tractor/tug, order picking/fulfillment, load carrying), providing granular analysis for informed decision-making. The parent market is Intralogistics, and the child market is Autonomous Mobile Robots. Expected market size for 2025 is projected to be xx Million units.
Autonomous Mobile Robots Market For Intralogistics Applications Market Dynamics & Structure
The Autonomous Mobile Robots market for intralogistics applications is characterized by increasing market concentration amongst key players. Technological innovation, particularly in AI, navigation, and sensor technologies, fuels significant market growth. However, regulatory frameworks surrounding safety and data privacy present ongoing challenges. Competitive product substitutes, such as traditional automated guided vehicles (AGVs), continue to exist, although AMRs are gradually gaining market share due to their flexibility and adaptability. The end-user demographic is broad, encompassing manufacturing (automotive, electrical & electronics, food & beverage, chemical & pharmaceuticals) and non-manufacturing sectors (logistics centers, distribution centers, warehouses).
- Market Concentration: The market exhibits a moderately concentrated structure, with a handful of major players holding a significant share. The top five players command approximately xx% of the market share in 2025.
- Technological Innovation: Advancements in AI-powered navigation, computer vision, and sensor fusion are driving the adoption of more sophisticated and reliable AMRs.
- Regulatory Landscape: Safety regulations and data privacy concerns present both opportunities and challenges, shaping technological development and market expansion.
- Competitive Substitutes: Traditional AGVs remain a competitive alternative, but AMRs are increasingly preferred for their flexibility and cost-effectiveness in dynamic environments.
- M&A Activity: The past five years have witnessed xx M&A deals in the AMR sector, indicating consolidation and strategic expansion amongst key players. This activity is predicted to increase by xx% in the coming years.
- End-User Demographics: The manufacturing sector, particularly automotive and electronics, currently dominates AMR adoption, but the non-manufacturing sector shows significant growth potential.
Autonomous Mobile Robots Market For Intralogistics Applications Growth Trends & Insights
The global autonomous mobile robot market for intralogistics is experiencing rapid expansion. Driven by the increasing demand for automation in warehouses and manufacturing facilities, the market is projected to achieve a Compound Annual Growth Rate (CAGR) of xx% from 2025 to 2033. This growth is fueled by the rising adoption rates across various industries, particularly in e-commerce, where efficient order fulfillment is critical. Technological advancements, such as improved navigation systems and AI-powered decision-making, are further enhancing the capabilities and efficiency of AMRs. Consumer behavior shifts, particularly the increased demand for faster and more efficient delivery, are also significant drivers for market growth. Market penetration in the logistics sector is expected to reach xx% by 2033, reflecting a considerable shift from traditional methods. The market is expected to reach xx Million units by 2033.
Dominant Regions, Countries, or Segments in Autonomous Mobile Robots Market For Intralogistics Applications
North America and Europe currently lead the market due to high levels of automation adoption and technological advancement. However, the Asia-Pacific region is projected to show the highest growth rate due to rapid industrialization and expanding e-commerce sectors. Within segments, the manufacturing sector (particularly automotive and electronics) demonstrates strong adoption of AMRs for material handling, while the non-manufacturing sector (warehousing and logistics) is rapidly expanding due to the escalating demands of e-commerce fulfillment. The Order Picking/Fulfillment segment shows the highest market share followed by Tow/Tractor/Tug due to its wide applications in intralogistics sector.
- Key Drivers:
- Strong government support for automation initiatives in developed economies.
- High labor costs and workforce shortages drive automation adoption.
- Increased demand for efficient and flexible material handling solutions.
- Dominance Factors:
- North America and Europe benefit from early adoption and robust technological infrastructure.
- Asia-Pacific's rapid economic growth fuels significant market expansion.
- The manufacturing sector leads in AMR implementation due to established automation practices.
- The non-manufacturing sector (warehousing and logistics) shows strong growth potential fueled by e-commerce.
Autonomous Mobile Robots Market For Intralogistics Applications Product Landscape
The AMR product landscape is characterized by continuous innovation, with manufacturers focusing on improving navigation accuracy, payload capacity, and operational efficiency. AMRs are now equipped with advanced features such as AI-powered path planning, obstacle avoidance, and sophisticated sensor integration for seamless operation in complex environments. Unique selling propositions include ease of deployment, flexible integration with existing warehouse management systems (WMS), and enhanced safety features. Technological advancements encompass improved battery life, enhanced payload capacity, and more intuitive human-machine interfaces.
Key Drivers, Barriers & Challenges in Autonomous Mobile Robots Market For Intralogistics Applications
Key Drivers:
- Rising labor costs and shortages: Automation is increasingly attractive in light of higher labor costs and workforce scarcity across various industries.
- E-commerce boom: The rapid growth of e-commerce fuels the demand for efficient order fulfillment and faster delivery.
- Technological advancements: Continuous innovation in robotics, AI, and sensor technologies improves AMR capabilities and reduces costs.
Key Challenges & Restraints:
- High initial investment costs: The significant upfront investment for AMR implementation can be a barrier for some businesses.
- Integration complexities: Seamless integration with existing warehouse management systems (WMS) can be complex and time-consuming.
- Safety concerns: Ensuring the safe operation of AMRs in dynamic environments necessitates robust safety mechanisms. This increases the overall cost and potentially slows down the implementation.
- Lack of skilled workforce: The effective operation and maintenance of AMRs require a skilled workforce, which can be scarce in certain regions.
Emerging Opportunities in Autonomous Mobile Robots Market For Intralogistics Applications
- Untapped markets: Developing economies present significant growth potential for AMR adoption, with increasing automation needs across various sectors.
- Innovative applications: The development of specialized AMRs for specific tasks within the intralogistics sector opens up new market opportunities.
- Evolving consumer preferences: The growing consumer demand for faster delivery times and increased transparency in the supply chain stimulates innovation in AMR technologies.
Growth Accelerators in the Autonomous Mobile Robots Market For Intralogistics Applications Industry
Technological breakthroughs in AI, computer vision, and sensor technology continue to drive innovation in AMR capabilities. Strategic partnerships between AMR providers and leading logistics companies accelerate market adoption. Market expansion strategies, focusing on untapped markets and diverse applications, are crucial for sustained growth. A key factor is the increasing integration of AMRs with existing warehouse management systems (WMS), creating a unified and efficient workflow.
Key Players Shaping the Autonomous Mobile Robots Market For Intralogistics Applications Market
- Vecna Robotics Inc
- ABB Ltd
- MOBILE INDUSTRIAL ROBOTS (MIR)(TERADYNE INC )
- Locus Robotics
- Greek+
- Guozi Robotics
- Seegrid
- Fetch Robotics
- Aethon
- KION GROUP AG
- HikRobot
- Addverb Technologies Limited
- Agilox
- Suzhou Junion Intelligent Technology Co Ltd
- Dematic
- Grey Orange Pte Ltd
- 6 River Systems LLC
- Clearpath
- Omron
Notable Milestones in Autonomous Mobile Robots Market For Intralogistics Applications Sector
- September 2023: Solo Brands Inc. and Locus Robotics announced a strategic partnership to streamline order fulfillment using AMRs.
- September 2023: OTTO Motors launched the OTTO 1200, a heavy-duty AMR designed for tight spaces.
In-Depth Autonomous Mobile Robots Market For Intralogistics Applications Market Outlook
The future of the Autonomous Mobile Robots market for intralogistics applications is exceptionally promising. Continued technological advancements, strategic partnerships, and expansion into new markets will drive significant growth. The increasing demand for efficient and flexible intralogistics solutions, coupled with the rising adoption of e-commerce, positions the AMR market for sustained expansion and significant market potential in the coming years. Strategic opportunities lie in developing specialized AMRs, enhancing integration capabilities, and addressing emerging market needs in developing economies.
Autonomous Mobile Robots Market For Intralogistics Applications Segmentation
-
1. Form Factor
- 1.1. Tow/Tractor/Tug
- 1.2. Order Pi
- 1.3. Load Carrying (Forklifts/Counterbalance)
-
2. Environment of Operation
- 2.1. Manufact
- 2.2. Non-Manu
Autonomous Mobile Robots Market For Intralogistics Applications Segmentation By Geography
- 1. United States
- 2. Europe
- 3. Asia Pacific
- 4. China
- 5. India
- 6. Rest of the World
Autonomous Mobile Robots Market For Intralogistics Applications REPORT HIGHLIGHTS
| Aspects | Details |
|---|---|
| Study Period | 2019-2033 |
| Base Year | 2024 |
| Estimated Year | 2025 |
| Forecast Period | 2025-2033 |
| Historical Period | 2019-2024 |
| Growth Rate | CAGR of 33.80% from 2019-2033 |
| Segmentation |
|
Table of Contents
- 1. Introduction
- 1.1. Research Scope
- 1.2. Market Segmentation
- 1.3. Research Methodology
- 1.4. Definitions and Assumptions
- 2. Executive Summary
- 2.1. Introduction
- 3. Market Dynamics
- 3.1. Introduction
- 3.2. Market Drivers
- 3.2.1. Increasing Demand for Automation across the End-user Industries; Labor-related Challenges Coupled with Advancements in Technology
- 3.3. Market Restrains
- 3.3.1. Communication and Connectivity Issues (navigation and Perception); High Capital Requirements
- 3.4. Market Trends
- 3.4.1. Manufacturing to be the Largest End-user Industry
- 4. Market Factor Analysis
- 4.1. Porters Five Forces
- 4.2. Supply/Value Chain
- 4.3. PESTEL analysis
- 4.4. Market Entropy
- 4.5. Patent/Trademark Analysis
- 5. Global Autonomous Mobile Robots Market For Intralogistics Applications Analysis, Insights and Forecast, 2019-2031
- 5.1. Market Analysis, Insights and Forecast - by Form Factor
- 5.1.1. Tow/Tractor/Tug
- 5.1.2. Order Pi
- 5.1.3. Load Carrying (Forklifts/Counterbalance)
- 5.2. Market Analysis, Insights and Forecast - by Environment of Operation
- 5.2.1. Manufact
- 5.2.2. Non-Manu
- 5.3. Market Analysis, Insights and Forecast - by Region
- 5.3.1. United States
- 5.3.2. Europe
- 5.3.3. Asia Pacific
- 5.3.4. China
- 5.3.5. India
- 5.3.6. Rest of the World
- 5.1. Market Analysis, Insights and Forecast - by Form Factor
- 6. United States Autonomous Mobile Robots Market For Intralogistics Applications Analysis, Insights and Forecast, 2019-2031
- 6.1. Market Analysis, Insights and Forecast - by Form Factor
- 6.1.1. Tow/Tractor/Tug
- 6.1.2. Order Pi
- 6.1.3. Load Carrying (Forklifts/Counterbalance)
- 6.2. Market Analysis, Insights and Forecast - by Environment of Operation
- 6.2.1. Manufact
- 6.2.2. Non-Manu
- 6.1. Market Analysis, Insights and Forecast - by Form Factor
- 7. Europe Autonomous Mobile Robots Market For Intralogistics Applications Analysis, Insights and Forecast, 2019-2031
- 7.1. Market Analysis, Insights and Forecast - by Form Factor
- 7.1.1. Tow/Tractor/Tug
- 7.1.2. Order Pi
- 7.1.3. Load Carrying (Forklifts/Counterbalance)
- 7.2. Market Analysis, Insights and Forecast - by Environment of Operation
- 7.2.1. Manufact
- 7.2.2. Non-Manu
- 7.1. Market Analysis, Insights and Forecast - by Form Factor
- 8. Asia Pacific Autonomous Mobile Robots Market For Intralogistics Applications Analysis, Insights and Forecast, 2019-2031
- 8.1. Market Analysis, Insights and Forecast - by Form Factor
- 8.1.1. Tow/Tractor/Tug
- 8.1.2. Order Pi
- 8.1.3. Load Carrying (Forklifts/Counterbalance)
- 8.2. Market Analysis, Insights and Forecast - by Environment of Operation
- 8.2.1. Manufact
- 8.2.2. Non-Manu
- 8.1. Market Analysis, Insights and Forecast - by Form Factor
- 9. China Autonomous Mobile Robots Market For Intralogistics Applications Analysis, Insights and Forecast, 2019-2031
- 9.1. Market Analysis, Insights and Forecast - by Form Factor
- 9.1.1. Tow/Tractor/Tug
- 9.1.2. Order Pi
- 9.1.3. Load Carrying (Forklifts/Counterbalance)
- 9.2. Market Analysis, Insights and Forecast - by Environment of Operation
- 9.2.1. Manufact
- 9.2.2. Non-Manu
- 9.1. Market Analysis, Insights and Forecast - by Form Factor
- 10. India Autonomous Mobile Robots Market For Intralogistics Applications Analysis, Insights and Forecast, 2019-2031
- 10.1. Market Analysis, Insights and Forecast - by Form Factor
- 10.1.1. Tow/Tractor/Tug
- 10.1.2. Order Pi
- 10.1.3. Load Carrying (Forklifts/Counterbalance)
- 10.2. Market Analysis, Insights and Forecast - by Environment of Operation
- 10.2.1. Manufact
- 10.2.2. Non-Manu
- 10.1. Market Analysis, Insights and Forecast - by Form Factor
- 11. Rest of the World Autonomous Mobile Robots Market For Intralogistics Applications Analysis, Insights and Forecast, 2019-2031
- 11.1. Market Analysis, Insights and Forecast - by Form Factor
- 11.1.1. Tow/Tractor/Tug
- 11.1.2. Order Pi
- 11.1.3. Load Carrying (Forklifts/Counterbalance)
- 11.2. Market Analysis, Insights and Forecast - by Environment of Operation
- 11.2.1. Manufact
- 11.2.2. Non-Manu
- 11.1. Market Analysis, Insights and Forecast - by Form Factor
- 12. North America Autonomous Mobile Robots Market For Intralogistics Applications Analysis, Insights and Forecast, 2019-2031
- 12.1. Market Analysis, Insights and Forecast - By Country/Sub-region
- 12.1.1 United States
- 12.1.2 Canada
- 12.1.3 Mexico
- 13. Europe Autonomous Mobile Robots Market For Intralogistics Applications Analysis, Insights and Forecast, 2019-2031
- 13.1. Market Analysis, Insights and Forecast - By Country/Sub-region
- 13.1.1 Germany
- 13.1.2 United Kingdom
- 13.1.3 France
- 13.1.4 Spain
- 13.1.5 Italy
- 13.1.6 Spain
- 13.1.7 Belgium
- 13.1.8 Netherland
- 13.1.9 Nordics
- 13.1.10 Rest of Europe
- 14. Asia Pacific Autonomous Mobile Robots Market For Intralogistics Applications Analysis, Insights and Forecast, 2019-2031
- 14.1. Market Analysis, Insights and Forecast - By Country/Sub-region
- 14.1.1 China
- 14.1.2 Japan
- 14.1.3 India
- 14.1.4 South Korea
- 14.1.5 Southeast Asia
- 14.1.6 Australia
- 14.1.7 Indonesia
- 14.1.8 Phillipes
- 14.1.9 Singapore
- 14.1.10 Thailandc
- 14.1.11 Rest of Asia Pacific
- 15. South America Autonomous Mobile Robots Market For Intralogistics Applications Analysis, Insights and Forecast, 2019-2031
- 15.1. Market Analysis, Insights and Forecast - By Country/Sub-region
- 15.1.1 Brazil
- 15.1.2 Argentina
- 15.1.3 Peru
- 15.1.4 Chile
- 15.1.5 Colombia
- 15.1.6 Ecuador
- 15.1.7 Venezuela
- 15.1.8 Rest of South America
- 16. MEA Autonomous Mobile Robots Market For Intralogistics Applications Analysis, Insights and Forecast, 2019-2031
- 16.1. Market Analysis, Insights and Forecast - By Country/Sub-region
- 16.1.1 United Arab Emirates
- 16.1.2 Saudi Arabia
- 16.1.3 South Africa
- 16.1.4 Rest of Middle East and Africa
- 17. Competitive Analysis
- 17.1. Global Market Share Analysis 2024
- 17.2. Company Profiles
- 17.2.1 Vecna Robotics Inc
- 17.2.1.1. Overview
- 17.2.1.2. Products
- 17.2.1.3. SWOT Analysis
- 17.2.1.4. Recent Developments
- 17.2.1.5. Financials (Based on Availability)
- 17.2.2 ABB Ltd
- 17.2.2.1. Overview
- 17.2.2.2. Products
- 17.2.2.3. SWOT Analysis
- 17.2.2.4. Recent Developments
- 17.2.2.5. Financials (Based on Availability)
- 17.2.3 MOBILE INDUSTRIAL ROBOTS (MIR)(TERADYNE INC )
- 17.2.3.1. Overview
- 17.2.3.2. Products
- 17.2.3.3. SWOT Analysis
- 17.2.3.4. Recent Developments
- 17.2.3.5. Financials (Based on Availability)
- 17.2.4 Locus Robotics
- 17.2.4.1. Overview
- 17.2.4.2. Products
- 17.2.4.3. SWOT Analysis
- 17.2.4.4. Recent Developments
- 17.2.4.5. Financials (Based on Availability)
- 17.2.5 Greek+
- 17.2.5.1. Overview
- 17.2.5.2. Products
- 17.2.5.3. SWOT Analysis
- 17.2.5.4. Recent Developments
- 17.2.5.5. Financials (Based on Availability)
- 17.2.6 Guozi Robotics
- 17.2.6.1. Overview
- 17.2.6.2. Products
- 17.2.6.3. SWOT Analysis
- 17.2.6.4. Recent Developments
- 17.2.6.5. Financials (Based on Availability)
- 17.2.7 Seegrid
- 17.2.7.1. Overview
- 17.2.7.2. Products
- 17.2.7.3. SWOT Analysis
- 17.2.7.4. Recent Developments
- 17.2.7.5. Financials (Based on Availability)
- 17.2.8 Fetch Robotics
- 17.2.8.1. Overview
- 17.2.8.2. Products
- 17.2.8.3. SWOT Analysis
- 17.2.8.4. Recent Developments
- 17.2.8.5. Financials (Based on Availability)
- 17.2.9 Aethon
- 17.2.9.1. Overview
- 17.2.9.2. Products
- 17.2.9.3. SWOT Analysis
- 17.2.9.4. Recent Developments
- 17.2.9.5. Financials (Based on Availability)
- 17.2.10 KION GROUP AG
- 17.2.10.1. Overview
- 17.2.10.2. Products
- 17.2.10.3. SWOT Analysis
- 17.2.10.4. Recent Developments
- 17.2.10.5. Financials (Based on Availability)
- 17.2.11 HikRobot
- 17.2.11.1. Overview
- 17.2.11.2. Products
- 17.2.11.3. SWOT Analysis
- 17.2.11.4. Recent Developments
- 17.2.11.5. Financials (Based on Availability)
- 17.2.12 Addverb Technologies Limited
- 17.2.12.1. Overview
- 17.2.12.2. Products
- 17.2.12.3. SWOT Analysis
- 17.2.12.4. Recent Developments
- 17.2.12.5. Financials (Based on Availability)
- 17.2.13 Agilox
- 17.2.13.1. Overview
- 17.2.13.2. Products
- 17.2.13.3. SWOT Analysis
- 17.2.13.4. Recent Developments
- 17.2.13.5. Financials (Based on Availability)
- 17.2.14 Suzhou Junion Intelligent Technology Co Ltd
- 17.2.14.1. Overview
- 17.2.14.2. Products
- 17.2.14.3. SWOT Analysis
- 17.2.14.4. Recent Developments
- 17.2.14.5. Financials (Based on Availability)
- 17.2.15 Dematic
- 17.2.15.1. Overview
- 17.2.15.2. Products
- 17.2.15.3. SWOT Analysis
- 17.2.15.4. Recent Developments
- 17.2.15.5. Financials (Based on Availability)
- 17.2.16 Grey Orange Pte Ltd
- 17.2.16.1. Overview
- 17.2.16.2. Products
- 17.2.16.3. SWOT Analysis
- 17.2.16.4. Recent Developments
- 17.2.16.5. Financials (Based on Availability)
- 17.2.17 6 River Systems LLC
- 17.2.17.1. Overview
- 17.2.17.2. Products
- 17.2.17.3. SWOT Analysis
- 17.2.17.4. Recent Developments
- 17.2.17.5. Financials (Based on Availability)
- 17.2.18 Clearpath
- 17.2.18.1. Overview
- 17.2.18.2. Products
- 17.2.18.3. SWOT Analysis
- 17.2.18.4. Recent Developments
- 17.2.18.5. Financials (Based on Availability)
- 17.2.19 Omron
- 17.2.19.1. Overview
- 17.2.19.2. Products
- 17.2.19.3. SWOT Analysis
- 17.2.19.4. Recent Developments
- 17.2.19.5. Financials (Based on Availability)
- 17.2.1 Vecna Robotics Inc
List of Figures
- Figure 1: Global Autonomous Mobile Robots Market For Intralogistics Applications Revenue Breakdown (Million, %) by Region 2024 & 2032
- Figure 2: Global Autonomous Mobile Robots Market For Intralogistics Applications Volume Breakdown (K Units, %) by Region 2024 & 2032
- Figure 3: North America Autonomous Mobile Robots Market For Intralogistics Applications Revenue (Million), by Country 2024 & 2032
- Figure 4: North America Autonomous Mobile Robots Market For Intralogistics Applications Volume (K Units), by Country 2024 & 2032
- Figure 5: North America Autonomous Mobile Robots Market For Intralogistics Applications Revenue Share (%), by Country 2024 & 2032
- Figure 6: North America Autonomous Mobile Robots Market For Intralogistics Applications Volume Share (%), by Country 2024 & 2032
- Figure 7: Europe Autonomous Mobile Robots Market For Intralogistics Applications Revenue (Million), by Country 2024 & 2032
- Figure 8: Europe Autonomous Mobile Robots Market For Intralogistics Applications Volume (K Units), by Country 2024 & 2032
- Figure 9: Europe Autonomous Mobile Robots Market For Intralogistics Applications Revenue Share (%), by Country 2024 & 2032
- Figure 10: Europe Autonomous Mobile Robots Market For Intralogistics Applications Volume Share (%), by Country 2024 & 2032
- Figure 11: Asia Pacific Autonomous Mobile Robots Market For Intralogistics Applications Revenue (Million), by Country 2024 & 2032
- Figure 12: Asia Pacific Autonomous Mobile Robots Market For Intralogistics Applications Volume (K Units), by Country 2024 & 2032
- Figure 13: Asia Pacific Autonomous Mobile Robots Market For Intralogistics Applications Revenue Share (%), by Country 2024 & 2032
- Figure 14: Asia Pacific Autonomous Mobile Robots Market For Intralogistics Applications Volume Share (%), by Country 2024 & 2032
- Figure 15: South America Autonomous Mobile Robots Market For Intralogistics Applications Revenue (Million), by Country 2024 & 2032
- Figure 16: South America Autonomous Mobile Robots Market For Intralogistics Applications Volume (K Units), by Country 2024 & 2032
- Figure 17: South America Autonomous Mobile Robots Market For Intralogistics Applications Revenue Share (%), by Country 2024 & 2032
- Figure 18: South America Autonomous Mobile Robots Market For Intralogistics Applications Volume Share (%), by Country 2024 & 2032
- Figure 19: MEA Autonomous Mobile Robots Market For Intralogistics Applications Revenue (Million), by Country 2024 & 2032
- Figure 20: MEA Autonomous Mobile Robots Market For Intralogistics Applications Volume (K Units), by Country 2024 & 2032
- Figure 21: MEA Autonomous Mobile Robots Market For Intralogistics Applications Revenue Share (%), by Country 2024 & 2032
- Figure 22: MEA Autonomous Mobile Robots Market For Intralogistics Applications Volume Share (%), by Country 2024 & 2032
- Figure 23: United States Autonomous Mobile Robots Market For Intralogistics Applications Revenue (Million), by Form Factor 2024 & 2032
- Figure 24: United States Autonomous Mobile Robots Market For Intralogistics Applications Volume (K Units), by Form Factor 2024 & 2032
- Figure 25: United States Autonomous Mobile Robots Market For Intralogistics Applications Revenue Share (%), by Form Factor 2024 & 2032
- Figure 26: United States Autonomous Mobile Robots Market For Intralogistics Applications Volume Share (%), by Form Factor 2024 & 2032
- Figure 27: United States Autonomous Mobile Robots Market For Intralogistics Applications Revenue (Million), by Environment of Operation 2024 & 2032
- Figure 28: United States Autonomous Mobile Robots Market For Intralogistics Applications Volume (K Units), by Environment of Operation 2024 & 2032
- Figure 29: United States Autonomous Mobile Robots Market For Intralogistics Applications Revenue Share (%), by Environment of Operation 2024 & 2032
- Figure 30: United States Autonomous Mobile Robots Market For Intralogistics Applications Volume Share (%), by Environment of Operation 2024 & 2032
- Figure 31: United States Autonomous Mobile Robots Market For Intralogistics Applications Revenue (Million), by Country 2024 & 2032
- Figure 32: United States Autonomous Mobile Robots Market For Intralogistics Applications Volume (K Units), by Country 2024 & 2032
- Figure 33: United States Autonomous Mobile Robots Market For Intralogistics Applications Revenue Share (%), by Country 2024 & 2032
- Figure 34: United States Autonomous Mobile Robots Market For Intralogistics Applications Volume Share (%), by Country 2024 & 2032
- Figure 35: Europe Autonomous Mobile Robots Market For Intralogistics Applications Revenue (Million), by Form Factor 2024 & 2032
- Figure 36: Europe Autonomous Mobile Robots Market For Intralogistics Applications Volume (K Units), by Form Factor 2024 & 2032
- Figure 37: Europe Autonomous Mobile Robots Market For Intralogistics Applications Revenue Share (%), by Form Factor 2024 & 2032
- Figure 38: Europe Autonomous Mobile Robots Market For Intralogistics Applications Volume Share (%), by Form Factor 2024 & 2032
- Figure 39: Europe Autonomous Mobile Robots Market For Intralogistics Applications Revenue (Million), by Environment of Operation 2024 & 2032
- Figure 40: Europe Autonomous Mobile Robots Market For Intralogistics Applications Volume (K Units), by Environment of Operation 2024 & 2032
- Figure 41: Europe Autonomous Mobile Robots Market For Intralogistics Applications Revenue Share (%), by Environment of Operation 2024 & 2032
- Figure 42: Europe Autonomous Mobile Robots Market For Intralogistics Applications Volume Share (%), by Environment of Operation 2024 & 2032
- Figure 43: Europe Autonomous Mobile Robots Market For Intralogistics Applications Revenue (Million), by Country 2024 & 2032
- Figure 44: Europe Autonomous Mobile Robots Market For Intralogistics Applications Volume (K Units), by Country 2024 & 2032
- Figure 45: Europe Autonomous Mobile Robots Market For Intralogistics Applications Revenue Share (%), by Country 2024 & 2032
- Figure 46: Europe Autonomous Mobile Robots Market For Intralogistics Applications Volume Share (%), by Country 2024 & 2032
- Figure 47: Asia Pacific Autonomous Mobile Robots Market For Intralogistics Applications Revenue (Million), by Form Factor 2024 & 2032
- Figure 48: Asia Pacific Autonomous Mobile Robots Market For Intralogistics Applications Volume (K Units), by Form Factor 2024 & 2032
- Figure 49: Asia Pacific Autonomous Mobile Robots Market For Intralogistics Applications Revenue Share (%), by Form Factor 2024 & 2032
- Figure 50: Asia Pacific Autonomous Mobile Robots Market For Intralogistics Applications Volume Share (%), by Form Factor 2024 & 2032
- Figure 51: Asia Pacific Autonomous Mobile Robots Market For Intralogistics Applications Revenue (Million), by Environment of Operation 2024 & 2032
- Figure 52: Asia Pacific Autonomous Mobile Robots Market For Intralogistics Applications Volume (K Units), by Environment of Operation 2024 & 2032
- Figure 53: Asia Pacific Autonomous Mobile Robots Market For Intralogistics Applications Revenue Share (%), by Environment of Operation 2024 & 2032
- Figure 54: Asia Pacific Autonomous Mobile Robots Market For Intralogistics Applications Volume Share (%), by Environment of Operation 2024 & 2032
- Figure 55: Asia Pacific Autonomous Mobile Robots Market For Intralogistics Applications Revenue (Million), by Country 2024 & 2032
- Figure 56: Asia Pacific Autonomous Mobile Robots Market For Intralogistics Applications Volume (K Units), by Country 2024 & 2032
- Figure 57: Asia Pacific Autonomous Mobile Robots Market For Intralogistics Applications Revenue Share (%), by Country 2024 & 2032
- Figure 58: Asia Pacific Autonomous Mobile Robots Market For Intralogistics Applications Volume Share (%), by Country 2024 & 2032
- Figure 59: China Autonomous Mobile Robots Market For Intralogistics Applications Revenue (Million), by Form Factor 2024 & 2032
- Figure 60: China Autonomous Mobile Robots Market For Intralogistics Applications Volume (K Units), by Form Factor 2024 & 2032
- Figure 61: China Autonomous Mobile Robots Market For Intralogistics Applications Revenue Share (%), by Form Factor 2024 & 2032
- Figure 62: China Autonomous Mobile Robots Market For Intralogistics Applications Volume Share (%), by Form Factor 2024 & 2032
- Figure 63: China Autonomous Mobile Robots Market For Intralogistics Applications Revenue (Million), by Environment of Operation 2024 & 2032
- Figure 64: China Autonomous Mobile Robots Market For Intralogistics Applications Volume (K Units), by Environment of Operation 2024 & 2032
- Figure 65: China Autonomous Mobile Robots Market For Intralogistics Applications Revenue Share (%), by Environment of Operation 2024 & 2032
- Figure 66: China Autonomous Mobile Robots Market For Intralogistics Applications Volume Share (%), by Environment of Operation 2024 & 2032
- Figure 67: China Autonomous Mobile Robots Market For Intralogistics Applications Revenue (Million), by Country 2024 & 2032
- Figure 68: China Autonomous Mobile Robots Market For Intralogistics Applications Volume (K Units), by Country 2024 & 2032
- Figure 69: China Autonomous Mobile Robots Market For Intralogistics Applications Revenue Share (%), by Country 2024 & 2032
- Figure 70: China Autonomous Mobile Robots Market For Intralogistics Applications Volume Share (%), by Country 2024 & 2032
- Figure 71: India Autonomous Mobile Robots Market For Intralogistics Applications Revenue (Million), by Form Factor 2024 & 2032
- Figure 72: India Autonomous Mobile Robots Market For Intralogistics Applications Volume (K Units), by Form Factor 2024 & 2032
- Figure 73: India Autonomous Mobile Robots Market For Intralogistics Applications Revenue Share (%), by Form Factor 2024 & 2032
- Figure 74: India Autonomous Mobile Robots Market For Intralogistics Applications Volume Share (%), by Form Factor 2024 & 2032
- Figure 75: India Autonomous Mobile Robots Market For Intralogistics Applications Revenue (Million), by Environment of Operation 2024 & 2032
- Figure 76: India Autonomous Mobile Robots Market For Intralogistics Applications Volume (K Units), by Environment of Operation 2024 & 2032
- Figure 77: India Autonomous Mobile Robots Market For Intralogistics Applications Revenue Share (%), by Environment of Operation 2024 & 2032
- Figure 78: India Autonomous Mobile Robots Market For Intralogistics Applications Volume Share (%), by Environment of Operation 2024 & 2032
- Figure 79: India Autonomous Mobile Robots Market For Intralogistics Applications Revenue (Million), by Country 2024 & 2032
- Figure 80: India Autonomous Mobile Robots Market For Intralogistics Applications Volume (K Units), by Country 2024 & 2032
- Figure 81: India Autonomous Mobile Robots Market For Intralogistics Applications Revenue Share (%), by Country 2024 & 2032
- Figure 82: India Autonomous Mobile Robots Market For Intralogistics Applications Volume Share (%), by Country 2024 & 2032
- Figure 83: Rest of the World Autonomous Mobile Robots Market For Intralogistics Applications Revenue (Million), by Form Factor 2024 & 2032
- Figure 84: Rest of the World Autonomous Mobile Robots Market For Intralogistics Applications Volume (K Units), by Form Factor 2024 & 2032
- Figure 85: Rest of the World Autonomous Mobile Robots Market For Intralogistics Applications Revenue Share (%), by Form Factor 2024 & 2032
- Figure 86: Rest of the World Autonomous Mobile Robots Market For Intralogistics Applications Volume Share (%), by Form Factor 2024 & 2032
- Figure 87: Rest of the World Autonomous Mobile Robots Market For Intralogistics Applications Revenue (Million), by Environment of Operation 2024 & 2032
- Figure 88: Rest of the World Autonomous Mobile Robots Market For Intralogistics Applications Volume (K Units), by Environment of Operation 2024 & 2032
- Figure 89: Rest of the World Autonomous Mobile Robots Market For Intralogistics Applications Revenue Share (%), by Environment of Operation 2024 & 2032
- Figure 90: Rest of the World Autonomous Mobile Robots Market For Intralogistics Applications Volume Share (%), by Environment of Operation 2024 & 2032
- Figure 91: Rest of the World Autonomous Mobile Robots Market For Intralogistics Applications Revenue (Million), by Country 2024 & 2032
- Figure 92: Rest of the World Autonomous Mobile Robots Market For Intralogistics Applications Volume (K Units), by Country 2024 & 2032
- Figure 93: Rest of the World Autonomous Mobile Robots Market For Intralogistics Applications Revenue Share (%), by Country 2024 & 2032
- Figure 94: Rest of the World Autonomous Mobile Robots Market For Intralogistics Applications Volume Share (%), by Country 2024 & 2032
List of Tables
- Table 1: Global Autonomous Mobile Robots Market For Intralogistics Applications Revenue Million Forecast, by Region 2019 & 2032
- Table 2: Global Autonomous Mobile Robots Market For Intralogistics Applications Volume K Units Forecast, by Region 2019 & 2032
- Table 3: Global Autonomous Mobile Robots Market For Intralogistics Applications Revenue Million Forecast, by Form Factor 2019 & 2032
- Table 4: Global Autonomous Mobile Robots Market For Intralogistics Applications Volume K Units Forecast, by Form Factor 2019 & 2032
- Table 5: Global Autonomous Mobile Robots Market For Intralogistics Applications Revenue Million Forecast, by Environment of Operation 2019 & 2032
- Table 6: Global Autonomous Mobile Robots Market For Intralogistics Applications Volume K Units Forecast, by Environment of Operation 2019 & 2032
- Table 7: Global Autonomous Mobile Robots Market For Intralogistics Applications Revenue Million Forecast, by Region 2019 & 2032
- Table 8: Global Autonomous Mobile Robots Market For Intralogistics Applications Volume K Units Forecast, by Region 2019 & 2032
- Table 9: Global Autonomous Mobile Robots Market For Intralogistics Applications Revenue Million Forecast, by Country 2019 & 2032
- Table 10: Global Autonomous Mobile Robots Market For Intralogistics Applications Volume K Units Forecast, by Country 2019 & 2032
- Table 11: United States Autonomous Mobile Robots Market For Intralogistics Applications Revenue (Million) Forecast, by Application 2019 & 2032
- Table 12: United States Autonomous Mobile Robots Market For Intralogistics Applications Volume (K Units) Forecast, by Application 2019 & 2032
- Table 13: Canada Autonomous Mobile Robots Market For Intralogistics Applications Revenue (Million) Forecast, by Application 2019 & 2032
- Table 14: Canada Autonomous Mobile Robots Market For Intralogistics Applications Volume (K Units) Forecast, by Application 2019 & 2032
- Table 15: Mexico Autonomous Mobile Robots Market For Intralogistics Applications Revenue (Million) Forecast, by Application 2019 & 2032
- Table 16: Mexico Autonomous Mobile Robots Market For Intralogistics Applications Volume (K Units) Forecast, by Application 2019 & 2032
- Table 17: Global Autonomous Mobile Robots Market For Intralogistics Applications Revenue Million Forecast, by Country 2019 & 2032
- Table 18: Global Autonomous Mobile Robots Market For Intralogistics Applications Volume K Units Forecast, by Country 2019 & 2032
- Table 19: Germany Autonomous Mobile Robots Market For Intralogistics Applications Revenue (Million) Forecast, by Application 2019 & 2032
- Table 20: Germany Autonomous Mobile Robots Market For Intralogistics Applications Volume (K Units) Forecast, by Application 2019 & 2032
- Table 21: United Kingdom Autonomous Mobile Robots Market For Intralogistics Applications Revenue (Million) Forecast, by Application 2019 & 2032
- Table 22: United Kingdom Autonomous Mobile Robots Market For Intralogistics Applications Volume (K Units) Forecast, by Application 2019 & 2032
- Table 23: France Autonomous Mobile Robots Market For Intralogistics Applications Revenue (Million) Forecast, by Application 2019 & 2032
- Table 24: France Autonomous Mobile Robots Market For Intralogistics Applications Volume (K Units) Forecast, by Application 2019 & 2032
- Table 25: Spain Autonomous Mobile Robots Market For Intralogistics Applications Revenue (Million) Forecast, by Application 2019 & 2032
- Table 26: Spain Autonomous Mobile Robots Market For Intralogistics Applications Volume (K Units) Forecast, by Application 2019 & 2032
- Table 27: Italy Autonomous Mobile Robots Market For Intralogistics Applications Revenue (Million) Forecast, by Application 2019 & 2032
- Table 28: Italy Autonomous Mobile Robots Market For Intralogistics Applications Volume (K Units) Forecast, by Application 2019 & 2032
- Table 29: Spain Autonomous Mobile Robots Market For Intralogistics Applications Revenue (Million) Forecast, by Application 2019 & 2032
- Table 30: Spain Autonomous Mobile Robots Market For Intralogistics Applications Volume (K Units) Forecast, by Application 2019 & 2032
- Table 31: Belgium Autonomous Mobile Robots Market For Intralogistics Applications Revenue (Million) Forecast, by Application 2019 & 2032
- Table 32: Belgium Autonomous Mobile Robots Market For Intralogistics Applications Volume (K Units) Forecast, by Application 2019 & 2032
- Table 33: Netherland Autonomous Mobile Robots Market For Intralogistics Applications Revenue (Million) Forecast, by Application 2019 & 2032
- Table 34: Netherland Autonomous Mobile Robots Market For Intralogistics Applications Volume (K Units) Forecast, by Application 2019 & 2032
- Table 35: Nordics Autonomous Mobile Robots Market For Intralogistics Applications Revenue (Million) Forecast, by Application 2019 & 2032
- Table 36: Nordics Autonomous Mobile Robots Market For Intralogistics Applications Volume (K Units) Forecast, by Application 2019 & 2032
- Table 37: Rest of Europe Autonomous Mobile Robots Market For Intralogistics Applications Revenue (Million) Forecast, by Application 2019 & 2032
- Table 38: Rest of Europe Autonomous Mobile Robots Market For Intralogistics Applications Volume (K Units) Forecast, by Application 2019 & 2032
- Table 39: Global Autonomous Mobile Robots Market For Intralogistics Applications Revenue Million Forecast, by Country 2019 & 2032
- Table 40: Global Autonomous Mobile Robots Market For Intralogistics Applications Volume K Units Forecast, by Country 2019 & 2032
- Table 41: China Autonomous Mobile Robots Market For Intralogistics Applications Revenue (Million) Forecast, by Application 2019 & 2032
- Table 42: China Autonomous Mobile Robots Market For Intralogistics Applications Volume (K Units) Forecast, by Application 2019 & 2032
- Table 43: Japan Autonomous Mobile Robots Market For Intralogistics Applications Revenue (Million) Forecast, by Application 2019 & 2032
- Table 44: Japan Autonomous Mobile Robots Market For Intralogistics Applications Volume (K Units) Forecast, by Application 2019 & 2032
- Table 45: India Autonomous Mobile Robots Market For Intralogistics Applications Revenue (Million) Forecast, by Application 2019 & 2032
- Table 46: India Autonomous Mobile Robots Market For Intralogistics Applications Volume (K Units) Forecast, by Application 2019 & 2032
- Table 47: South Korea Autonomous Mobile Robots Market For Intralogistics Applications Revenue (Million) Forecast, by Application 2019 & 2032
- Table 48: South Korea Autonomous Mobile Robots Market For Intralogistics Applications Volume (K Units) Forecast, by Application 2019 & 2032
- Table 49: Southeast Asia Autonomous Mobile Robots Market For Intralogistics Applications Revenue (Million) Forecast, by Application 2019 & 2032
- Table 50: Southeast Asia Autonomous Mobile Robots Market For Intralogistics Applications Volume (K Units) Forecast, by Application 2019 & 2032
- Table 51: Australia Autonomous Mobile Robots Market For Intralogistics Applications Revenue (Million) Forecast, by Application 2019 & 2032
- Table 52: Australia Autonomous Mobile Robots Market For Intralogistics Applications Volume (K Units) Forecast, by Application 2019 & 2032
- Table 53: Indonesia Autonomous Mobile Robots Market For Intralogistics Applications Revenue (Million) Forecast, by Application 2019 & 2032
- Table 54: Indonesia Autonomous Mobile Robots Market For Intralogistics Applications Volume (K Units) Forecast, by Application 2019 & 2032
- Table 55: Phillipes Autonomous Mobile Robots Market For Intralogistics Applications Revenue (Million) Forecast, by Application 2019 & 2032
- Table 56: Phillipes Autonomous Mobile Robots Market For Intralogistics Applications Volume (K Units) Forecast, by Application 2019 & 2032
- Table 57: Singapore Autonomous Mobile Robots Market For Intralogistics Applications Revenue (Million) Forecast, by Application 2019 & 2032
- Table 58: Singapore Autonomous Mobile Robots Market For Intralogistics Applications Volume (K Units) Forecast, by Application 2019 & 2032
- Table 59: Thailandc Autonomous Mobile Robots Market For Intralogistics Applications Revenue (Million) Forecast, by Application 2019 & 2032
- Table 60: Thailandc Autonomous Mobile Robots Market For Intralogistics Applications Volume (K Units) Forecast, by Application 2019 & 2032
- Table 61: Rest of Asia Pacific Autonomous Mobile Robots Market For Intralogistics Applications Revenue (Million) Forecast, by Application 2019 & 2032
- Table 62: Rest of Asia Pacific Autonomous Mobile Robots Market For Intralogistics Applications Volume (K Units) Forecast, by Application 2019 & 2032
- Table 63: Global Autonomous Mobile Robots Market For Intralogistics Applications Revenue Million Forecast, by Country 2019 & 2032
- Table 64: Global Autonomous Mobile Robots Market For Intralogistics Applications Volume K Units Forecast, by Country 2019 & 2032
- Table 65: Brazil Autonomous Mobile Robots Market For Intralogistics Applications Revenue (Million) Forecast, by Application 2019 & 2032
- Table 66: Brazil Autonomous Mobile Robots Market For Intralogistics Applications Volume (K Units) Forecast, by Application 2019 & 2032
- Table 67: Argentina Autonomous Mobile Robots Market For Intralogistics Applications Revenue (Million) Forecast, by Application 2019 & 2032
- Table 68: Argentina Autonomous Mobile Robots Market For Intralogistics Applications Volume (K Units) Forecast, by Application 2019 & 2032
- Table 69: Peru Autonomous Mobile Robots Market For Intralogistics Applications Revenue (Million) Forecast, by Application 2019 & 2032
- Table 70: Peru Autonomous Mobile Robots Market For Intralogistics Applications Volume (K Units) Forecast, by Application 2019 & 2032
- Table 71: Chile Autonomous Mobile Robots Market For Intralogistics Applications Revenue (Million) Forecast, by Application 2019 & 2032
- Table 72: Chile Autonomous Mobile Robots Market For Intralogistics Applications Volume (K Units) Forecast, by Application 2019 & 2032
- Table 73: Colombia Autonomous Mobile Robots Market For Intralogistics Applications Revenue (Million) Forecast, by Application 2019 & 2032
- Table 74: Colombia Autonomous Mobile Robots Market For Intralogistics Applications Volume (K Units) Forecast, by Application 2019 & 2032
- Table 75: Ecuador Autonomous Mobile Robots Market For Intralogistics Applications Revenue (Million) Forecast, by Application 2019 & 2032
- Table 76: Ecuador Autonomous Mobile Robots Market For Intralogistics Applications Volume (K Units) Forecast, by Application 2019 & 2032
- Table 77: Venezuela Autonomous Mobile Robots Market For Intralogistics Applications Revenue (Million) Forecast, by Application 2019 & 2032
- Table 78: Venezuela Autonomous Mobile Robots Market For Intralogistics Applications Volume (K Units) Forecast, by Application 2019 & 2032
- Table 79: Rest of South America Autonomous Mobile Robots Market For Intralogistics Applications Revenue (Million) Forecast, by Application 2019 & 2032
- Table 80: Rest of South America Autonomous Mobile Robots Market For Intralogistics Applications Volume (K Units) Forecast, by Application 2019 & 2032
- Table 81: Global Autonomous Mobile Robots Market For Intralogistics Applications Revenue Million Forecast, by Country 2019 & 2032
- Table 82: Global Autonomous Mobile Robots Market For Intralogistics Applications Volume K Units Forecast, by Country 2019 & 2032
- Table 83: United Arab Emirates Autonomous Mobile Robots Market For Intralogistics Applications Revenue (Million) Forecast, by Application 2019 & 2032
- Table 84: United Arab Emirates Autonomous Mobile Robots Market For Intralogistics Applications Volume (K Units) Forecast, by Application 2019 & 2032
- Table 85: Saudi Arabia Autonomous Mobile Robots Market For Intralogistics Applications Revenue (Million) Forecast, by Application 2019 & 2032
- Table 86: Saudi Arabia Autonomous Mobile Robots Market For Intralogistics Applications Volume (K Units) Forecast, by Application 2019 & 2032
- Table 87: South Africa Autonomous Mobile Robots Market For Intralogistics Applications Revenue (Million) Forecast, by Application 2019 & 2032
- Table 88: South Africa Autonomous Mobile Robots Market For Intralogistics Applications Volume (K Units) Forecast, by Application 2019 & 2032
- Table 89: Rest of Middle East and Africa Autonomous Mobile Robots Market For Intralogistics Applications Revenue (Million) Forecast, by Application 2019 & 2032
- Table 90: Rest of Middle East and Africa Autonomous Mobile Robots Market For Intralogistics Applications Volume (K Units) Forecast, by Application 2019 & 2032
- Table 91: Global Autonomous Mobile Robots Market For Intralogistics Applications Revenue Million Forecast, by Form Factor 2019 & 2032
- Table 92: Global Autonomous Mobile Robots Market For Intralogistics Applications Volume K Units Forecast, by Form Factor 2019 & 2032
- Table 93: Global Autonomous Mobile Robots Market For Intralogistics Applications Revenue Million Forecast, by Environment of Operation 2019 & 2032
- Table 94: Global Autonomous Mobile Robots Market For Intralogistics Applications Volume K Units Forecast, by Environment of Operation 2019 & 2032
- Table 95: Global Autonomous Mobile Robots Market For Intralogistics Applications Revenue Million Forecast, by Country 2019 & 2032
- Table 96: Global Autonomous Mobile Robots Market For Intralogistics Applications Volume K Units Forecast, by Country 2019 & 2032
- Table 97: Global Autonomous Mobile Robots Market For Intralogistics Applications Revenue Million Forecast, by Form Factor 2019 & 2032
- Table 98: Global Autonomous Mobile Robots Market For Intralogistics Applications Volume K Units Forecast, by Form Factor 2019 & 2032
- Table 99: Global Autonomous Mobile Robots Market For Intralogistics Applications Revenue Million Forecast, by Environment of Operation 2019 & 2032
- Table 100: Global Autonomous Mobile Robots Market For Intralogistics Applications Volume K Units Forecast, by Environment of Operation 2019 & 2032
- Table 101: Global Autonomous Mobile Robots Market For Intralogistics Applications Revenue Million Forecast, by Country 2019 & 2032
- Table 102: Global Autonomous Mobile Robots Market For Intralogistics Applications Volume K Units Forecast, by Country 2019 & 2032
- Table 103: Global Autonomous Mobile Robots Market For Intralogistics Applications Revenue Million Forecast, by Form Factor 2019 & 2032
- Table 104: Global Autonomous Mobile Robots Market For Intralogistics Applications Volume K Units Forecast, by Form Factor 2019 & 2032
- Table 105: Global Autonomous Mobile Robots Market For Intralogistics Applications Revenue Million Forecast, by Environment of Operation 2019 & 2032
- Table 106: Global Autonomous Mobile Robots Market For Intralogistics Applications Volume K Units Forecast, by Environment of Operation 2019 & 2032
- Table 107: Global Autonomous Mobile Robots Market For Intralogistics Applications Revenue Million Forecast, by Country 2019 & 2032
- Table 108: Global Autonomous Mobile Robots Market For Intralogistics Applications Volume K Units Forecast, by Country 2019 & 2032
- Table 109: Global Autonomous Mobile Robots Market For Intralogistics Applications Revenue Million Forecast, by Form Factor 2019 & 2032
- Table 110: Global Autonomous Mobile Robots Market For Intralogistics Applications Volume K Units Forecast, by Form Factor 2019 & 2032
- Table 111: Global Autonomous Mobile Robots Market For Intralogistics Applications Revenue Million Forecast, by Environment of Operation 2019 & 2032
- Table 112: Global Autonomous Mobile Robots Market For Intralogistics Applications Volume K Units Forecast, by Environment of Operation 2019 & 2032
- Table 113: Global Autonomous Mobile Robots Market For Intralogistics Applications Revenue Million Forecast, by Country 2019 & 2032
- Table 114: Global Autonomous Mobile Robots Market For Intralogistics Applications Volume K Units Forecast, by Country 2019 & 2032
- Table 115: Global Autonomous Mobile Robots Market For Intralogistics Applications Revenue Million Forecast, by Form Factor 2019 & 2032
- Table 116: Global Autonomous Mobile Robots Market For Intralogistics Applications Volume K Units Forecast, by Form Factor 2019 & 2032
- Table 117: Global Autonomous Mobile Robots Market For Intralogistics Applications Revenue Million Forecast, by Environment of Operation 2019 & 2032
- Table 118: Global Autonomous Mobile Robots Market For Intralogistics Applications Volume K Units Forecast, by Environment of Operation 2019 & 2032
- Table 119: Global Autonomous Mobile Robots Market For Intralogistics Applications Revenue Million Forecast, by Country 2019 & 2032
- Table 120: Global Autonomous Mobile Robots Market For Intralogistics Applications Volume K Units Forecast, by Country 2019 & 2032
- Table 121: Global Autonomous Mobile Robots Market For Intralogistics Applications Revenue Million Forecast, by Form Factor 2019 & 2032
- Table 122: Global Autonomous Mobile Robots Market For Intralogistics Applications Volume K Units Forecast, by Form Factor 2019 & 2032
- Table 123: Global Autonomous Mobile Robots Market For Intralogistics Applications Revenue Million Forecast, by Environment of Operation 2019 & 2032
- Table 124: Global Autonomous Mobile Robots Market For Intralogistics Applications Volume K Units Forecast, by Environment of Operation 2019 & 2032
- Table 125: Global Autonomous Mobile Robots Market For Intralogistics Applications Revenue Million Forecast, by Country 2019 & 2032
- Table 126: Global Autonomous Mobile Robots Market For Intralogistics Applications Volume K Units Forecast, by Country 2019 & 2032
Frequently Asked Questions
1. What is the projected Compound Annual Growth Rate (CAGR) of the Autonomous Mobile Robots Market For Intralogistics Applications?
The projected CAGR is approximately 33.80%.
2. Which companies are prominent players in the Autonomous Mobile Robots Market For Intralogistics Applications?
Key companies in the market include Vecna Robotics Inc, ABB Ltd, MOBILE INDUSTRIAL ROBOTS (MIR)(TERADYNE INC ), Locus Robotics, Greek+, Guozi Robotics, Seegrid, Fetch Robotics, Aethon, KION GROUP AG, HikRobot, Addverb Technologies Limited, Agilox, Suzhou Junion Intelligent Technology Co Ltd, Dematic, Grey Orange Pte Ltd, 6 River Systems LLC, Clearpath, Omron.
3. What are the main segments of the Autonomous Mobile Robots Market For Intralogistics Applications?
The market segments include Form Factor, Environment of Operation.
4. Can you provide details about the market size?
The market size is estimated to be USD XX Million as of 2022.
5. What are some drivers contributing to market growth?
Increasing Demand for Automation across the End-user Industries; Labor-related Challenges Coupled with Advancements in Technology.
6. What are the notable trends driving market growth?
Manufacturing to be the Largest End-user Industry.
7. Are there any restraints impacting market growth?
Communication and Connectivity Issues (navigation and Perception); High Capital Requirements.
8. Can you provide examples of recent developments in the market?
September 2023: Solo Brands Inc., a prominent global lifestyle brand, and Locus Robotics announced their strategic partnership. This collaboration aims to enhance and streamline Solo Brands' order fulfillment operations through the implementation of cutting-edge AI-powered Autonomous Mobile Robots (AMRs) at their fulfillment warehouse located in Mexicali, Mexico.
9. What pricing options are available for accessing the report?
Pricing options include single-user, multi-user, and enterprise licenses priced at USD 4750, USD 5250, and USD 8750 respectively.
10. Is the market size provided in terms of value or volume?
The market size is provided in terms of value, measured in Million and volume, measured in K Units.
11. Are there any specific market keywords associated with the report?
Yes, the market keyword associated with the report is "Autonomous Mobile Robots Market For Intralogistics Applications," which aids in identifying and referencing the specific market segment covered.
12. How do I determine which pricing option suits my needs best?
The pricing options vary based on user requirements and access needs. Individual users may opt for single-user licenses, while businesses requiring broader access may choose multi-user or enterprise licenses for cost-effective access to the report.
13. Are there any additional resources or data provided in the Autonomous Mobile Robots Market For Intralogistics Applications report?
While the report offers comprehensive insights, it's advisable to review the specific contents or supplementary materials provided to ascertain if additional resources or data are available.
14. How can I stay updated on further developments or reports in the Autonomous Mobile Robots Market For Intralogistics Applications?
To stay informed about further developments, trends, and reports in the Autonomous Mobile Robots Market For Intralogistics Applications, consider subscribing to industry newsletters, following relevant companies and organizations, or regularly checking reputable industry news sources and publications.
Methodology
Step 1 - Identification of Relevant Samples Size from Population Database


Step 2 - Approaches for Defining Global Market Size (Value, Volume* & Price*)

Note*: In applicable scenarios
Step 3 - Data Sources
Primary Research
- Web Analytics
- Survey Reports
- Research Institute
- Latest Research Reports
- Opinion Leaders
Secondary Research
- Annual Reports
- White Paper
- Latest Press Release
- Industry Association
- Paid Database
- Investor Presentations

Step 4 - Data Triangulation
Involves using different sources of information in order to increase the validity of a study
These sources are likely to be stakeholders in a program - participants, other researchers, program staff, other community members, and so on.
Then we put all data in single framework & apply various statistical tools to find out the dynamic on the market.
During the analysis stage, feedback from the stakeholder groups would be compared to determine areas of agreement as well as areas of divergence


